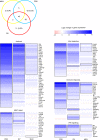
Lung epithelial cells have virus-specific and shared gene expression responses to infection by diverse respiratory viruses
- PMID: 28575086
- PMCID: PMC5456070
- DOI: 10.1371/journal.pone.0178408
Lung epithelial cells have virus-specific and shared gene expression responses to infection by diverse respiratory viruses
Abstract
The severity of respiratory viral infections is partially determined by the cellular response mounted by infected lung epithelial cells. Disease prevention and treatment is dependent on our understanding of the shared and unique responses elicited by diverse viruses, yet few studies compare host responses to viruses from different families while controlling other experimental parameters. Murine models are commonly used to study the pathogenesis of respiratory viral infections, and in vitro studies using murine cells provide mechanistic insight into the pathogenesis observed in vivo. We used microarray analysis to compare changes in gene expression of murine lung epithelial cells infected individually by three respiratory viruses causing mild (rhinovirus, RV1B), moderate (coronavirus, MHV-1), and severe (influenza A virus, PR8) disease in mice. RV1B infection caused numerous gene expression changes, but the differential effect peaked at 12 hours post-infection. PR8 altered an intermediate number of genes whose expression continued to change through 24 hours. MHV-1 had comparatively few effects on host gene expression. The viruses elicited highly overlapping responses in antiviral genes, though MHV-1 induced a lower type I interferon response than the other two viruses. Signature genes were identified for each virus and included host defense genes for PR8, tissue remodeling genes for RV1B, and transcription factors for MHV-1. Our comparative approach identified universal and specific transcriptional signatures of virus infection that can be used to distinguish shared and virus-specific mechanisms of pathogenesis in the respiratory tract.
Conflict of interest statement
Figures


Similar articles
-
Attenuation of Influenza A Virus Disease Severity by Viral Coinfection in a Mouse Model.J Virol. 2018 Nov 12;92(23):e00881-18. doi: 10.1128/JVI.00881-18. Print 2018 Dec 1. J Virol. 2018. PMID: 30232180 Free PMC article.
-
Rhinovirus Reduces the Severity of Subsequent Respiratory Viral Infections by Interferon-Dependent and -Independent Mechanisms.mSphere. 2021 Jun 30;6(3):e0047921. doi: 10.1128/mSphere.00479-21. Epub 2021 Jun 23. mSphere. 2021. PMID: 34160242 Free PMC article.
-
Differentiated phenotypes of primary murine alveolar epithelial cells and their susceptibility to infection by respiratory viruses.Virus Res. 2013 Aug;175(2):110-9. doi: 10.1016/j.virusres.2013.04.008. Epub 2013 Apr 29. Virus Res. 2013. PMID: 23639425 Free PMC article.
-
Priming With Rhinovirus Protects Mice Against a Lethal Pulmonary Coronavirus Infection.Front Immunol. 2022 May 30;13:886611. doi: 10.3389/fimmu.2022.886611. eCollection 2022. Front Immunol. 2022. PMID: 35711419 Free PMC article.
-
Natural history of murine gamma-herpesvirus infection.Philos Trans R Soc Lond B Biol Sci. 2001 Apr 29;356(1408):569-79. doi: 10.1098/rstb.2000.0779. Philos Trans R Soc Lond B Biol Sci. 2001. PMID: 11313012 Free PMC article. Review.
Cited by
-
Innate Immune Responses to Highly Pathogenic Coronaviruses and Other Significant Respiratory Viral Infections.Front Immunol. 2020 Aug 18;11:1979. doi: 10.3389/fimmu.2020.01979. eCollection 2020. Front Immunol. 2020. PMID: 32973803 Free PMC article. Review.
-
Temporal analysis of mRNA expression profiles in Orientia infected C3HeB/FeJ mouse.BMC Microbiol. 2020 Jan 6;20(1):3. doi: 10.1186/s12866-019-1684-3. BMC Microbiol. 2020. PMID: 31906849 Free PMC article.
-
Co‑expression of peripheral olfactory receptors with SARS‑CoV‑2 infection mediators: Potential implications beyond loss of smell as a COVID‑19 symptom.Int J Mol Med. 2020 Sep;46(3):949-956. doi: 10.3892/ijmm.2020.4646. Epub 2020 Jun 17. Int J Mol Med. 2020. PMID: 32705281 Free PMC article.
-
Anti-Inflammatory Effects of Cicadidae Periostracum Extract and Oleic Acid through Inhibiting Inflammatory Chemokines Using PCR Arrays in LPS-Induced Lung inflammation In Vitro.Life (Basel). 2022 Jun 8;12(6):857. doi: 10.3390/life12060857. Life (Basel). 2022. PMID: 35743888 Free PMC article.
-
Chronic exposure to arsenite enhances influenza virus infection in cultured cells.J Appl Toxicol. 2020 Apr;40(4):458-469. doi: 10.1002/jat.3918. Epub 2020 Jan 20. J Appl Toxicol. 2020. PMID: 31960482 Free PMC article.
References
-
- Bartlett NW, Walton RP, Edwards MR, Aniscenko J, Caramori G, Zhu J, et al. Mouse models of rhinovirus-induced disease and exacerbation of allergic airway inflammation. Nat Med. 2008;14(2):199–204. Epub 2008/02/05. doi: 10.1038/nm1713 - DOI - PMC - PubMed
-
- Lee SB, Song JA, Choi GE, Kim HS, Jang YJ. Rhinovirus infection in murine chronic allergic rhinosinusitis model. Int Forum Allergy Rhinol. 2016;6(11):1131–8. doi: 10.1002/alr.21805 - DOI - PubMed
-
- Nagarkar DR, Wang Q, Shim J, Zhao Y, Tsai WC, Lukacs NW, et al. CXCR2 is required for neutrophilic airway inflammation and hyperresponsiveness in a mouse model of human rhinovirus infection. J Immunol. 2009;183(10):6698–707. PubMed Central PMCID: PMCPMC2952174. doi: 10.4049/jimmunol.0900298 - DOI - PMC - PubMed
-
- Newcomb DC, Sajjan US, Nagarkar DR, Wang Q, Nanua S, Zhou Y, et al. Human rhinovirus 1B exposure induces phosphatidylinositol 3-kinase-dependent airway inflammation in mice. Am J Respir Crit Care Med. 2008;177(10):1111–21. Epub 2008/02/16. PubMed Central PMCID: PMC2383993. doi: 10.1164/rccm.200708-1243OC - DOI - PMC - PubMed
-
- Wang Q, Miller DJ, Bowman ER, Nagarkar DR, Schneider D, Zhao Y, et al. MDA5 and TLR3 initiate pro-inflammatory signaling pathways leading to rhinovirus-induced airways inflammation and hyperresponsiveness. PLoS Pathog. 2011;7(5):e1002070 PubMed Central PMCID: PMCPMC3102730. doi: 10.1371/journal.ppat.1002070 - DOI - PMC - PubMed
MeSH terms
Grants and funding
LinkOut - more resources
Full Text Sources
Other Literature Sources
Molecular Biology Databases

