. 2017 Jul 1;38(7):728-737.
doi: 10.1093/carcin/bgx049.

LTA4H regulates cell cycle and skin carcinogenesis

Affiliations

LTA4H regulates cell cycle and skin carcinogenesis

Naomi Oi et al. Carcinogenesis. .

Abstract

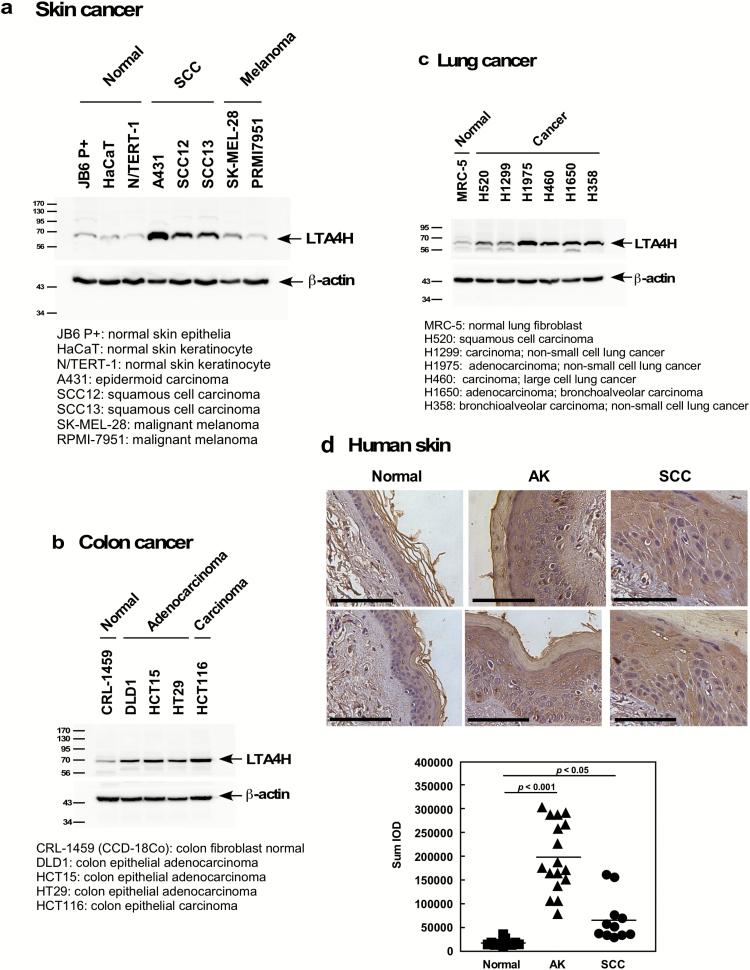
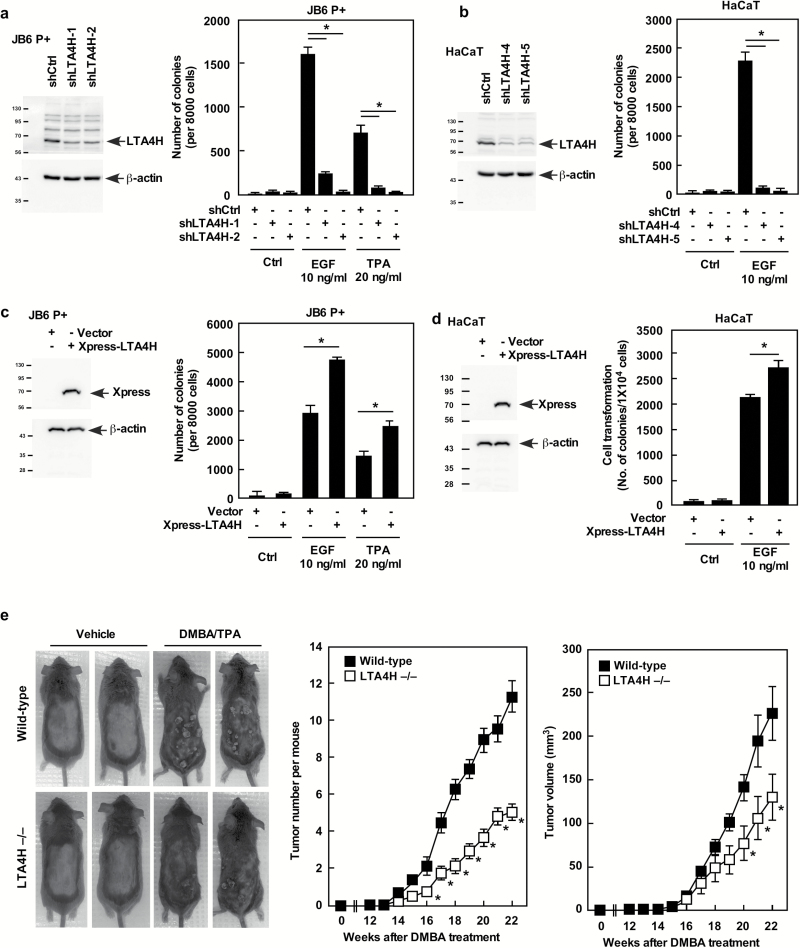
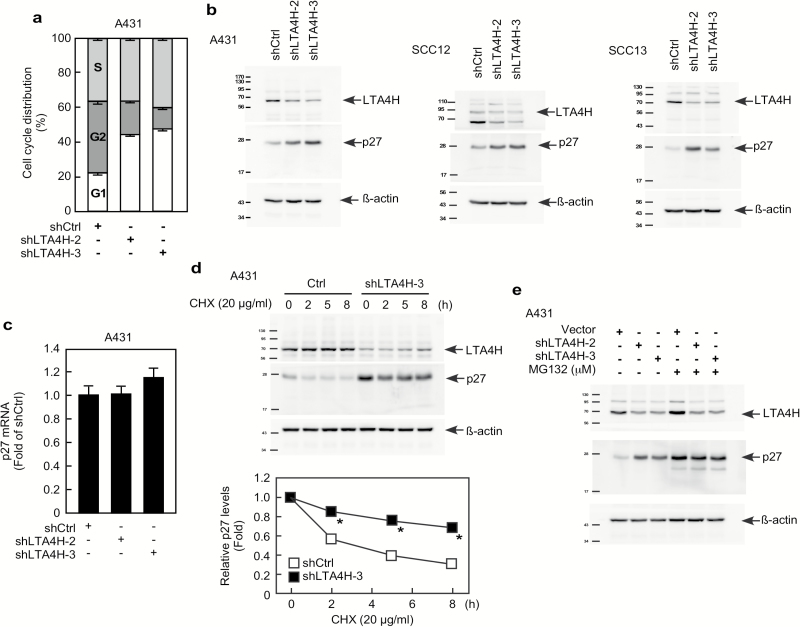
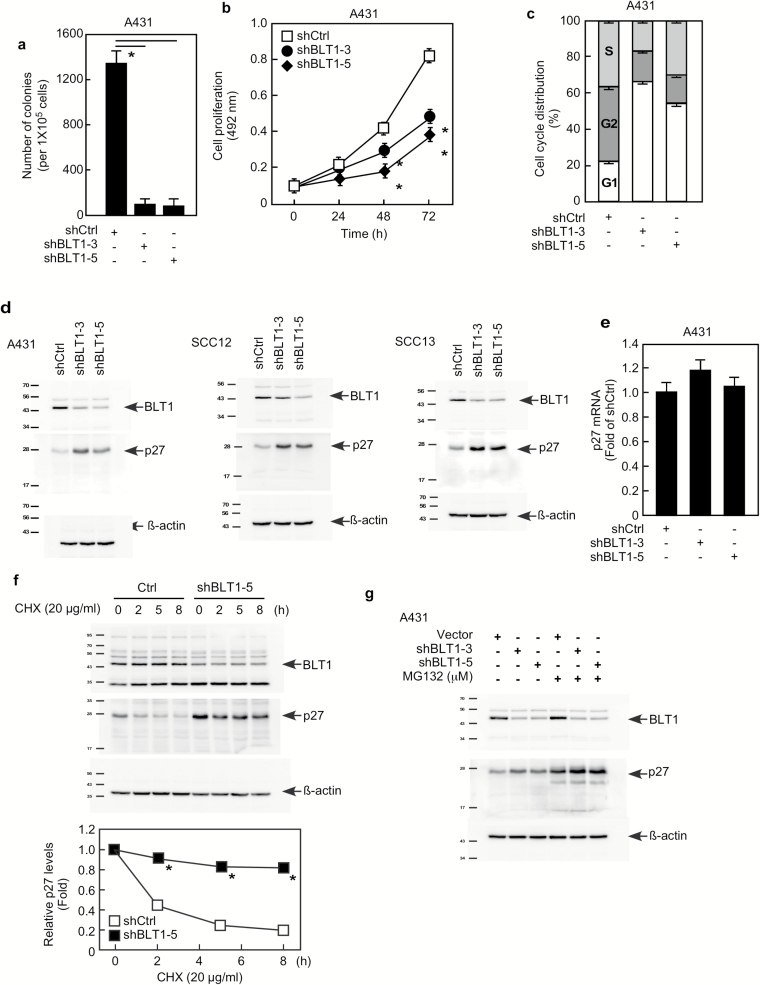
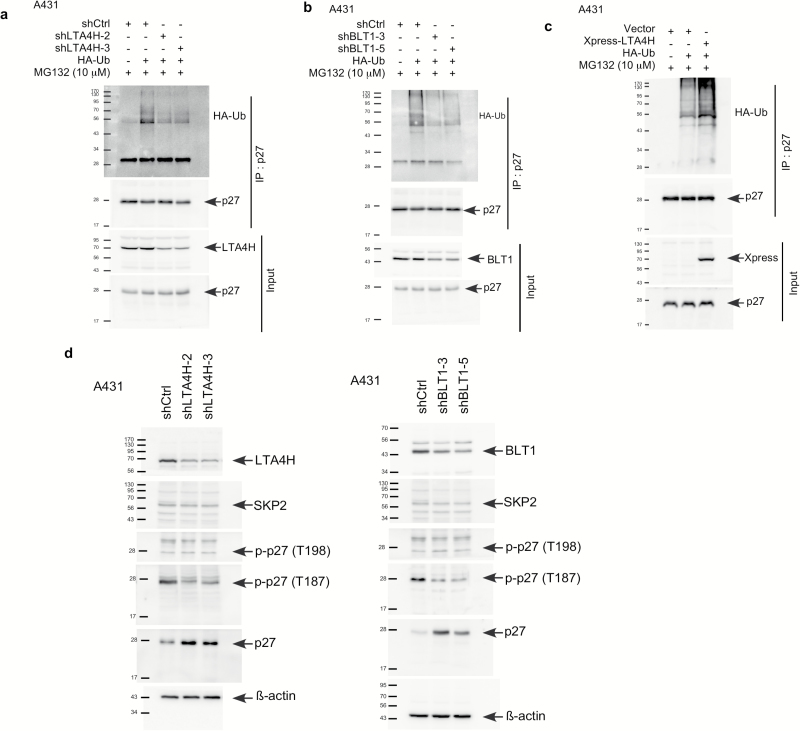
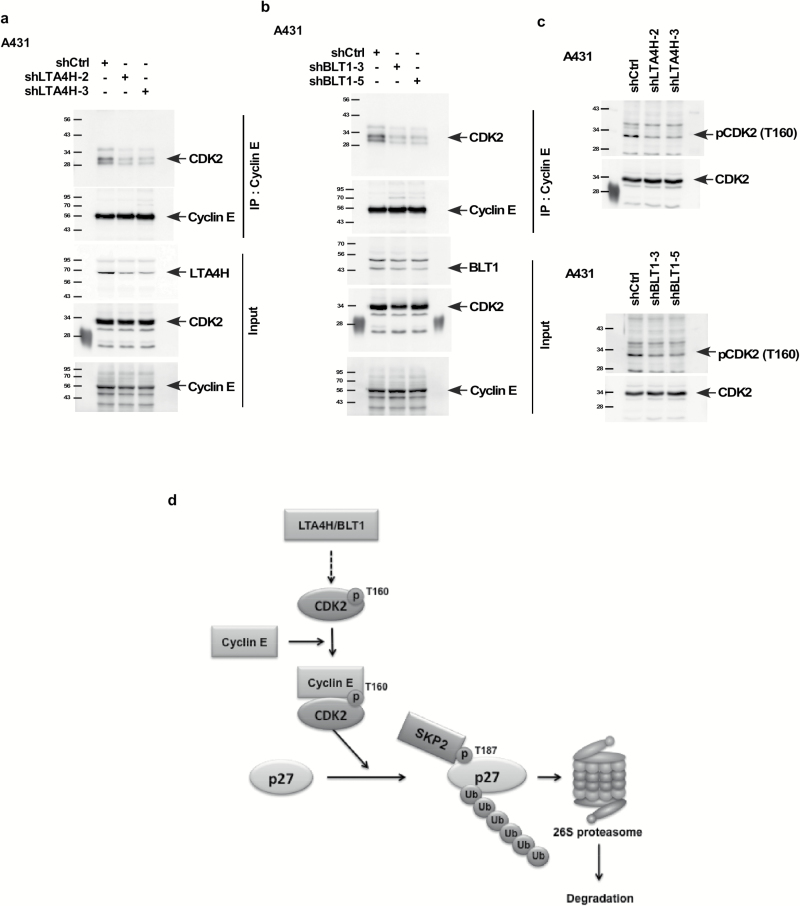
Leukotriene A4 hydrolase (LTA4H), a bifunctional zinc metallo-enzyme, is reportedly overexpressed in several human cancers. Our group has focused on LTA4H as a potential target for cancer prevention and/or therapy. In the present study, we report that LTA4H is a key regulator of cell cycle at the G0/G1 phase acting by negatively regulating p27 expression in skin cancer. We found that LTA4H is overexpressed in human skin cancer tissue. Knocking out LTA4H significantly reduced skin cancer development in the 7,12-dimethylbenz(a)anthracene (DMBA)-initiated/12-O-tetradecanoylphorbol-13-acetate (TPA)-promoted two-stage skin cancer mouse model. LTA4H depletion dramatically decreased anchorage-dependent and -independent skin cancer cell growth by inducing cell cycle arrest at the G0/G1 phase. Moreover, our findings showed that depletion of LTA4H enhanced p27 protein stability, which was associated with decreased phosphorylation of CDK2 at Thr160 and inhibition of the CDK2/cyclin E complex, resulting in down-regulated p27 ubiquitination. These findings indicate that LTA4H is critical for skin carcinogenesis and is an important mediator of cell cycle and the data begin to clarify the mechanisms of LTA4H's role in cancer development.


Figures

Figure 1.
Figure 1.
LTA4H is overexpressed in human cancer cells and tissues. Endogenous protein levels of LTA4H were analyzed by Western blotting in (A) human skin, (B) colon and (C) lung cancer cell lines. (D) LTA4H levels in human skin were analyzed by immunohistochemistry and the density score from each sample was determined (bottom panel, bar = 100 µm). Representative cases are shown (upper panels).
Figure 2.
Figure 2.
LTA4H mediates cell transformation. (A) JB6 P+ or (B) HaCaT cells expressing the indicated shRNAs were grown in soft agar and then colonies were counted. (C) JB6 P+ or (D) HaCaT cells were transfected with the indicated constructs and grown in soft agar and then colonies were counted. For AD, data are shown as mean values ± SD (*P < 0.05). (E) All animals (n = 25) were administered 200 nmol of DMBA and then treated with vehicle or 200 nmol of TPA twice a week for 21 weeks. Data are shown as mean values ± SEM and statistical significance was determined by one-way ANOVA (*P < 0.05).
Figure 3.
Figure 3.
LTA4H mediates p27 stability. (A) A431 cells were infected with the indicated shRNAs for 48 h and then cell distribution was analyzed by flow cytometry. (B) A431, SCC12, or SCC13 cancer cells were infected with the indicated shRNAs for 48 h and then whole cell lysates were analyzed by Western blotting to detect LTA4H or p27 protein expression. (C) A431 cells were infected with the indicated shRNAs for 48 h and then mRNA levels were analyzed by quantitative PCR (qPCR). Relative mRNA levels were normalized against gapdh. Data are shown as mean values ± S.D. (D) A431 cells expressing the indicated shRNAs were treated with 20 µg/ml cycloheximide (CHX) and harvested at the indicated time points. Whole cells lysates were analyzed by Western blot to detect LTA4H and p27. Relative protein levels were normalized against ß-actin and data are shown as mean values ± S.D. (*P < 0.05). (E) A431 cells expressing the indicated shRNAs were incubated with or without MG132 (10 µM) for 12 h. Whole cell lysates were analyzed by Western blotting as indicated.
Figure 4.
Figure 4.
The effect of BLT1 on p27 is similar to LTA4H. (A) A431 cells expressing the indicated shRNAs were grown in soft agar and then colonies counted. Data are shown as mean values ± S.D. (*P < 0.05). (B) A431 cells expressing the indicated shRNAs were plated and then formazan production was determined at the indicated time points by MTS assay. Data are shown as mean values ± SD (*P < 0.05). (C) A431 cells were infected with the indicated shRNAs for 48 h and then cell cycle distribution was analyzed by flow cytometry. (D) Cells were infected with the indicated shRNAs for 48 h and then whole cell lysates were analyzed by Western blotting. (E) A431 cells were infected with the indicated shRNAs for 48 h and then mRNA levels were analyzed by qPCR. Relative mRNA levels were normalized against gapdh. Data are shown as mean values ± SD. (F) A431 cells expressing the indicated shRNAs were treated with 20 µg/ml CHX and harvested at the indicated time points. Whole cells lysates were analyzed by Western blotting. Relative protein levels were normalized against ß-actin and data are shown as mean values ± SD (*P < 0.05). (G) A431 cells expressing the indicated shRNAs were incubated with or without MG132 (10 µM) for 12 h. Whole cell lysates were analyzed by Western blotting as indicated.
Figure 5.
Figure 5.
LTA4H and BLT1 mediate phosphorylation of p27 at Thr187 affecting p27 ubiquitination. (A and B) A431 cells expressing control or LTA4H or BLT1 shRNA were transfected with the indicated constructs for 48 h and then incubated with MG132 (10 µM) for an additional 12 h. Whole cell lysates were co-immunoprecipitated with a p27 antibody followed by Western blotting with anti-HA or anti-p27. (C) A431 cells were transfected with the indicated constructs for 48 h and then incubated with MG132 (10 µM) for an additional 12 h. Whole cell lysates were co-immunoprecipitated with a p27 antibody followed by Western blotting with anti-HA or anti-p27. (D) A431 cells were infected with the indicated shRNAs for 48 h and then whole cell lysates were analyzed by Western blotting as indicated.
Figure 6.
Figure 6.
LTA4H and BLT1 influence the formation of the CDK2/cyclin E complex and the phosphorylation of CDK2 at Thr160. (A and B) A431 cells were infected with the indicated shRNAs for 48 h. Whole cell lysates were co-immunoprecipitated with anti-cyclin E followed by Western blotting with anti-CDK2 or anti-cyclin E. (C) A431 cells were infected with the indicated shRNAs for 48 h and then whole cell lysates were analyzed by Western blotting. (D) A working model of the mediation of p27 by LTA4H and/or BLT1.

Similar articles

Cited by

References

    1. Thunnissen M.M., et al. (2002) Crystal structures of leukotriene A4 hydrolase in complex with captopril and two competitive tight-binding inhibitors. FASEB J., 16, 1648–1650. - PubMed
    1. Andersson B., et al. (2003) Crystallization and X-ray diffraction data analysis of leukotriene A4 hydrolase from Saccharomyces cerevisiae. Acta Crystallogr. D. Biol. Crystallogr., 59, 1093–1095. - PubMed
    1. Shim Y.M., et al. (2010) Role of LTB₄ in the pathogenesis of elastase-induced murine pulmonary emphysema. Am. J. Physiol. Lung Cell. Mol. Physiol., 299, L749–L759. - PMC - PubMed
    1. Stockley R.A., et al. (2002) The effect of augmentation therapy on bronchial inflammation in alpha1-antitrypsin deficiency. Am. J. Respir. Crit. Care Med., 165, 1494–1498. - PubMed
    1. Hubbard R.C., et al. (1991) Neutrophil accumulation in the lung in alpha 1-antitrypsin deficiency. Spontaneous release of leukotriene B4 by alveolar macrophages. J. Clin. Invest., 88, 891–897. - PMC - PubMed