

karyoploteR: an R/Bioconductor package to plot customizable genomes displaying arbitrary data
- PMID: 28575171
- PMCID: PMC5870550
- DOI: 10.1093/bioinformatics/btx346
karyoploteR: an R/Bioconductor package to plot customizable genomes displaying arbitrary data
Abstract
Motivation: Data visualization is a crucial tool for data exploration, analysis and interpretation. For the visualization of genomic data there lacks a tool to create customizable non-circular plots of whole genomes from any species.
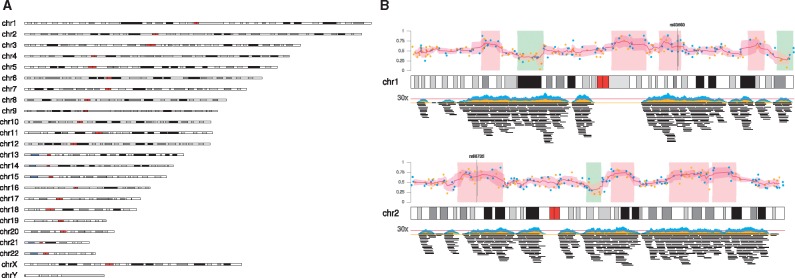
Results: We have developed karyoploteR, an R/Bioconductor package to create linear chromosomal representations of any genome with genomic annotations and experimental data plotted along them. Plot creation process is inspired in R base graphics, with a main function creating karyoplots with no data and multiple additional functions, including custom functions written by the end-user, adding data and other graphical elements. This approach allows the creation of highly customizable plots from arbitrary data with complete freedom on data positioning and representation.
Availability and implementation: karyoploteR is released under Artistic-2.0 License. Source code and documentation are freely available through Bioconductor (http://www.bioconductor.org/packages/karyoploteR) and at the examples and tutorial page at https://bernatgel.github.io/karyoploter_tutorial.
Contact: bgel@igtp.cat.
© The Author(s) 2017. Published by Oxford University Press.
Figures
References
-
- Hahne F., Ivanek R. (2016) Visualizing genomic data using Gviz and bioconductor. Methods Mol. Biol., 1418, 335–351. - PubMed
-
- Oróstica K.Y., Verdugo R.A. (2016) ChromPlot: Visualization of genomic data in chromosomal context. Bioinformatics, 32, 2366–2368. - PubMed
-
- Pai S., Ren J. (2014) IdeoViz: Plots data (continuous/discrete) along chromosomal ideogram. R package version 1.8.0.
MeSH terms
LinkOut - more resources
Full Text Sources
Other Literature Sources
Miscellaneous
