. 2017 Jun 1;100(6):940-953.
doi: 10.1016/j.ajhg.2017.05.004.

Genetic-Variation-Driven Gene-Expression Changes Highlight Genes with Important Functions for Kidney Disease

Affiliations

Genetic-Variation-Driven Gene-Expression Changes Highlight Genes with Important Functions for Kidney Disease

Yi-An Ko et al. Am J Hum Genet. .

Abstract

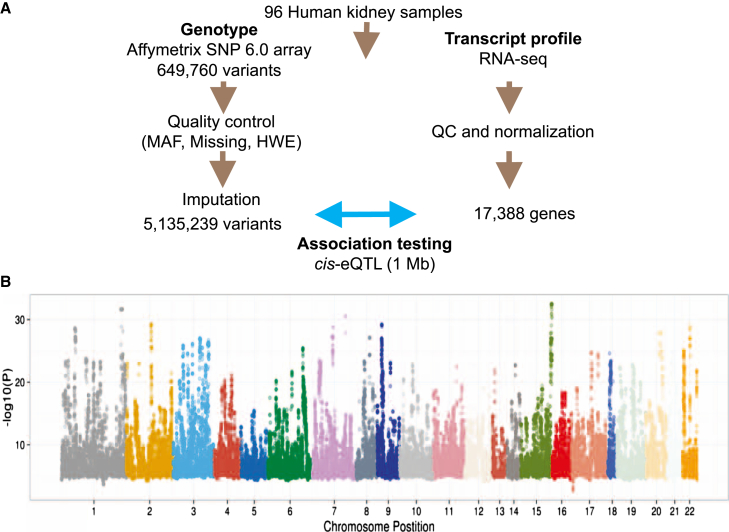
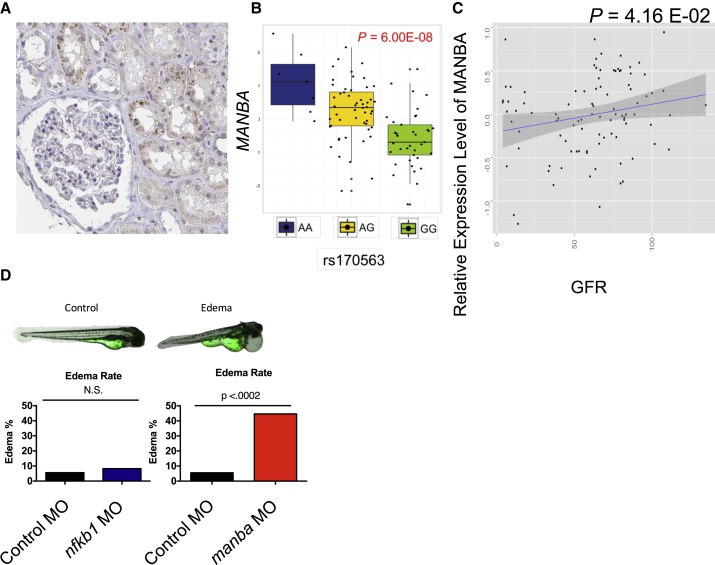
Chronic kidney disease (CKD) is a complex gene-environmental disease affecting close to 10% of the US population. Genome-wide association studies (GWASs) have identified sequence variants, localized to non-coding genomic regions, associated with kidney function. Despite these robust observations, the mechanism by which variants lead to CKD remains a critical unanswered question. Expression quantitative trait loci (eQTL) analysis is a method to identify genetic variation associated with gene expression changes in specific tissue types. We hypothesized that an integrative analysis combining CKD GWAS and kidney eQTL results can identify candidate genes for CKD. We performed eQTL analysis by correlating genotype with RNA-seq-based gene expression levels in 96 human kidney samples. Applying stringent statistical criteria, we detected 1,886 genes whose expression differs with the sequence variants. Using direct overlap and Bayesian methods, we identified new potential target genes for CKD. With respect to one of the target genes, lysosomal beta A mannosidase (MANBA), we observed that genetic variants associated with MANBA expression in the kidney showed statistically significant colocalization with variants identified in CKD GWASs, indicating that MANBA is a potential target gene for CKD. The expression of MANBA was significantly lower in kidneys of subjects with risk alleles. Suppressing manba expression in zebrafish resulted in renal tubule defects and pericardial edema, phenotypes typically induced by kidney dysfunction. Our analysis shows that gene-expression changes driven by genetic variation in the kidney can highlight potential new target genes for CKD development.

Keywords: CKD; GWAS; eQTL; gene network; gene regulation; kidney.


Figures

Figure 1
Figure 1
cis-eQTL Analysis of Human Kidney (A) Flowchart of 96 samples used for eQTL analysis. (B) Significance of eQTL SNP-gene pairs across the genome. The x axis shows the chromosome number and the y axis shows –log10 p value; the significance threshold used in our analysis is determined by the corrected permutation test p value.
Figure 2
Figure 2
Significant SNPs in the eQTL Are Enriched at Regulatory Regions (A) Density plot of eSNPs and their distance relative to transcription start site. (B) The odds ratio of eSNPs overlap with six different histone marks in human kidney proximal tubule epithelial cells. The odds ratio was calculated from comparing with the 1,000 null sets of variants matched for number, distance to TSS, and frequency (see Material and Methods). The vertical line represents the 95% confidence interval. Histone marks with significance level of p value < 1.0 × 10−2 are highlighted with red asterisks. (C) The odds ratio of eSNP enrichment in ENCODE TFBSs. We marked the TFBSs reaching significance level p < 1.0 × 10−2 with red asterisks. (D) One example region at chr1: 218.45–218.514 Mb. SNP rs946213 affects expression levels of RRP15. The gene and the SNP are located in area in the human kidney that is enriched by histone marks including H3K4me1, H3K4me3, and H3K27ac. SNP r61823376 also disrupts predicted transcription factor binding site GATA5. The right panel shows the boxplot of RRP15 expression level is significantly higher in samples with rs946213 minor alleles (p = 7.81 × 10−15). (E) SNPs associated with different traits were taken from NHGRI database, with SNPs categorized based on disease ontology. Enrichment was calculated using Fisher’s exact test; the significance is shown in the y axis with –log10 p value.
Figure 3
Figure 3
Integrative Analysis of GWASs and eQTL SNPs (A) Flowchart of the direct overlap method that was used to identify genes whose expression change is associated with GWAS variants. We used eSNPs that are also present in CKD-associated GWASs as a means to identify potential target genes that affect kidney disease. (B) Boxplot of rs1719246 and SPATA5L1; rs6429746 is within the LD block with rs2467853, which is one of the CKD-associated GWAS-identified SNPs (D′ = 0.95; r2 = 0.89). (C) The lower left part of the square is the analysis of LD between the entire chromosome 4: 103.4–103.8 Mb region using Haploview (v.4.2). The strength of the LD is shown in the gray gradient as indicated in the figure. Pairwise D′ values were calculated and plotted using Haploview. Dashed lines indicate the annotated genes in the locus. The upper-right corner of the square shows chromosome conformation capture (Hi-C) interactions contact probabilities in a human lymphoblastoid cell line (GM12878). The plot shows the 200 kb topologically associating domain at 1 kb resolution. Locations of both CKD and eQTL SNPs are labeled. (D) The zoom-in locus of MANBA region at chr4: 103.5–103.64 Mb. CKD GWAS SNP, MANBA-associated best eSNP, and the overlapped SNP between two datasets are labeled on the plot. The p value is presented for the SNP and MANBA expression. (E) The genome browser display of the MANBA region. Tracks from top to bottom are: UCSC gene annotation; H3K4me1 and H3K27ac overlays of nine cell lines from ENCODE; human kidney histone mark H3K4me1, H3K4me3, and H3K27ac from Epigenome RoadMap; and ENCODE chromatin states (ChromHMM) showing the regulatory properties of the sequence. (F) Sequence-predicted TF motifs are shown in the bottom for rs227361 (overlapped SNP) and rs170563 (eSNP of MANBA). SNP rs227361 disrupts transcription factor IRF2 motif and rs170563 disrupts FOXP2 motif.
Figure 3
Figure 3
Integrative Analysis of GWASs and eQTL SNPs (A) Flowchart of the direct overlap method that was used to identify genes whose expression change is associated with GWAS variants. We used eSNPs that are also present in CKD-associated GWASs as a means to identify potential target genes that affect kidney disease. (B) Boxplot of rs1719246 and SPATA5L1; rs6429746 is within the LD block with rs2467853, which is one of the CKD-associated GWAS-identified SNPs (D′ = 0.95; r2 = 0.89). (C) The lower left part of the square is the analysis of LD between the entire chromosome 4: 103.4–103.8 Mb region using Haploview (v.4.2). The strength of the LD is shown in the gray gradient as indicated in the figure. Pairwise D′ values were calculated and plotted using Haploview. Dashed lines indicate the annotated genes in the locus. The upper-right corner of the square shows chromosome conformation capture (Hi-C) interactions contact probabilities in a human lymphoblastoid cell line (GM12878). The plot shows the 200 kb topologically associating domain at 1 kb resolution. Locations of both CKD and eQTL SNPs are labeled. (D) The zoom-in locus of MANBA region at chr4: 103.5–103.64 Mb. CKD GWAS SNP, MANBA-associated best eSNP, and the overlapped SNP between two datasets are labeled on the plot. The p value is presented for the SNP and MANBA expression. (E) The genome browser display of the MANBA region. Tracks from top to bottom are: UCSC gene annotation; H3K4me1 and H3K27ac overlays of nine cell lines from ENCODE; human kidney histone mark H3K4me1, H3K4me3, and H3K27ac from Epigenome RoadMap; and ENCODE chromatin states (ChromHMM) showing the regulatory properties of the sequence. (F) Sequence-predicted TF motifs are shown in the bottom for rs227361 (overlapped SNP) and rs170563 (eSNP of MANBA). SNP rs227361 disrupts transcription factor IRF2 motif and rs170563 disrupts FOXP2 motif.
Figure 4
Figure 4
Gene Expression Analyses of MANBA (A) Immunohistochemistry staining with MANBA in human kidney tissues (Protein Atlas). (B) Boxplot showing association between rs170563 genotype and MANBA expression in human kidney. (C) Gene expression correlation with eGFR (the leading indicator of kidney function) in a different independent cohort of 95 human kidneys. (D) Kidney defect phenotype observed in zebrafish after manba knockdown. Pericardial edema after gene knockdown is shown on the right panel; the control-injected zebrafish has no edema at 200 μM concentration. (E) Edema rate of zebrafish after nfkb1 and manba knockdown; p values were calculated for each concentration group using Fisher’s exact test. We tested the suggested target gene from a GWAS to confirm the eQTL analysis result. Number of zebrafish observed in the analysis are as follows: n = 90 in 200 μM control morpholino group, n = 109 in 200 μM nfkb1 morpholino group, and n = 59 in 200 μM manba morpholino group.

References

    1. Levey A.S., Coresh J. Chronic kidney disease. Lancet. 2012;379:165–180. - PubMed
    1. Eckardt K.U., Coresh J., Devuyst O., Johnson R.J., Köttgen A., Levey A.S., Levin A. Evolving importance of kidney disease: from subspecialty to global health burden. Lancet. 2013;382:158–169. - PubMed
    1. Astor B.C., Matsushita K., Gansevoort R.T., van der Velde M., Woodward M., Levey A.S., Jong P.E., Coresh J., Astor B.C., Matsushita K., Chronic Kidney Disease Prognosis Consortium Lower estimated glomerular filtration rate and higher albuminuria are associated with mortality and end-stage renal disease. A collaborative meta-analysis of kidney disease population cohorts. Kidney Int. 2011;79:1331–1340. - PMC - PubMed
    1. Rhee C.M., Kovesdy C.P. Epidemiology: Spotlight on CKD deaths—increasing mortality worldwide. Nat. Rev. Nephrol. 2015;11:199–200. - PMC - PubMed
    1. Sud M., Tangri N., Pintilie M., Levey A.S., Naimark D.M. Progression to Stage 4 chronic kidney disease and death, acute kidney injury and hospitalization risk: a retrospective cohort study. Nephrol. Dial. Transplant. 2016;31:1122–1130. - PubMed

MeSH terms

Substances