. 2017 Jun 1;169(6):1042-1050.e9.
doi: 10.1016/j.cell.2017.05.019.

Cryo-EM Structure of a KCNQ1/CaM Complex Reveals Insights into Congenital Long QT Syndrome

Affiliations

Cryo-EM Structure of a KCNQ1/CaM Complex Reveals Insights into Congenital Long QT Syndrome

Ji Sun et al. Cell. .

Abstract

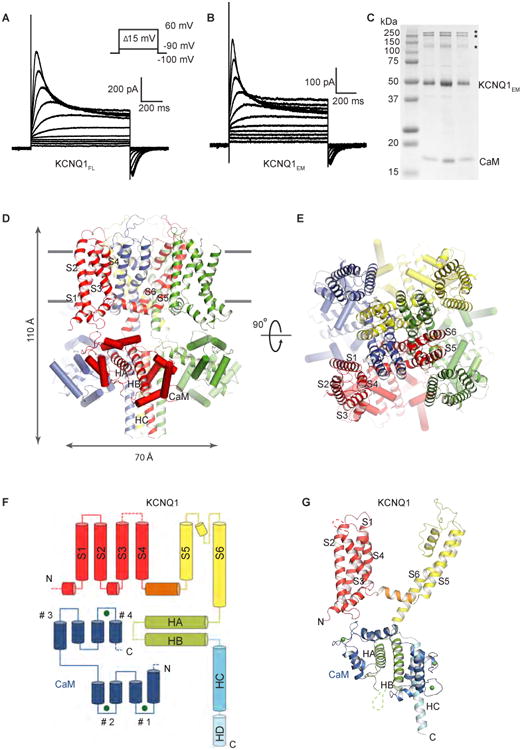
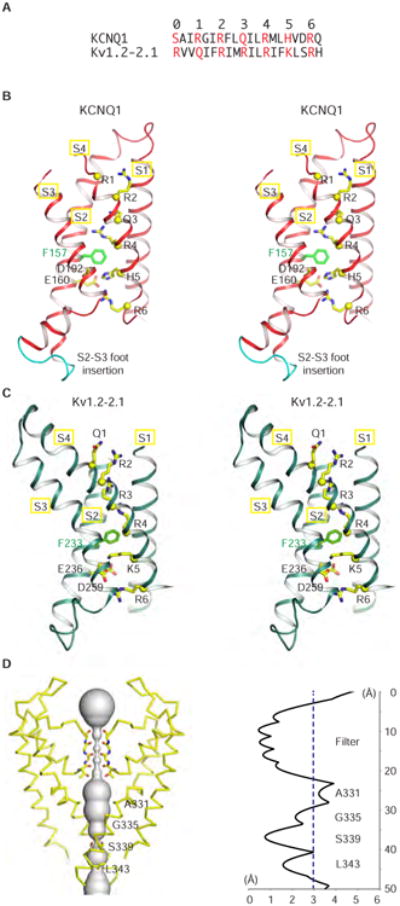
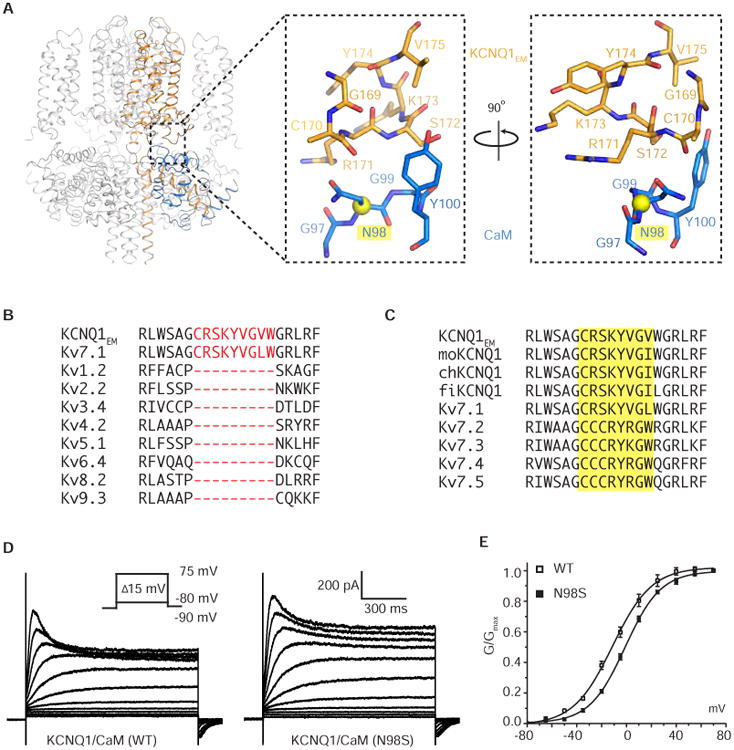
KCNQ1 is the pore-forming subunit of cardiac slow-delayed rectifier potassium (IKs) channels. Mutations in the kcnq1 gene are the leading cause of congenital long QT syndrome (LQTS). Here, we present the cryoelectron microscopy (cryo-EM) structure of a KCNQ1/calmodulin (CaM) complex. The conformation corresponds to an "uncoupled," PIP2-free state of KCNQ1, with activated voltage sensors and a closed pore. Unique structural features within the S4-S5 linker permit uncoupling of the voltage sensor from the pore in the absence of PIP2. CaM contacts the KCNQ1 voltage sensor through a specific interface involving a residue on CaM that is mutated in a form of inherited LQTS. Using an electrophysiological assay, we find that this mutation on CaM shifts the KCNQ1 voltage-activation curve. This study describes one physiological form of KCNQ1, depolarized voltage sensors with a closed pore in the absence of PIP2, and reveals a regulatory interaction between CaM and KCNQ1 that may explain CaM-mediated LQTS.

Keywords: CaM; KCNQ1; PIP2; cryo-EM; ion channel structure; long QT syndrome.


Figures

Figure 1
Figure 1. Functional validation, overall architecture and domain organization of KCNQ1EM
(A-B) Representative voltage family current traces of the full-length frog KCNQ1 (KCNQ1FL) and the cryo-EM construct (KCNQ1EM). Voltage steps are applied from -90 mV to 60 mV at 15 mV increments. (C) SDS-PAGE gel of purified KCNQ1EM/CaM complex from peak fractions of size exclusion chromatography with protein markers on the left. The bands indicated by asterisks are potential KCNQ1EM dimers, trimers and tetramers. (D-E) Side view and top view of the KCNQ1EM/CaM complex. Each protomer is shown in a different color, and CaM is represented as cylinders. The S1-S6 and HA-HC are labeled. (F) Domain organization of one subunit. The HD, which is masked out in 3D reconstruction, is indicated by cylinder with dashed outlines. The EF hands of CaM are labeled as #1-#4 from the N-terminal to C-terminal end. The first two EF-hand regions form the N-lobe, and the other two form the C-lobe. Green spheres represent calcium ions. (G) Model of one subunit with domains colored as in (F).
Figure 2
Figure 2. The activated voltage senor and closed pore
(A) Sequence alignment of S4 for KCNQ1EM and Kv1.2-2.1. (B-C) Stereoview of the voltage sensors of KCNQ1EM and Kv1.2-2.1 (PDB: 2R9R). Only the helical regions of S1-S4 are shown for clarity. The c-alphas of the positive charged (or polar) resides on S4 are shown in yellow spheres with stick side chains, and the gating charge transfer center residues F157/F233 (green), E160/E236 (yellow) and D192/D259 (yellow) are shown as sticks. The nine amino acid insertion in KCNQ1 S2-S3 ‘foot’ is colored in cyan in (B). (D) Left, view of the KCNQ1EM pore with front and back subunits excluded for clarity. Right, radius of the pore calculated using HOLE program. The amino acids facing the pore are labeled.
Figure 3
Figure 3
Conformational differences between open Kv1.2-2.1 and decoupled KCNQ1EM. Only the helical regions of S1-S6 are shown for clarity. The center of the hinge region, shown as yellow spheres, is displaced ∼10.5 Å in KCNQ1EM compared to its position in Kv1.2-2.1. The S4-S5 linker tilts by ∼25 degrees (indicated by black dashed lines) away from S6 in KCNQ1EM compared to its position in Kv1.2-2.1.
Figure 4
Figure 4. The hinge connecting S4 and the S4-S5 linker
(A) Surface charge representation of KCNQ1EM. Two positive charged pockets, which are next to the hinge region (loop connecting S4 to the S4-S5 linker) and HB helix, are indicated by yellow arrows. (B) Zoomed-in view of the hinge region and map of the key residues that are important for PIP2 regulation of the KCNQ1EM channel. The hinge region is colored in red, and c-alphas of key residues are shown as yellow spheres with side chains in stick representation. (C) Sequence alignment of the hinge region connecting S4 and the S4-S5 linker. (D) Cartoon depicting the idea that PIP2 couples the voltage senor domain and the pore domain, in contrast with Kv1.2-2.1. The grey box and orange cylinder represents the voltage sensor domain containing positive charged “+” amino acids on the S4 helix. The pore domain is colored yellow and the S4-S5 linker green. PIP2 is shown as a purple hexagon. The red loop represents the hinge region connecting S4 to the S4-S5 linker. The black arrow signifies the process of membrane depolarization.
Figure 5
Figure 5. Interaction between the KCNQ1EM S2-S3 loop and CaM
(A) Magnified view of the newly discovered interface between KCNQ1EM and CaM. The long QT disease mutant site, Asn98, is highlighted and its C-alpha is shown as a sphere. The side chain of C170 was truncated during modeling due to the absence of density. (B-C) Sequence alignment of the S2-S3 loop region among Kv1-9 family and KCNQ1 orthologs and paralogs. Protein accession codes are as follows, Kv1.2: NP_004965.1, Kv2.2: NP_004761.2, Kv3.4: NP_004969.2, Kv4.2: NP_036413.1, Kv5.1: NP_002227.2, Kv6.4: NP_758857.1, Kv8.2: NP_598004.1, Kv9.3: NP_002243.3, Kv7.1: NP_000209.2, Kv7.2: NP_742105.1, Kv7.3: NP_004510.1, Kv7.4: NP_004691.2 and Kv7.5: NP_062816.2. All the above sequences are from Homo sapiens. moKCNQ1: NP_032460.2 (Mus musculus), chKCNQ1: XP_421022.3 (Gallus gallus) and fiKCNQ1: NP_001116714.1 (Danio rerio). (D) Current traces recorded at different voltages for KCNQ1EM/CaM_WT and KCNQ1EM/CaM_N98S. (E) Tail current (G/Gmax) versus voltage (G-V) curve was plotted from (D) and fitted with the Boltzmann function with V1/2 for KCNQ1EM/CaM_WT and KCNQ1EM/CaM_N98S equal to -11.3 ± 0.7 mV (SEM, n=4) and -1.1 ± 0.5 mV (SEM, n=7), respectively.

References

    1. Abbott GW. Biology of the KCNQ1 Potassium Channel. New Journal of Science. 2014;2014:1–26.
    1. Adams PD, Afonine PV, Bunkóczi G, Chen VB, Davis IW, Echols N, Headd JJ, Hung LW, Kapral GJ, Grosse-Kunstleve RW, et al. PHENIX: a comprehensive Python-based system for macromolecular structure solution. Acta Crystallogr D Biol Crystallogr. 2010;66:213–221. - PMC - PubMed
    1. Barhanin J, Lesage F, Guillemare E, Fink M, Lazdunski M, Romey G. KvLQT1 and IsK (minK) proteins associate to form the IKs cardiac potassium current. Nature. 1996;384:78–80. - PubMed
    1. Boczek NJ, Gomez-Hurtado N, Ye D, Calvert ML, Tester DJ, Kryshtal DO, Hwang HS, Johnson CN, Chazin WJ, Loporcaro CG, et al. Spectrum and Prevalence of CALM1-, CALM2-, and CALM3-Encoded Calmodulin Variants in Long QT Syndrome and Functional Characterization of a Novel Long QT Syndrome-Associated Calmodulin Missense Variant, E141G. Circ Cardiovasc Genet. 2016;9:136–146. - PMC - PubMed
    1. Brown A, Long F, Nicholls RA, Toots J, Emsley P, Murshudov G. Tools for macromolecular model building and refinement into electron cryo-microscopy reconstructions. Acta Crystallogr D Biol Crystallogr. 2015;71:136–153. - PMC - PubMed

LinkOut - more resources