. 2017 Jun 1;169(6):1078-1089.e13.
doi: 10.1016/j.cell.2017.05.030.

Structural Basis for Mitotic Centrosome Assembly in Flies

Affiliations

Structural Basis for Mitotic Centrosome Assembly in Flies

Zhe Feng et al. Cell. .

Abstract

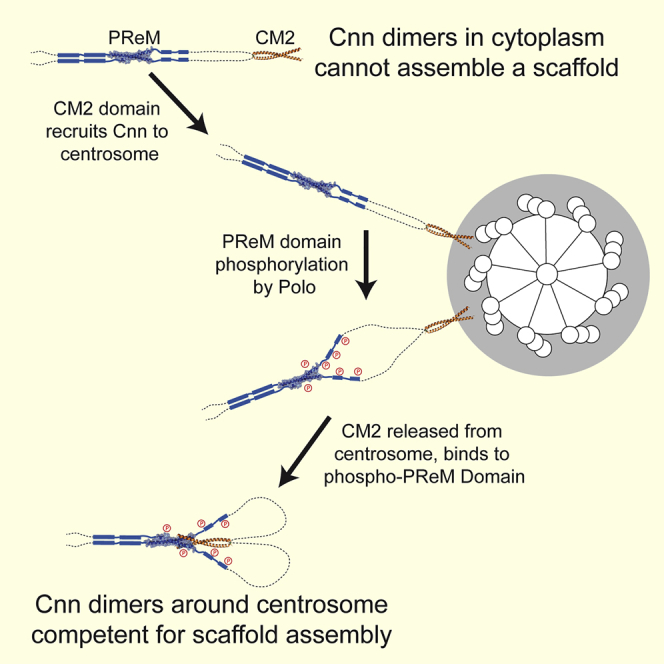
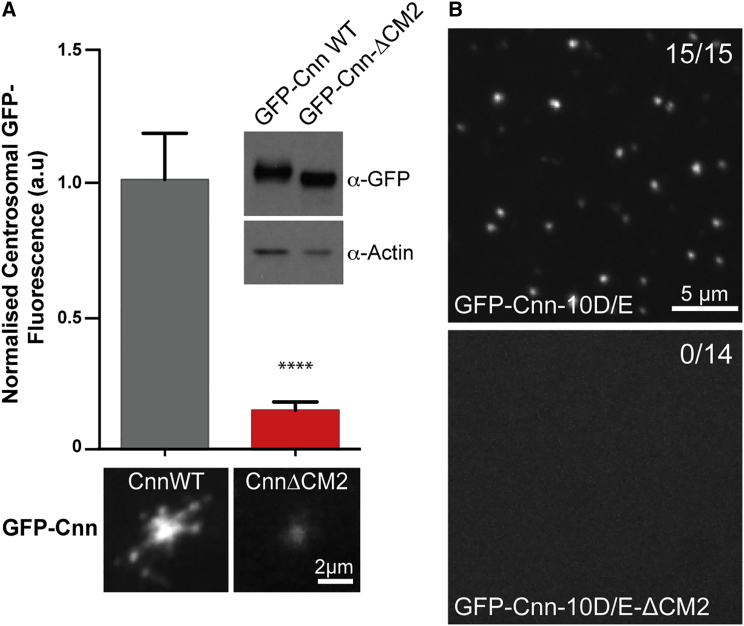
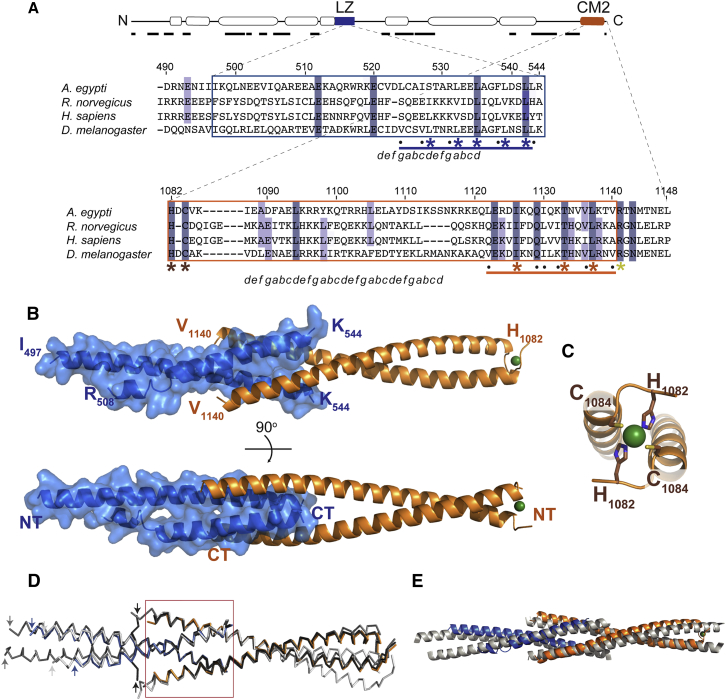
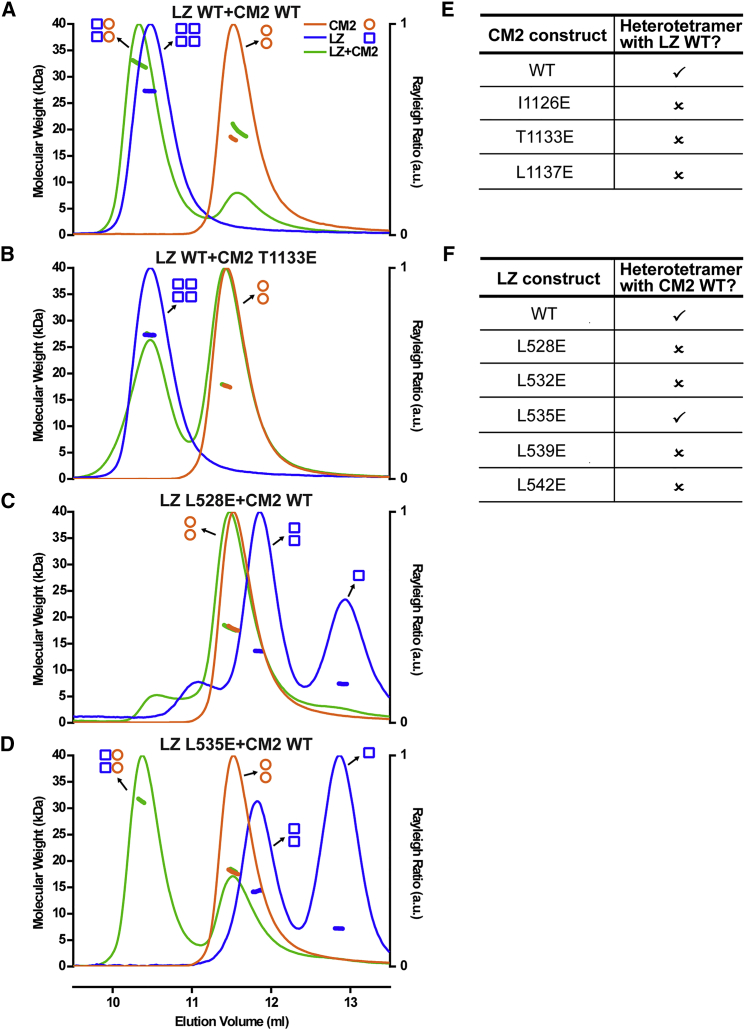
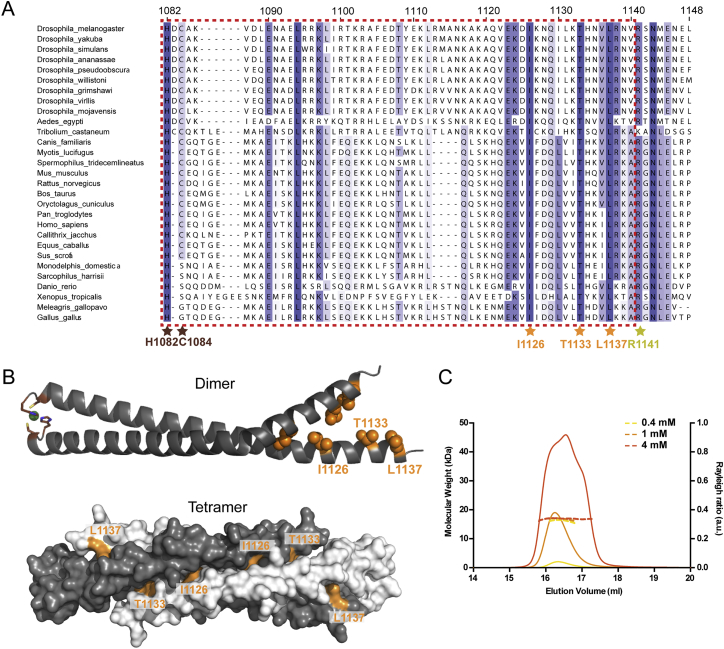
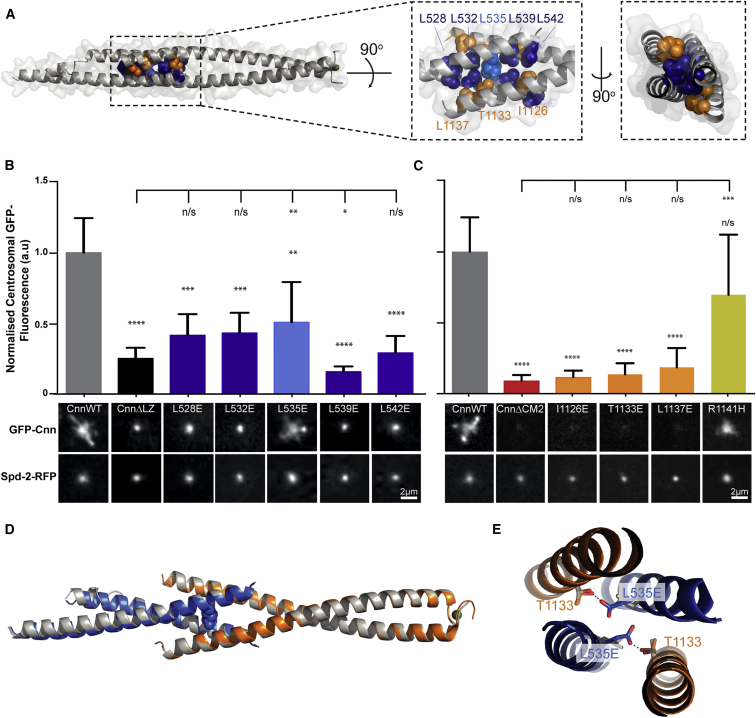
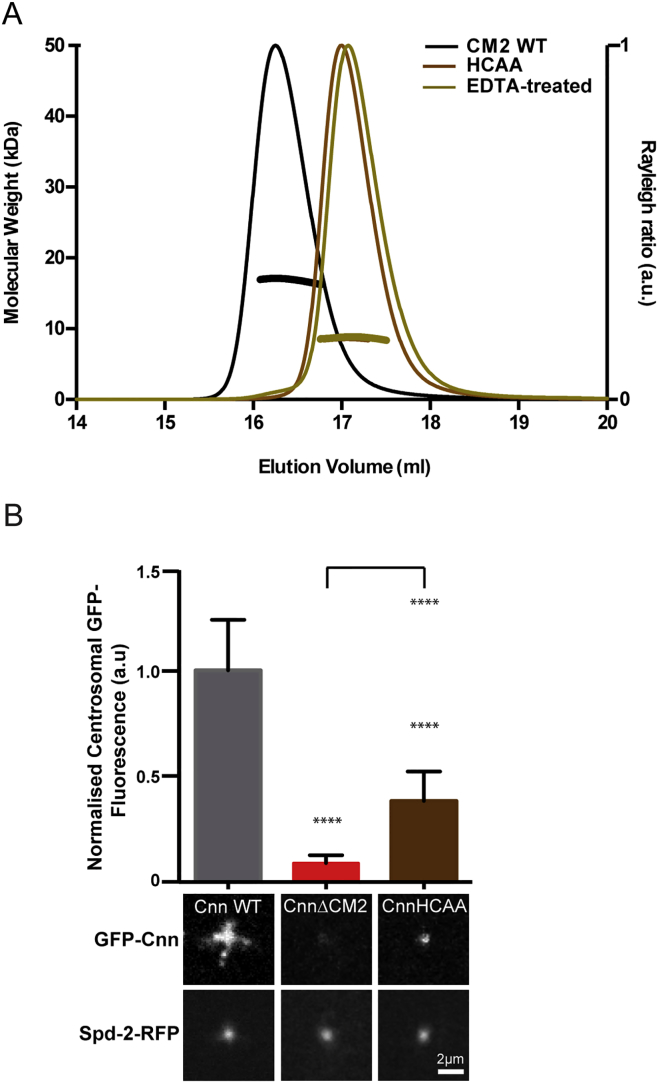
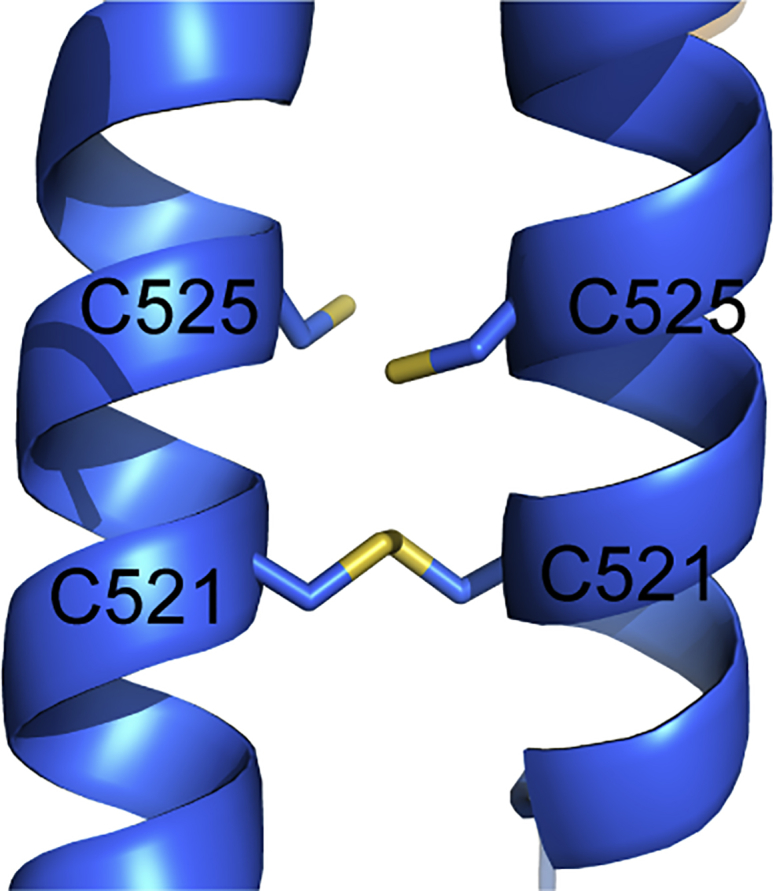
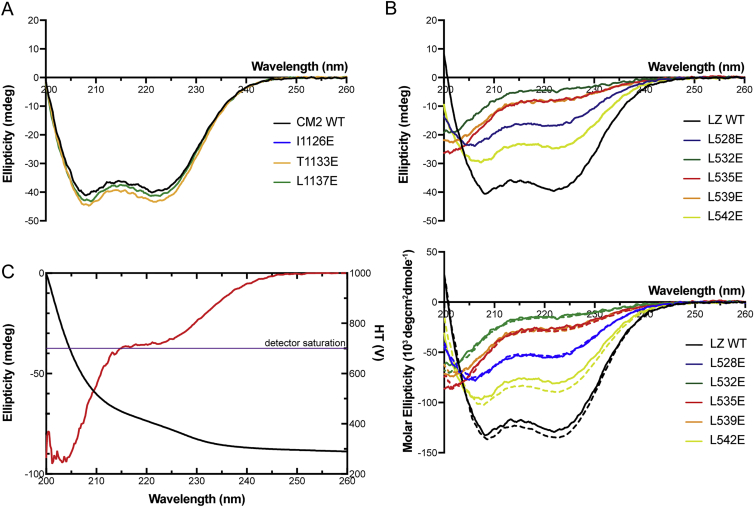
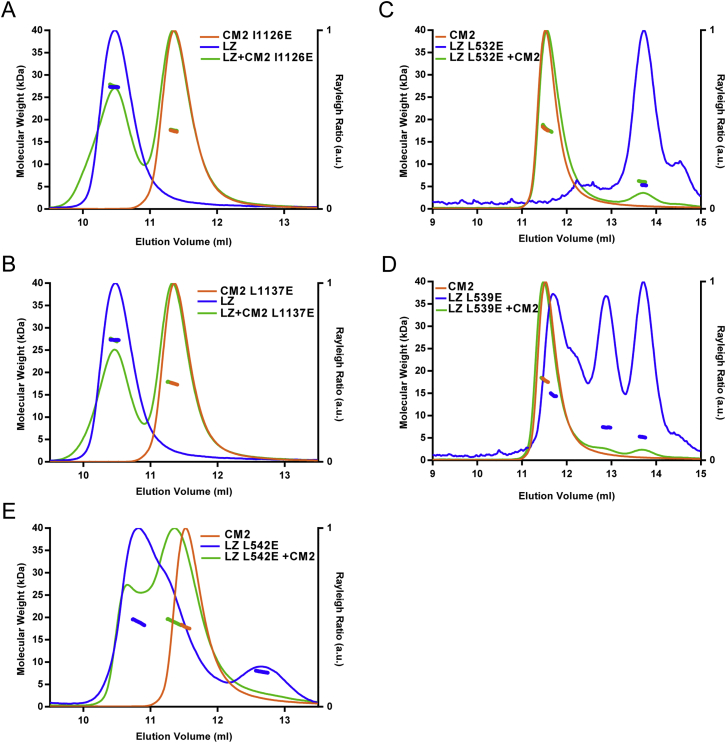
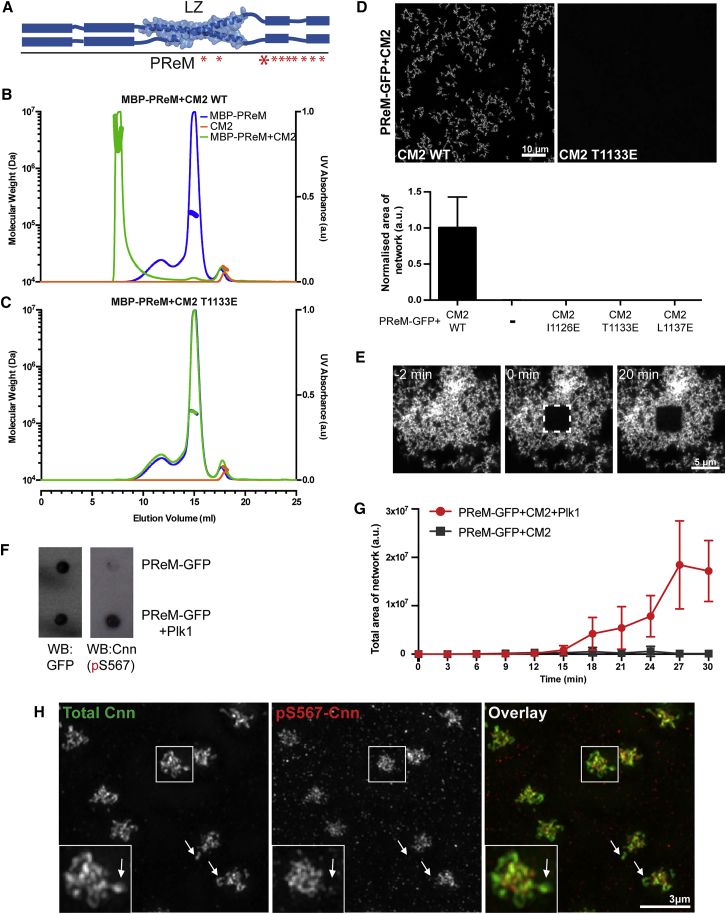
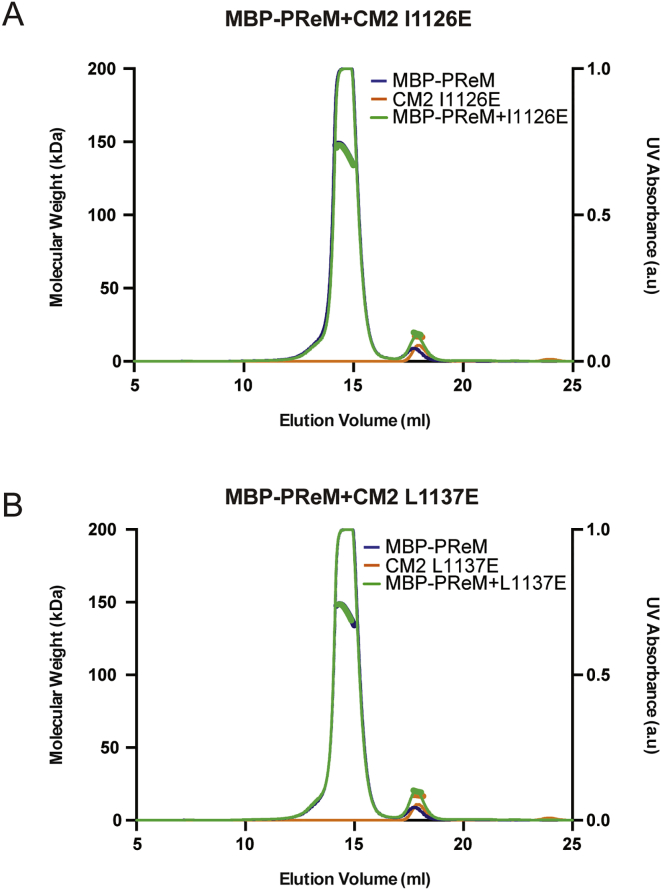
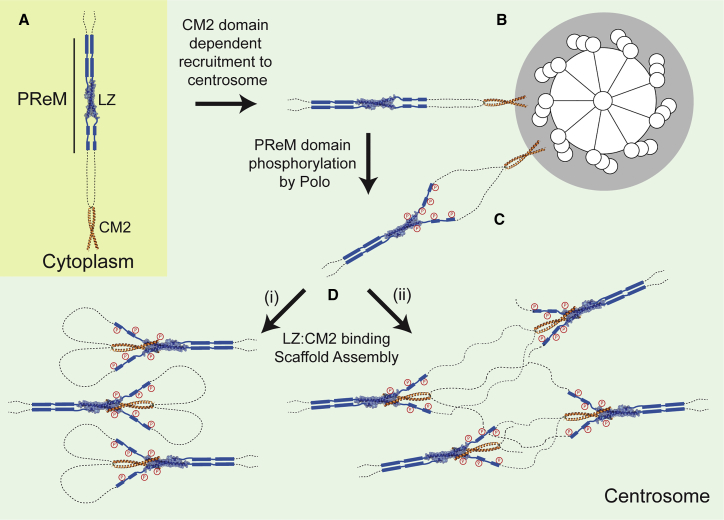
In flies, Centrosomin (Cnn) forms a phosphorylation-dependent scaffold that recruits proteins to the mitotic centrosome, but how Cnn assembles into a scaffold is unclear. We show that scaffold assembly requires conserved leucine zipper (LZ) and Cnn-motif 2 (CM2) domains that co-assemble into a 2:2 complex in vitro. We solve the crystal structure of the LZ:CM2 complex, revealing that both proteins form helical dimers that assemble into an unusual tetramer. A slightly longer version of the LZ can form micron-scale structures with CM2, whose assembly is stimulated by Plk1 phosphorylation in vitro. Mutating individual residues that perturb LZ:CM2 tetramer assembly perturbs the formation of these micron-scale assemblies in vitro and Cnn-scaffold assembly in vivo. Thus, Cnn molecules have an intrinsic ability to form large, LZ:CM2-interaction-dependent assemblies that are critical for mitotic centrosome assembly. These studies provide the first atomic insight into a molecular interaction required for mitotic centrosome assembly.

Keywords: Centrosomin; Cnn; PCM; Plk1; centriole; centrosome; mitosis.


Figures

None
Graphical abstract
Figure 1
Figure 1
The Cnn-CM2 Domain Is Required for Centrosomal Targeting and for Scaffold Assembly (A) Micrographs illustrate and graphs quantify the mean centrosomal GFP-fluorescence levels in embryos of cnn mutant flies expressing GFP-Cnn or GFP-Cnn-ΔCM2. Inset shows a western blot probing the relative levels of GFP-Cnn or GFP-Cnn-ΔCM2 expressed in these embryos; actin is shown as a loading control. (B) Micrographs illustrate the spontaneous assembly of cytoplasmic Cnn scaffolds in unfertilized eggs expressing GFP-Cnn-10D/E (15/15 injected eggs); no scaffolds were detectable in eggs expressing GFP-Cnn-10D/E-ΔCM2 (0/14 injected eggs). Error bars (A) represent the SD. Statistical significance was assessed using an unpaired t test in GraphPad Prism (∗∗∗∗p < 0.0001). Scale bars = 2 μm (A) and 5 μm (B).
Figure 2
Figure 2
Crystal Structure of the LZ:CM2 Complex (A) Schematic illustration of Drosophila Cnn highlighting predicted coiled-coil regions (bubbles; predicted by COILS [Lupas et al., 1991]), predicted disordered regions (black lines; predicted by XtalPred-RF [Slabinski et al., 2007]), and the LZ (blue) and CM2 (orange) domains. Expanded regions show multiple sequence alignments (MSAs) of the regions used for crystallization (see Figure S1A for a more comprehensive MSA of the CM2 domain); boxed regions indicate residues visible in the crystal structures. Bars indicate the interaction interface with dots or asterisks over the bars highlighting residues buried in the interface. Asterisks highlight residues subjected to mutational analysis. Residues identified by SOCKET (Walshaw and Woolfson, 2001) as belonging to a canonical coiled coil in the structure are annotated beneath the sequence with a–g lettering. (B) Side and top views of the LZ (blue):CM2 (orange) complex, shown in cartoon representation; a space-filling model of LZ is overlaid with a reduced opacity. The coordinating Zn2+ ion is shown as a green sphere. The N terminus (NT) and C terminus (CT) of each protein are indicated. (C) Close up view of the N-terminal region of CM2 highlighting the coordination of the Zn2+ ion. (D) Ribbon diagram of three different LZ:CM2 domain crystal structures (shades of gray) overlaid on the original LZ:CM2 structure (blue and orange) shown in (B); the N termini of the different LZ constructs are indicated by arrows. The core of the LZ:CM2 interaction interface is similar in all of the structures (red box), but the surrounding helical regions exhibit considerable variation. (E) An overlay of the LZ:CM2 structure (blue:orange) and the Homer1:Homer1 tetramer (gray) (PDB: 3CVE). See also Figures S1 and S2.
Figure 3
Figure 3
SEC-MALS Analysis of WT and Mutant LZ, CM2, and LZ:CM2 Complexes (A–D) SEC-MALS analyses of either WT LZ (blue), WT CM2 (orange), or the WT LZ:CM2 complex (green) (A), a representative example of a CM2 mutant (T1133E) that does not form a complex with LZ (B), a representative example of an LZ mutant (L528E) that does not form a complex with CM2 (C), or an analysis of the LZ mutant (L535E) that can still form a complex with CM2, even though it can no longer form a homo-tetramer on its own (D). (E and F) Tables summarizing the ability of the various CM2 mutants (E) or LZ mutants (F) to form the LZ:CM2 hetero-tetramer. See also Figures S4 and S5.
Figure S1
Figure S1
CM2 Assembles into a Helical Dimer in Solution that further Assembles into an Antiparallel Tetramer In Crystallo, Related to Figures 2 and 4 (A) An extended Multiple Sequence Alignment (MSA) of the CM2 domain: boxed residues are visible in the crystal structures. Residues that have been subjected to mutational analyses are highlighted with asterisks: color corresponds to the color illustrated in the crystal structures. (B) Cartoon representation of the CM2 dimer, and space-filling diagram of the CM2 tetramer formed in crystallo. Several conserved residues are highlighted in color. (C) SEC-MALS analysis of the purified CM2 domain at different concentrations, illustrating that the protein forms a stable dimer with little tendency to form higher-order oligomers even at high protein concentrations.
Figure 4
Figure 4
An Analysis of the Ability of Various LZ and CM2 Mutants to Support Cnn-Scaffold Assembly In Vivo (A) Views of the LZ:CM2 complex (shown in cartoon representation; space-filling model overlaid with reduced opacity) highlighting the LZ (blue) and CM2 (orange) residues in the interaction interface subjected to mutational analysis. (B and C) Micrographs illustrate and graphs quantify the centrosomal GFP-fluorescence levels of WT-GFP-Cnn or the various LZ (B) or CM2 (C) mutants; Spd-2-RFP is shown as a centrosomal marker. Note how the LZ mutants are still recruited to the centrosome, but, with the exception of the L535E, they cannot assemble a scaffold, while the CM2 mutants, with the exception of the control R1141H mutation, are not efficiently recruited to the centrosome and cannot assemble a scaffold. (D and E) Overlays of the WT LZ:CM2 complex (gray) and the LZ-L535E:CM2 complex (blue and orange). E535—shown as a space-filled residue (D)—is accommodated within the interaction interface, and the enlarged image (E) shows how E535 (blue) hydrogen bonds with the conserved T1133 residue. Error bars (B and C) represent the SD of the mean. Statistical significance (compared to WT [above each bar] and either Cnn-ΔLZ or Cnn-ΔCM2 [line at the top of the graph]) was assessed using an unpaired t test in GraphPad Prism (p < 0.05; ∗∗p < 0.01; ∗∗∗p < 0.001; ∗∗∗∗p < 0.0001). See also Figures S1, S2, and S3. Scale bars = 2 μm.
Figure S2
Figure S2
The Zn2+ Ion in the CM2 Dimer Is Required for CM2 Dimerization In Vitro and Efficient Cnn-Scaffold Assembly In Vivo, Related to Figures 2 and 4 (A) SEC-MALS analysis of WT-CM2 in buffer without (black) or with (brown) EDTA, or a mutant form of CM2 in which the Zn2+ coordinating His and Cys residues have been mutated to Ala (CM2-HCAA). Removing the Zn2+ or mutating the Zn2+ binding residues causes the purified CM2 to behave as a monomer. (B) Micrographs illustrate and graphs quantify the centrosomal localization of WT-GFP-Cnn, GFP-Cnn-ΔCM2 and GFP-Cnn-HCAA; Spd-2-RFP is shown as a centrosomal marker. Error bars represent the SD of the mean from at least 5 embryos. Statistical significance (compared to WT [above each bar] or Cnn-ΔCM2 [line at the top of the graph]) was assessed using an unpaired t test in GraphPad Prism (∗∗∗∗p < 0.0001). Scale bar = 2 μm.
Figure S3
Figure S3
The LZ Domain Contains Cys Residues that Form Disulphide Bonds in the Crystal Structure, Related to Figure 2 A side-on view showing the Cys residues that form disulphide bonds in the LZ portion of the LZ:CM2 structure.
Figure S4
Figure S4
A Circular Dichroism Analysis of WT and Mutant CM2 and LZ Proteins, Related to Figure 3 (A) Circular Dichroism (CD) analysis showing that the WT-CM2 and various mutant-CM2 proteins are all largely helical in nature. (B) CD analysis showing that the WT-LZ protein is largely helical in nature, but the helical nature of the various mutant-LZ proteins is disrupted to varying degrees. The top traces show a single analysis for each protein at 0.2 mg/ml, while the bottom traces compare the analysis for each protein at 0.2 mg/ml (solid lines) and 0.6 mg/ml (dotted lines). This analysis reveals that none of the proteins show a tendency to become more helical at higher concentrations. This is important, as the helicity of the L535E mutant (red line) is strongly disrupted, yet the crystal structure reveals that this protein is largely helical when bound to CM2 (Figures 4D and 4E); this strongly suggests that binding to CM2 can induce the proper folding of the LZ domain, a result that supports the idea that CM2 can bind to and stabilize a partially unwound PReM domain (Figure 6). (C) CD analysis of LZ-L535E at 0.8 mg/ml showing the ellipticity (red line) and the HT voltage (black line). Also marked is a line representing the HT voltage threshold for reliable signal (700 V). At this concentration the detector signal becomes unreliable at 205 nm, close to the first negative for α-helical signal at 208 nm.
Figure S5
Figure S5
SEC-MALS Analysis of Various Mutant LZ or Mutant CM2 Proteins and Mutant LZ:CM2 Complexes, Related to Figure 3 (A–E) SEC-MALS analyses of the additional LZ and CM2 mutants whose behavior is summarized, but not shown, in Figure 3. CM2-I1126E (A), CM2-L1137E (B), LZ-L532E (C), LZ-L539E (D), LZ-L542E (E).
Figure 5
Figure 5
The PReM Domain Interacts with CM2 and Forms Large, Micron-Scale Complexes Whose Assembly Is Promoted by Plk1-Mediated Phosphorylation (A) Schematic illustration of the PReM domain showing the internal LZ (taken from the LZ:CM2 crystal structure) and surrounding sequences that are predicted to be helical (Jones, 1999) (blue bars). The ten Ser/Thr residues potentially phosphorylated by Polo are indicated by red asterisks; the larger asterisk represents the S567 residue used to raise the phospho-specific antibody. (B and C) SEC-MALS analysis of MBP-PReM (blue) and either CM2 (B) or CM2-T1133E (C) (orange) and MBP-PReM+CM2 (B) or MBP-PReM+CM2-T1133E (C) (green). (D) Chart quantifies and micrographs show examples of the micron-scale complexes visible by fluorescence microscopy when PReM-GFP is mixed with either WT (left) or mutant (example shown T1133E, right) forms of CM2. Error bars indicate SD. Both proteins are at a final concentration of 20 μM. (E) Micrographs show a FRAP analysis of protein turnover in the PReM-GFP:CM2 complexes (as seen in [D]). Complexes were imaged (t = −2 min), a small area was photobleached (t = 0 min), and fluorescence recovery monitored (t = 20 min). (F) Western dot-blot shows that PReM-GFP is phosphorylated by purified Plk1 in vitro, allowing the phospho-specific Cnn-pS567 antibody to recognize the protein; the same blot was probed with anti-GFP antibodies to confirm equal loading of PReM-GFP. (G) Graph quantifies the visible area of the PReM-GFP:CM2 complexes (both proteins at a final concentration of 10 μM) at various time points after mixing when the PReM-GFP protein has been pre-treated with Plk1 (red line) or with buffer control (gray line). Error bars indicate SD (n = three independent experimental replicates; note that one outlier time point in one experiment that was ∼10 times brighter than all the others was excluded from this analysis). (H) Micrographs show how anti-Cnn-p567 antibodies (red) preferentially recognize the inner region of the centrosome and are largely absent from the more peripheral regions (in some cases highlighted with arrows) recognized by antibodies that recognize total Cnn (green). See also Figure S6. Scale bars = 10 μm (A), 5 μm (E), and 3 μm (H).
Figure S6
Figure S6
SEC-MALS Analysis of PReM-Domain Binding to Mutant CM2 Proteins, Related to Figure 5 (A and B) SEC-MALS analyses showing the inability of the CM2 mutants CM2-I1126E (A) and CM2-L1137E (B) to bind MBP-PReM.
Figure 6
Figure 6
A Schematic Illustration of How Cnn Molecules Might Assemble into a Scaffold around the Mother Centriole (A) In the cytoplasm, Cnn exists as a dimer: the PReM-LZ and CM2 structures are highlighted, and the other sequences within Cnn are depicted with dotted lines (not to scale). (B) Cnn dimers are recruited to the mother centriole through their CM2 domains. (C) These molecules are phosphorylated in their PReM domains—and almost certainly at several other sites that are not depicted here (Conduit et al., 2014a). Phosphorylation destabilizes the helical dimer, allowing it to partially “unwind.” (D) The partial unwinding of the dimer allows the CM2 domain to interact with the LZ, either intra-molecularly (i) or inter-molecularly (ii); the partial unwinding of the helices could allow the Cnn molecules, which are predicted to consist largely of coiled-coil domains but also contain predicted disordered regions (Figure 2A), extra flexibility to form an intra-molecular interaction. The formation of the LZ:CM2 complex allows Cnn molecules to assemble into larger complexes; two models of how this might occur are shown here. Note that in (i), phosphorylation destabilizes intra-molecular PReM domain interactions but does not prevent inter-molecular PReM domain interactions. We think this plausible, as the intra-molecular dimer might initially be slightly destabilized by phosphorylation but then more strongly destabilized by the binding of CM2, thus favoring inter-molecular interactions. An alternative possibility is that phosphorylated PReM domains no longer tend to form dimers but tend to form higher-order oligomers (although this is not illustrated here). There is some evidence for this idea as, in vitro, MBP-PReM forms a stable dimer, whereas MBP-PReM-10D/E forms larger oligomers (Conduit et al., 2014a).

Comment in

References

    1. Adams P.D., Afonine P.V., Bunkóczi G., Chen V.B., Davis I.W., Echols N., Headd J.J., Hung L.-W., Kapral G.J., Grosse-Kunstleve R.W. PHENIX: a comprehensive Python-based system for macromolecular structure solution. Acta Crystallogr. D Biol. Crystallogr. 2010;66:213–221. - PMC - PubMed
    1. Banani S.F., Lee H.O., Hyman A.A., Rosen M.K. Biomolecular condensates: organizers of cellular biochemistry. Nat. Rev. Mol. Cell Biol. 2017;18:285–298. - PMC - PubMed
    1. Banwell E.F., Abelardo E.S., Adams D.J., Birchall M.A., Corrigan A., Donald A.M., Kirkland M., Serpell L.C., Butler M.F., Woolfson D.N. Rational design and application of responsive α-helical peptide hydrogels. Nat. Mater. 2009;8:596–600. - PMC - PubMed
    1. Barr A.R., Kilmartin J.V., Gergely F. CDK5RAP2 functions in centrosome to spindle pole attachment and DNA damage response. J. Cell Biol. 2010;189:23–39. - PMC - PubMed
    1. Buchan D.W., Minneci F., Nugent T.C., Bryson K., Jones D.T. Scalable web services for the PSIPRED Protein Analysis Workbench. Nucleic Acids Res. 2013;41:W349–W357. - PMC - PubMed