. 2017 Jun 1;169(6):1105-1118.e15.
doi: 10.1016/j.cell.2017.05.010.

A Class of Environmental and Endogenous Toxins Induces BRCA2 Haploinsufficiency and Genome Instability

Affiliations

A Class of Environmental and Endogenous Toxins Induces BRCA2 Haploinsufficiency and Genome Instability

Shawn Lu Wen Tan et al. Cell. .

Abstract

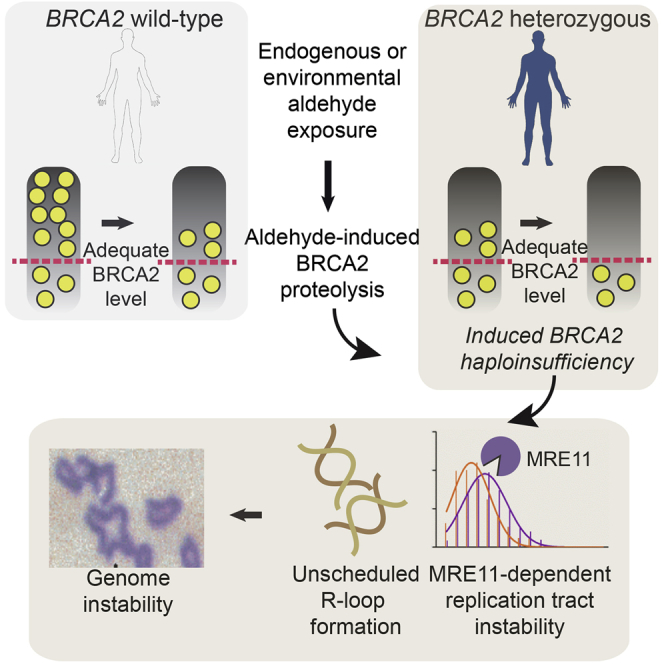
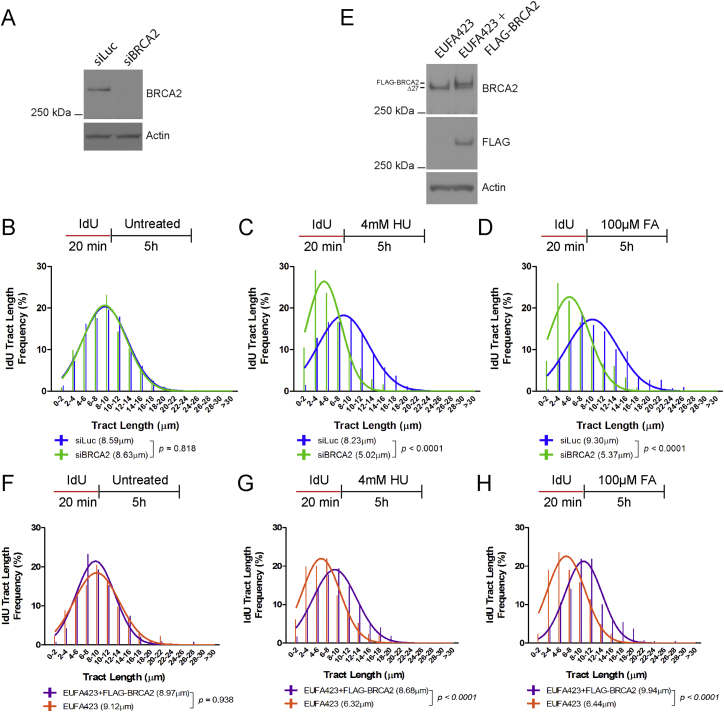
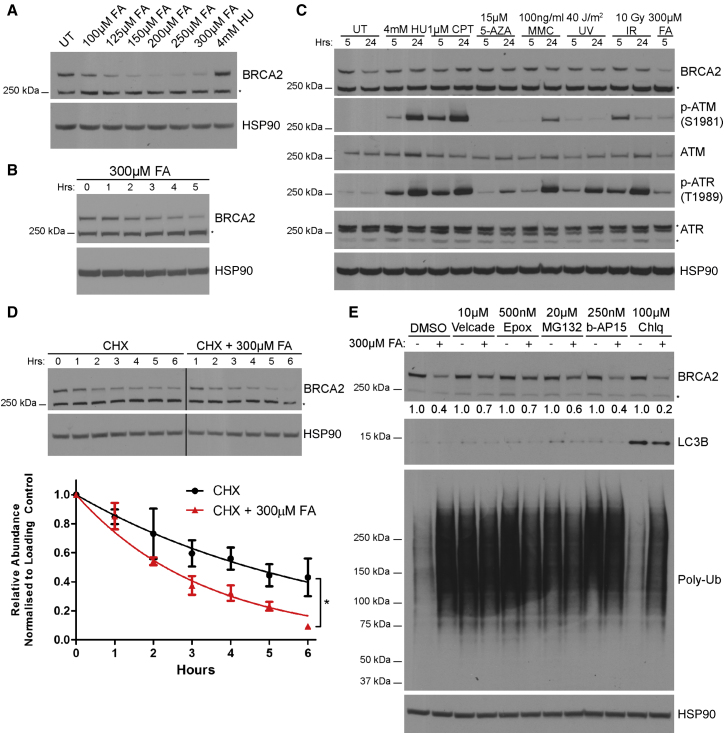
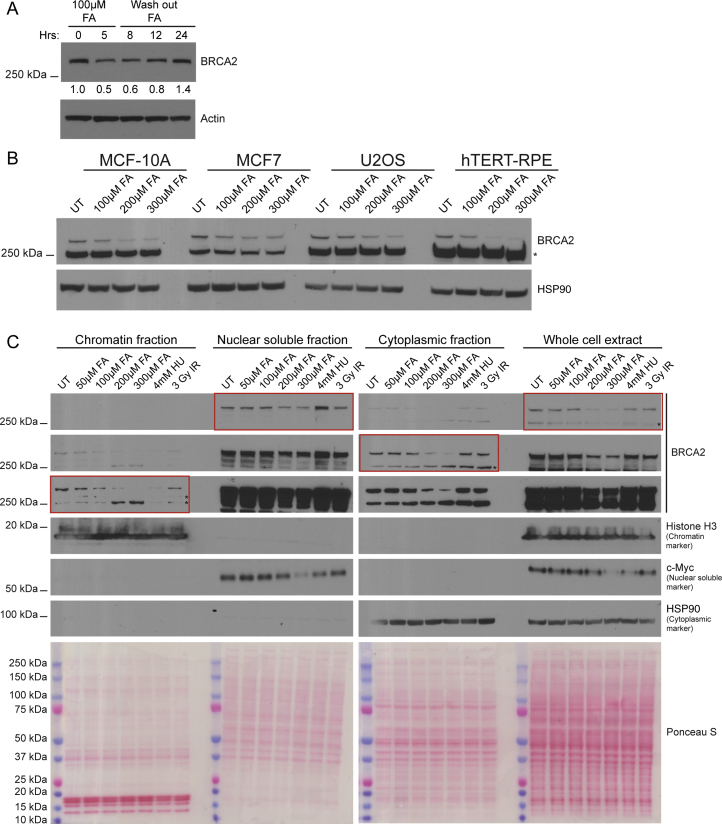
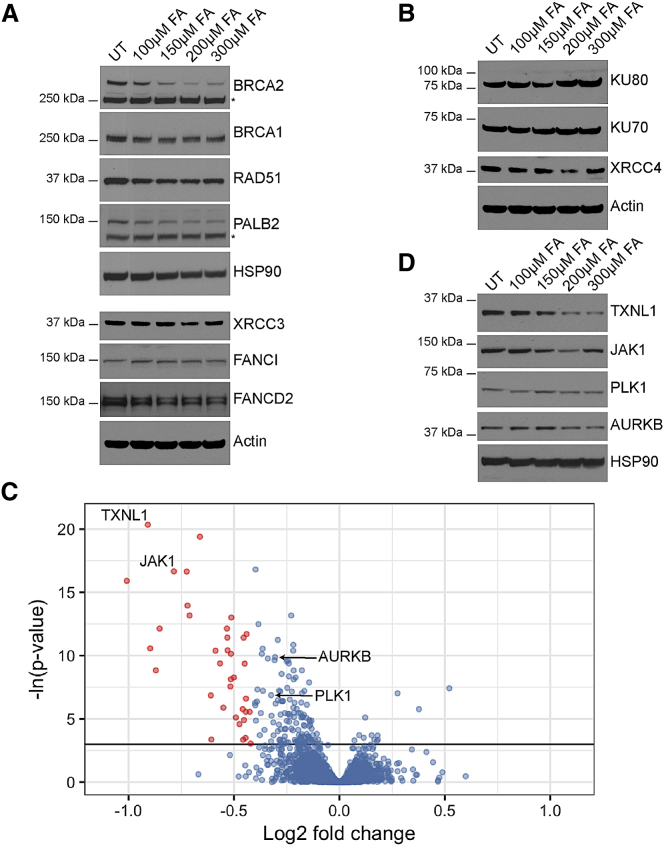
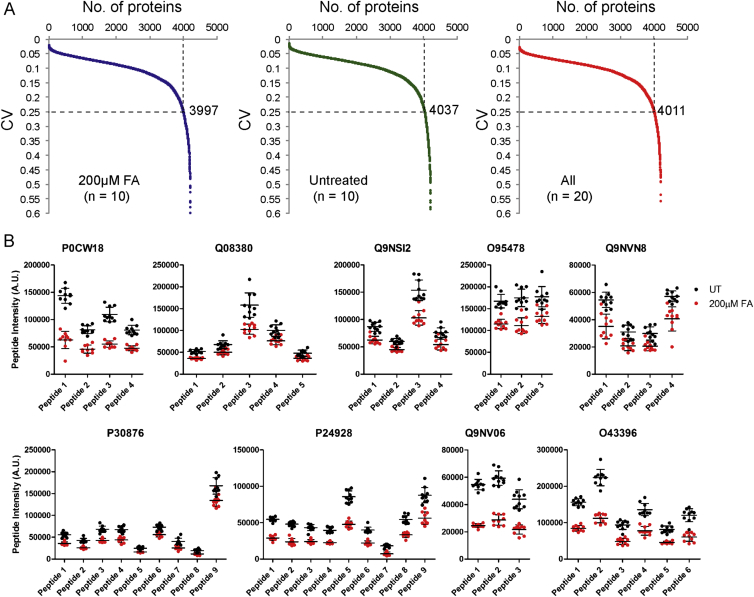
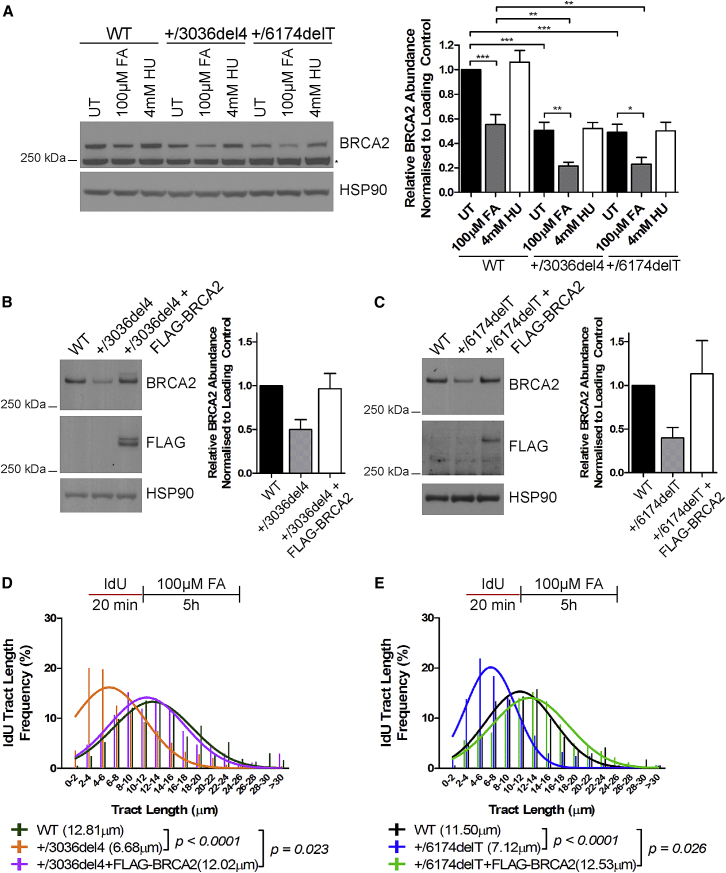
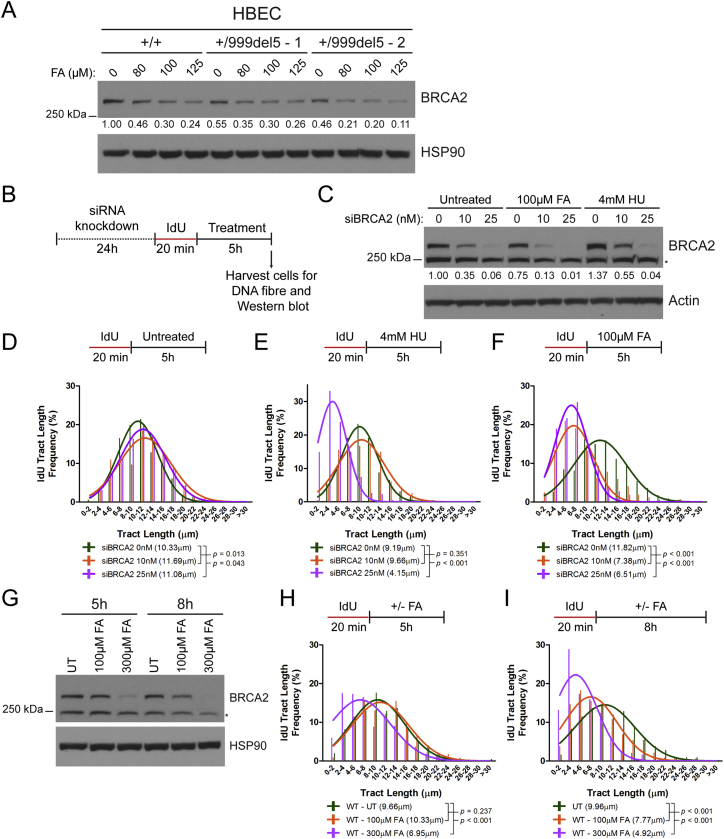
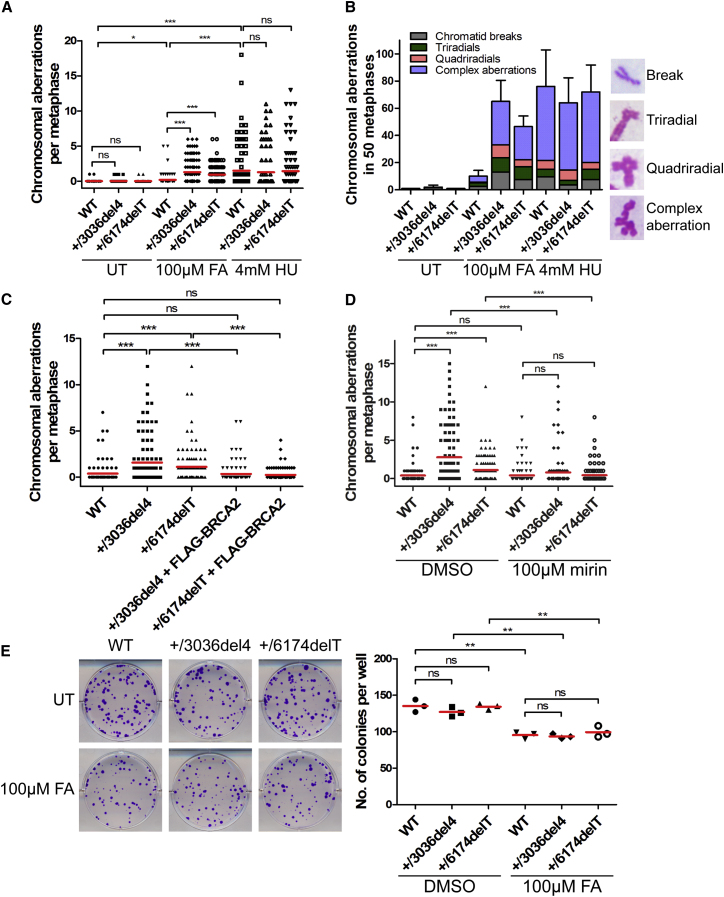
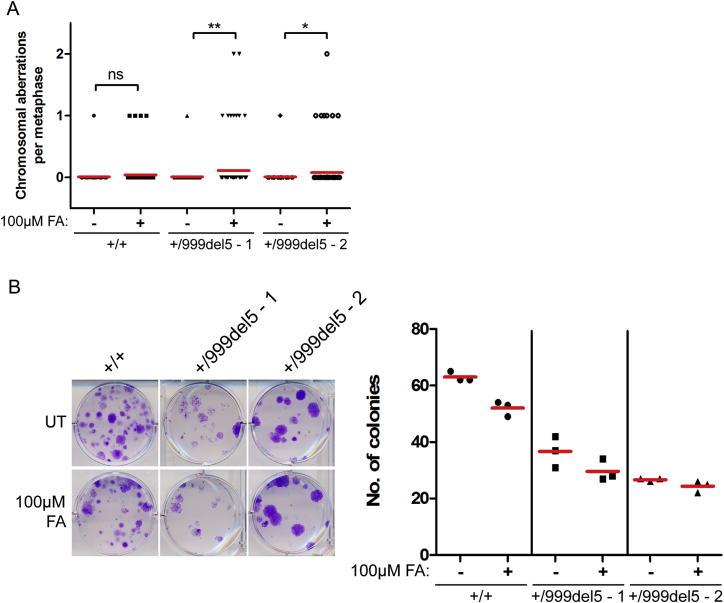
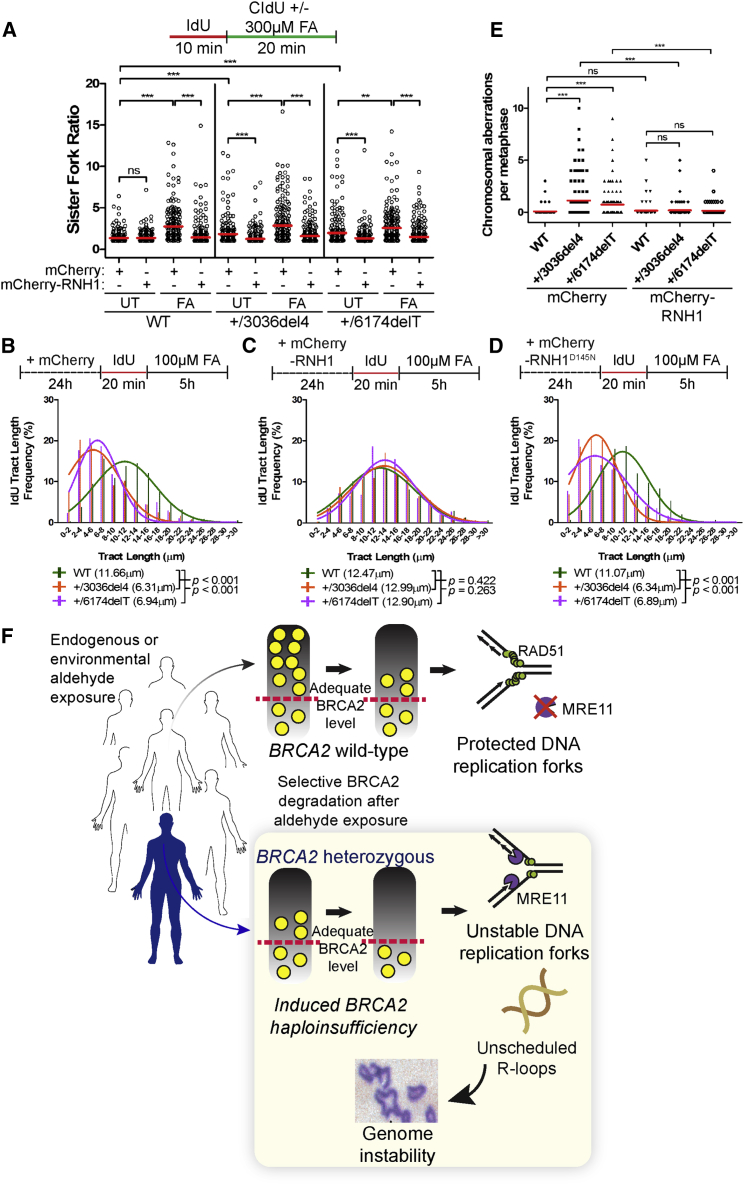
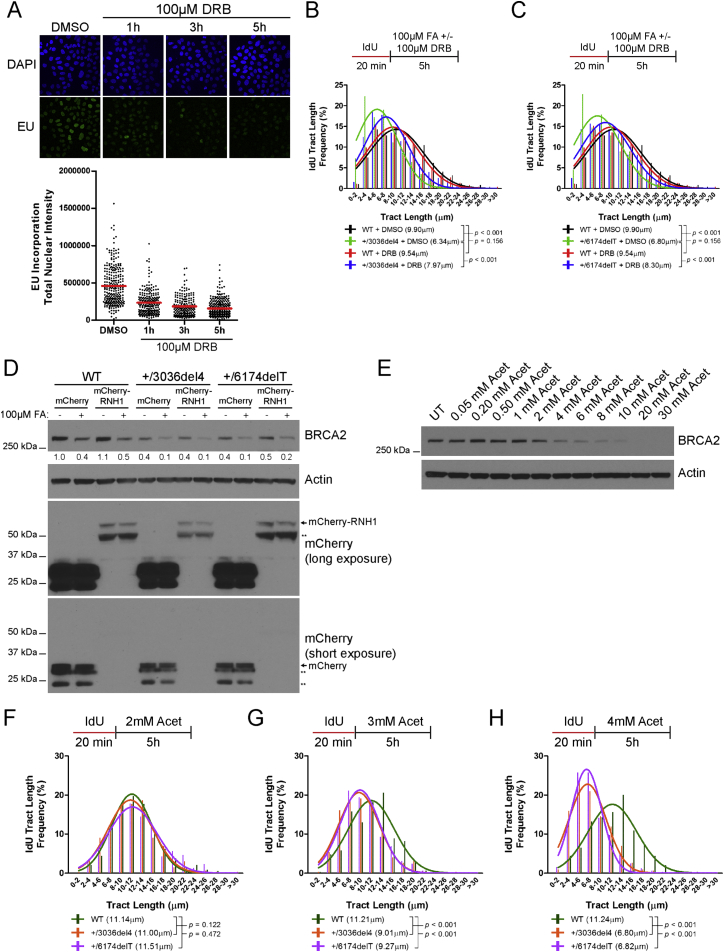
Mutations truncating a single copy of the tumor suppressor, BRCA2, cause cancer susceptibility. In cells bearing such heterozygous mutations, we find that a cellular metabolite and ubiquitous environmental toxin, formaldehyde, stalls and destabilizes DNA replication forks, engendering structural chromosomal aberrations. Formaldehyde selectively depletes BRCA2 via proteasomal degradation, a mechanism of toxicity that affects very few additional cellular proteins. Heterozygous BRCA2 truncations, by lowering pre-existing BRCA2 expression, sensitize to BRCA2 haploinsufficiency induced by transient exposure to natural concentrations of formaldehyde. Acetaldehyde, an alcohol catabolite detoxified by ALDH2, precipitates similar effects. Ribonuclease H1 ameliorates replication fork instability and chromosomal aberrations provoked by aldehyde-induced BRCA2 haploinsufficiency, suggesting that BRCA2 inactivation triggers spontaneous mutagenesis during DNA replication via aberrant RNA-DNA hybrids (R-loops). These findings suggest a model wherein carcinogenesis in BRCA2 mutation carriers can be incited by compounds found pervasively in the environment and generated endogenously in certain tissues with implications for public health.

Keywords: BRCA2; R-loop; SWATH-MS; acetaldehyde; aldehyde; formaldehyde; induced haploinsufficiency; proteasomal degradation; replication stress.


Figures

None
Graphical abstract
Figure 1
Figure 1
Formaldehyde Stalls DNA Replication and Induces Strand Breakage in Dividing Cells (A) Immunofluorescence images of HeLa Kyoto cells labeled with EdU (1 hr) after 2 hr formaldehyde (FA) treatment. UT, untreated. Scale bars, 20 μm. The histogram quantifies the mean ± SEM of total EdU nuclear intensities, n = 3. (B) DNA fiber analysis comparing sister fork symmetry. The experimental setup and representative images are shown. The scatterplot compares the ratio of sister-fork tract lengths (see the STAR Methods) between untreated (UT) and FA-treated conditions. Red lines represent the median, n = 3. Statistical significance was determined by the Mann-Whitney t test, n = 3. (C) Mean ± SEM of γH2AX foci per cell 3 hr after indicated treatments. Greater than or equal to 1,500 cells were analyzed per condition. Statistical significance was determined by the two-tailed Student’s t test, n = 4. (D) Mean ± SEM of γH2AX foci per cell in PCNA+ versus PCNA cells after 3-hr exposure to FA or HU. Statistical significance was determined by the two-tailed Student’s t test, n = 3.
Figure 2
Figure 2
Heterozygosity for BRCA2 Truncating Mutations Selectively Sensitizes Cells to Formaldehyde-Induced Replication Stress (A) The pathogenic BRCA2 truncating mutants used in this work. DBD, DNA binding domain; NLS, nuclear localization signal. (B) BRCA2 protein levels in HeLa Kyoto cells. Denotes non-specific bands. The histogram plots normalized BRCA2 band intensities (mean ± SEM, n = 3). (C–E) IdU tract length frequency distributions of wild-type HeLa Kyoto versus BRCA2+/3036del4 heterozygous cells (C) without treatment, (D) with 4 mM HU, and (E) with 100 μM FA. (F–H) IdU tract length frequency distributions of wild-type HeLa Kyoto versus BRCA2+/6174delT heterozygous cells (F) without treatment, (G) with 4 mM HU, and (H) with 100 μM FA. (I) IdU tract length frequency distributions of BRCA2+/+ HBECs treated with or without FA for 5 hr. (J) IdU tract length frequency distributions of BRCA2+/999del5 - 1 HBECs treated with or without FA for 5 hr. (K) IdU tract length frequency distributions of BRCA2+/999del5 - 2 HBECs treated with or without FA for 5 hr. (L and M) IdU tract length frequency distributions of HeLa Kyoto cells after treatment with FA in the presence (100 μM) or absence (DMSO) of Mirin. Results in (C)–(M) represent at least two independent experiments. See also Figures S1 and S2.
Figure S1
Figure S1
Related to Figure 2 (A) Growth curves of HeLa Kyoto cells. Mean ± SD from nine fields of view. (B) Number of RAD51 foci per cell in HeLa Kyoto cells 3h after exposure to 5 Gy ionising radiation. Mean ± SEM, n = 3. (C–E) IdU tract length frequency distributions in HeLa Kyoto cells after treatment with different doses of FA for 5h. (F–H) IdU tract length frequency distributions in HeLa Kyoto cells after treatment with 80μM FA for different lengths of time. (I) BRCA2 protein levels in BRCA2+/+ or BRCA2+/999del5 human breast epithelial cells. Normalized BRCA2 band intensities are represented in the histogram. Mean ± SEM, n = 2.
Figure S2
Figure S2
Related to Figure 2 (A) BRCA2 protein levels in wild-type HeLa Kyoto cells 24h after transfection with 50nM short interfering RNAs to Luc (siLuc) or BRCA2 (siBRCA2). (B–D) IdU tract length frequency distributions of wild-type HeLa Kyoto cells treated with (siBRCA2) or without (siLuc) BRCA2 knockdown under the indicated conditions. (E) BRCA2 protein levels in EUFA423 cells and EUFA423 cells complemented with FLAG-BRCA2. Δ27 refers to the exon 27 truncated variant from the BRCA2 9900insA mutant allele. The truncated product from the BRCA2 7691insAT allele was not detectable. (F–H) IdU tract length frequency distributions of EUFA423 cells, with or without FLAG-BRCA2 complementation, treated under the indicated conditions. Results in (B)–(D) and (F)–(H) represent two independent experiments.
Figure 3
Figure 3
Selective Proteasomal Degradation of BRCA2 Protein after Formaldehyde Exposure (A) BRCA2 protein levels in wild-type HeLa Kyoto cells after 5-hr treatments. (B) BRCA2 protein levels in wild-type HeLa Kyoto cells treated as indicated. (C) BRCA2 protein levels in wild-type HeLa Kyoto cells treated with various DNA damaging agents for the indicated durations. HU, hydroxyurea; CPT, camptothecin; 5-AZA, 5-azacytidine; MMC, mitomycin C; UV, ultraviolet; IR, ionizing radiation; FA, formaldehyde. (D) BRCA2 protein turnover in wild-type HeLa Kyoto cells treated with or without 300 μM FA. Mean ± SEM of BRCA2 band intensities normalized to loading control and 0 hr, n = 3. CHX, cycloheximide. (E) BRCA2 protein levels in wild-type HeLa Kyoto cells pre-treated with various inhibitors for 3 hr prior to addition of 300 μM FA for 3 hr. Normalized BRCA2 band intensities are shown below. Results represent two independent experiments. Epox, epoxomicin; Chlq, chloroquine. See also Figure S3.
Figure S3
Figure S3
Related to Figure 3 (A) BRCA2 protein levels at the indicated time points in wild-type HeLa Kyoto cells. Cells were treated with 100μM FA for 5h, washed and harvested for western blotting at the indicated time points. Numbers below the BRCA2 blot represent densitometric measurements of BRCA2 band intensities normalized to loading control and the 0h time point. (B) BRCA2 protein levels in cells from four different cell lines after treatment with the increasing doses of formaldehyde for 5h. (C) BRCA2 protein levels in different cellular fractions of wild-type HeLa Kyoto cells after exposure to the indicated treatments for 3h. Different exposures of BRCA2 are shown, with red boxes highlighting the appropriate exposures for the various fractions.
Figure 4
Figure 4
Formaldehyde Selectively Depletes Components of the Cellular Proteome (A) Abundance of proteins involved in homologous recombination or the Fanconi anemia repair pathway in wild-type HeLa Kyoto cells treated with FA for 5 hr. (B) Abundance of proteins involved in non-homologous end-joining in HeLa Kyoto cells treated with FA for 5 hr. (C) Volcano plot showing the results of the SWATH-MS analysis of HeLa Kyoto cells treated with or without 200 μM FA for 5 hr. Each dot represents a protein with Benjamini-Hochberg adjusted p values plotted along the y axis, and the fold change in abundance following FA treatment along the x axis. The horizontal black line indicates where p = 0.05. Red dots mark proteins that are depleted by ≥25% compared to untreated controls in a statistically significant manner (p < 0.05). Proteins tested by western blotting are labeled. (D) Abundance of selected proteins from SWATH-MS analysis in HeLa Kyoto cells treated with FA for 5 hr. See also Figure S4 and Tables S1 and S2.
Figure S4
Figure S4
Related to Figure 4 (A) Coefficient of variation (CV) distribution of the normalized SWATH intensities for FA-treated samples (left panel, 10 replicates), untreated samples (middle panel, 10 replicates), and all samples (right panel, 10 + 10 samples). The line of CV at 25% is illustrated by the horizontal dotted line. (B) Normalized peptide intensities of individual peptides in at least 8 out of 10 biological replicates of 9 representative proteins showing statistically significant depletion of protein abundances by more than 25% after formaldehyde treatment.
Figure 5
Figure 5
BRCA2 Complementation in BRCA2 Heterozygous Cells Is Sufficient to Counteract Formaldehyde-Induced Replication Stress (A) BRCA2 abundance in HeLa Kyoto cells treated as indicated for 5 hr. Mean ± SEM of BRCA2 band intensities normalized to loading controls are plotted, n = 8. (B and C) BRCA2 abundance in (B) BRCA2+/3036del4 and (C) BRCA2+/6174delT heterozygous cells complemented with FLAG-BRCA2, plotted as in (A). (D) IdU tract length frequency distributions of BRCA2+/3036del4 heterozygous cells complemented with FLAG-BRCA2 after FA exposure for 5 hr. (E) IdU tract length frequency distributions of BRCA2+/6174delT heterozygous cells complemented with FLAG-BRCA2 after FA exposure for 5 hr. Results of D and E represent two independent experiments. See also Figure S5.
Figure S5
Figure S5
Related to Figure 5 (A) BRCA2 protein levels in BRCA2+/+ and BRCA2+/999del5 human breast epithelial cells (HBECs) treated with increasing doses of FA for 5h. Numbers below the BRCA2 blot represent densitometric measurements of BRCA2 protein levels normalized to loading control and untreated BRCA2+/+ cells (lane 1). Although BRCA2+/999del5 −1 HBECs have lower pre-existing levels of BRCA2 protein than their BRCA2+/+ counterparts, similar levels are reached after formaldehyde exposure. However, since BRCA2+/999del5 −1 HBECs exhibit replication tract instability after formaldehyde exposure whereas their BRCA2+/+ counterparts do not (Figure 2), these observations may reflect differences between these non-isogenic human cell lines in the kinetics of aldehyde-induced BRCA2 depletion, and/or in the level of BRCA2 that is adequate for function. (B) Experimental set-up for the siRNA knockdown DNA fiber experiment. (C) BRCA2 protein levels of wild-type HeLa Kyoto cells following transfection with BRCA2 short interfering RNA (siBRCA2) in combination with the indicated treatments. Numbers below the BRCA2 blot show the densitometric measurements of BRCA2 band intensities normalized to loading control and relative to the untreated control (lane 1). (D–F) IdU tract length frequency distributions of wild-type HeLa Kyoto cells treated under the indicated conditions. (G) BRCA2 protein levels in wild-type HeLa Kyoto cells after treatment with 100μM and 300μM FA for 5h and 8h. (H–I) IdU tract length frequency distributions in wild-type HeLa Kyoto cells after treatment with 100μM and 300μM FA for 5h and 8h respectively.
Figure 6
Figure 6
Formaldehyde Triggers Structural Chromosome Aberrations in BRCA2 Heterozygous Cells (A) Frequency of chromosomal aberrations from HeLa Kyoto cells treated as indicated for 5 hr. Red lines indicate the mean, n = 2. (B) A breakdown of the different types of chromosomal aberrations observed in (A). Examples of various chromosomal aberrations are shown. (C) Frequency of chromosomal aberrations in HeLa Kyoto cells treated with 100 μM FA for 5 hr. Red lines indicate the mean, n = 2. (D) Frequency of chromosomal aberrations in HeLa Kyoto cells treated with 100 μM FA for 5 hr in the presence or absence of Mirin. Red lines indicate the mean, n = 2. (E) Representative images of colony formation by HeLa Kyoto cells treated with or without 100 μM FA for 5 hr. Each dot indicates the colony number per well. Red lines indicate the mean. Results represent two independent experiments. See also Figure S6.
Figure S6
Figure S6
Related to Figure 6 (A) Frequency of chromosomal aberrations in metaphase spreads of HBECs treated with or without 100μM FA for 5h. Red lines indicate the mean, n = 2. (B) Representative images of a colony formation assay of human breast epithelial cells treated with or without 100μM FA for 5h. UT, untreated. The scatterplot shows the number of colonies per well from triplicate wells with red lines indicating the mean number of colonies per well. Representative of two independent experiments.
Figure 7
Figure 7
Ribonuclease H1 Ameliorates Formaldehyde-Induced Replication Stress and Genome Damage (A) DNA fiber assay comparing sister fork symmetry in HeLa Kyoto cells expressing mCherry or mCherry-RNase H1 (RNH1) vectors with or without FA treatment. The scatterplot compares the ratio of sister-fork tract lengths between the different conditions with red lines indicating the median, n = 2. (B) IdU tract length frequency distributions of HeLa Kyoto cells transiently expressing mCherry after FA exposure for 5h. (C) IdU tract length frequency distributions of HeLa Kyoto cells transiently expressing mCherry-RNase H1 after FA exposure for 5h. (D) IdU tract length frequency distributions of HeLa Kyoto cells transiently expressing mCherry-RNase H1 (D145N) after FA exposure for 5h. Results of (B)–(D) represent at least two independent experiments. (E) Frequency of chromosomal aberrations in HeLa Kyoto cells expressing either mCherry or mCherry-RNase H1 following 5 hr treatment with 100 μM FA. Red lines indicate the mean, n = 2. (F) Aldehyde-induced haploinsufficiency in BRCA2 heterozygous cells. Aldehyde exposure triggers selective BRCA2 degradation in the cells of both wild-type individuals as well as those who carry heterozygous BRCA2 mutations. Adequate levels of BRCA2 remain in wild-type individuals. But in BRCA2 heterozygous mutation carriers, aldehyde-induced degradation decreases BRCA2 levels below the threshold of adequacy, engendering “induced haploinsufficiency.” These events expose stalled DNA replication forks to MRE11 activity, engendering chromosomal aberrations via R-loop formation. See also Figure S7.
Figure S7
Figure S7
Related to Figure 7 (A) Immunofluorescence images of wild-type HeLa Kyoto cells treated with the transcription inhibitor, 5,6-dichloro-1-β-D-ribofuranosylbenzimidazole (DRB) at 100μM for the indicated lengths of time and subsequently labeled with EU for 1h as measure of total RNA synthesis. The scatterplot shows the total nuclear intensities of EU signal from at least 200 nuclei per condition with red lines indicating the median and each dot representing a single nucleus. (B and C) IdU tract length frequency distributions in HeLa Kyoto cells after concurrent treatment with 100μM FA and 100μM DRB for 5h. (D) BRCA2 protein levels in HeLa Kyoto cells expressing mCherry or mCherry-RNase H1 vectors after exposure to 100μM FA for 5h. Numbers below the BRCA2 blot represent densitometric measurements of BRCA2 protein levels normalized to loading control and lane 1 of the BRCA2 blot. Different exposures of mCherry blots show expression of mCherry and mCherry-RNase H1 as indicated. Double asterisks (∗∗) indicate probable degradation products. (E) BRCA2 protein levels in wild-type HeLa Kyoto cells after treatment with increasing doses of acetaldehyde for 5h. (F–H) IdU tract length frequency distributions in HeLa Kyoto cells after treatment with 2, 3 or 4 mM acetaldehyde for 5h.

Comment in

Similar articles

Cited by

References

    1. Adey A., Burton J.N., Kitzman J.O., Hiatt J.B., Lewis A.P., Martin B.K., Qiu R., Lee C., Shendure J. The haplotype-resolved genome and epigenome of the aneuploid HeLa cancer cell line. Nature. 2013;500:207–211. - PMC - PubMed
    1. Bhatia V., Barroso S.I., García-Rubio M.L., Tumini E., Herrera-Moyano E., Aguilera A. BRCA2 prevents R-loop accumulation and associates with TREX-2 mRNA export factor PCID2. Nature. 2014;511:362–365. - PubMed
    1. Breast Cancer Linkage Consortium Cancer risks in BRCA2 mutation carriers. J. Natl. Cancer Inst. 1999;91:1310–1316. - PubMed
    1. Cerritelli S.M., Crouch R.J. Ribonuclease H: the enzymes in eukaryotes. FEBS J. 2009;276:1494–1505. - PMC - PubMed
    1. Chitta K., Paulus A., Akhtar S., Blake M.K., Caulfield T.R., Novak A.J., Ansell S.M., Advani P., Ailawadhi S., Sher T. Targeted inhibition of the deubiquitinating enzymes, USP14 and UCHL5, induces proteotoxic stress and apoptosis in Waldenström macroglobulinaemia tumour cells. Br. J. Haematol. 2015;169:377–390. - PMC - PubMed