. 2017 Aug;199(2):120-131.
doi: 10.1016/j.jsb.2017.05.013. Epub 2017 May 30.

Correlative super-resolution fluorescence and electron microscopy using conventional fluorescent proteins in vacuo

Affiliations

Correlative super-resolution fluorescence and electron microscopy using conventional fluorescent proteins in vacuo

Christopher J Peddie et al. J Struct Biol. 2017 Aug.

Abstract

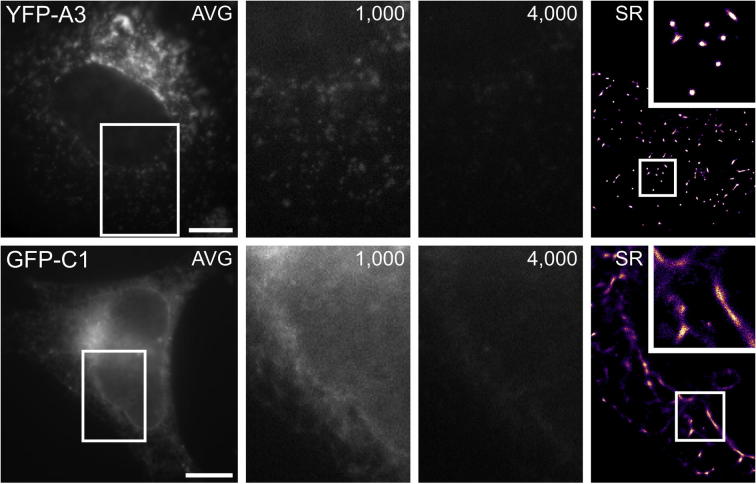
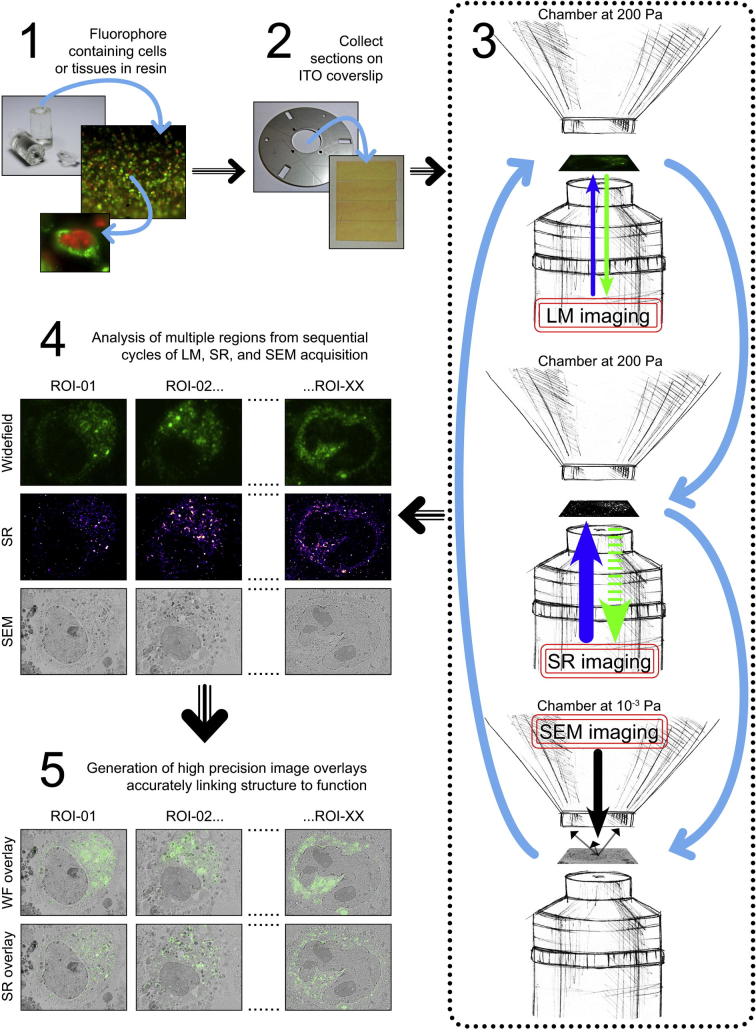
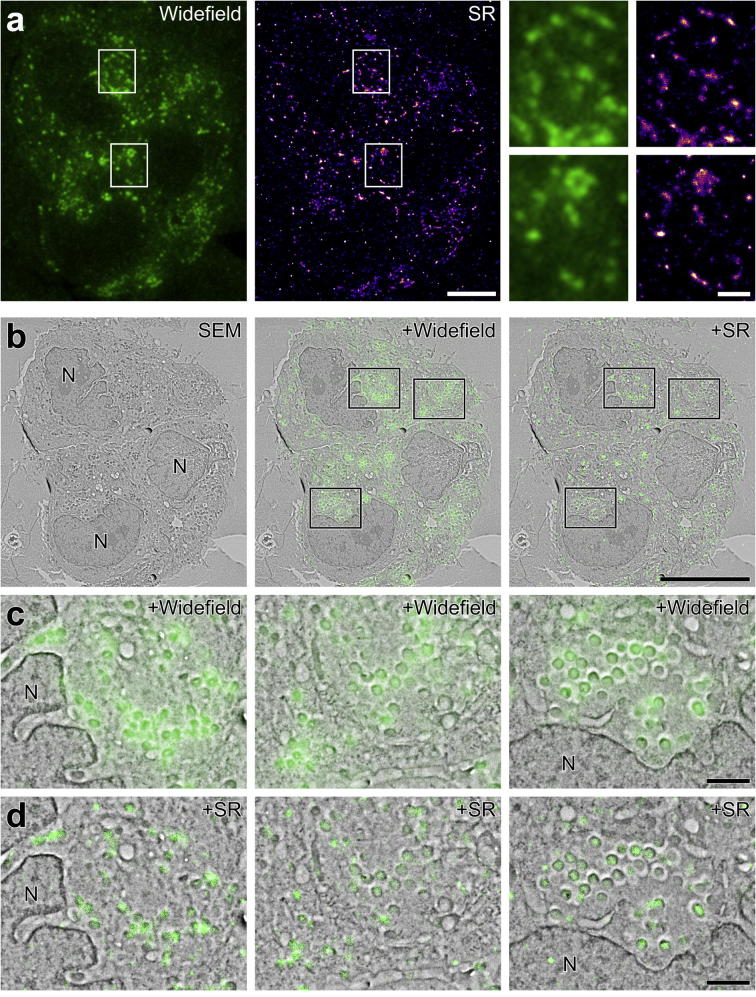
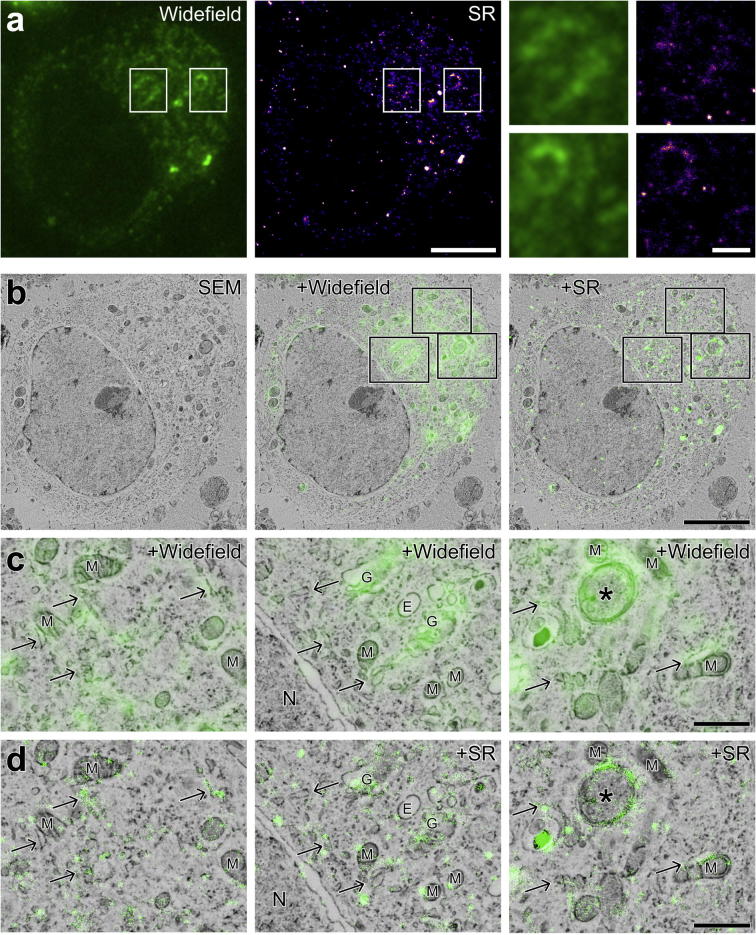
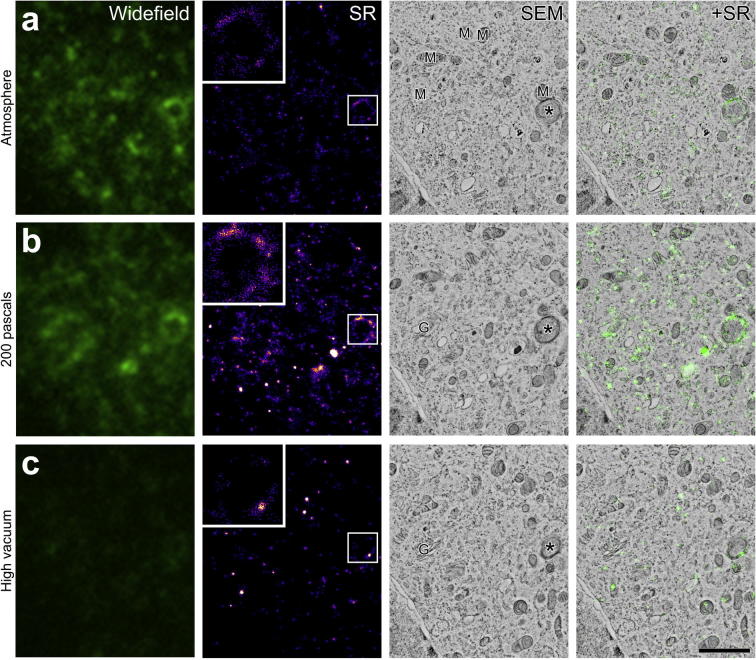
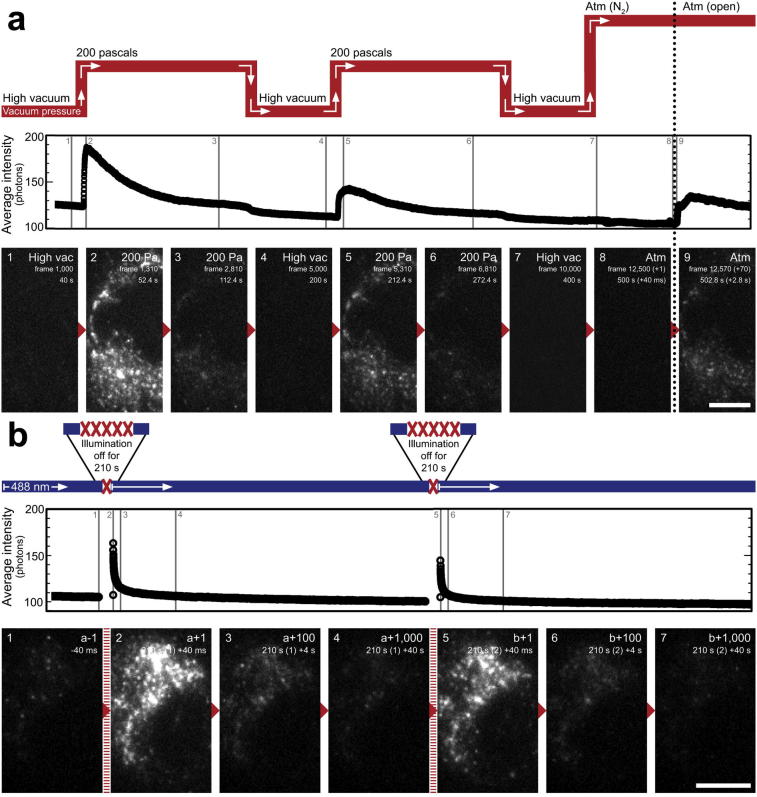
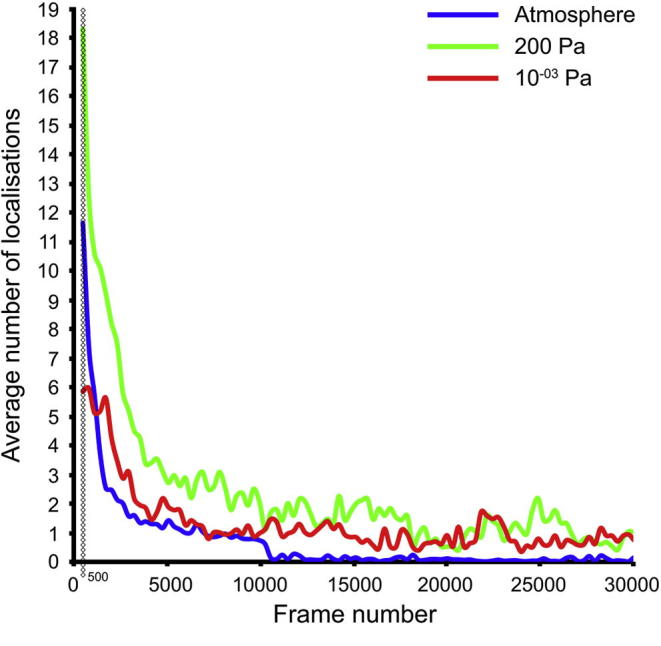
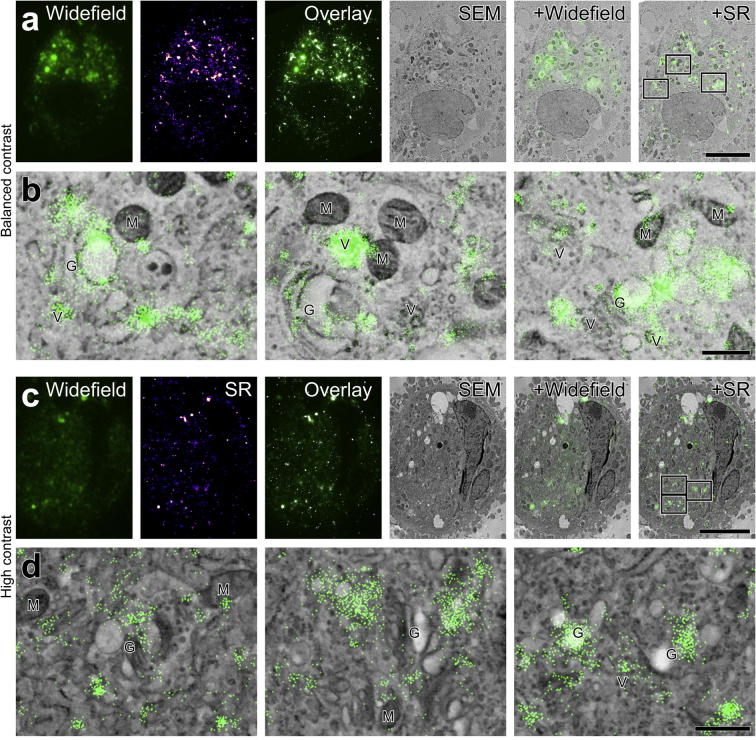
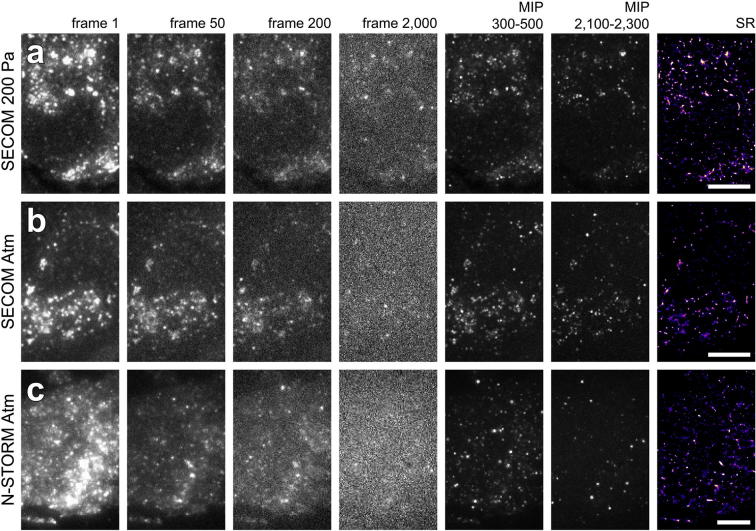
Super-resolution light microscopy, correlative light and electron microscopy, and volume electron microscopy are revolutionising the way in which biological samples are examined and understood. Here, we combine these approaches to deliver super-accurate correlation of fluorescent proteins to cellular structures. We show that YFP and GFP have enhanced blinking properties when embedded in acrylic resin and imaged under partial vacuum, enabling in vacuo single molecule localisation microscopy. In conventional section-based correlative microscopy experiments, the specimen must be moved between imaging systems and/or further manipulated for optimal viewing. These steps can introduce undesirable alterations in the specimen, and complicate correlation between imaging modalities. We avoided these issues by using a scanning electron microscope with integrated optical microscope to acquire both localisation and electron microscopy images, which could then be precisely correlated. Collecting data from ultrathin sections also improved the axial resolution and signal-to-noise ratio of the raw localisation microscopy data. Expanding data collection across an array of sections will allow 3-dimensional correlation over unprecedented volumes. The performance of this technique is demonstrated on vaccinia virus (with YFP) and diacylglycerol in cellular membranes (with GFP).

Keywords: 3-dimensional; Blinking; CLEM; Correlative; Electron microscopy; Fluorescence; GFP; ILSEM; In-resin fluorescence; Integrated; Protein localisation; Super-resolution; Volume; YFP.


Figures

Fig. 1
Fig. 1
FP blinking in fixed HeLa cells at atmospheric pressure using the SECOM stage. Shown are average intensity projections through the image stack (AVG; generated from frames 500–4,000), individual images at 1,000 and 4,000 frames elapsed, and a ThunderSTORM generated reconstruction of the image stack with higher magnification insert. For YFP-A3 vaccinia, the punctate localisation expected from a viral core protein was present in areas of lower fluorophore density e.g. the cell periphery. Localisation of GFP-C1 to the putative Golgi apparatus was visible, in addition to a clearly outlined nuclear envelope. Scale bars – 10 µm (YFP-A3), 5 µm (GFP-C1).
Fig. 2
Fig. 2
Schematic illustrating the typical workflow for WF, SR and EM imaging (modified from Brama et al. (2015)). Specimens were first processed for high pressure freezing and quick freeze substitution as described in Peddie et al. (2014), embedded in acrylic resin, and collected as 200 nm serial sections on an ITO-coated glass coverslip. The coverslip was attached to a SECOM specimen holder, and placed on the SECOM microscope stage. The SEM chamber was pumped to 200 Pa, and WF and SR image acquisition for a specific region of interest was carried out before pumping to high vacuum for SEM BSE image acquisition; after which, the vacuum pressure could be cycled to allow for multiple rounds of image acquisition from several regions of interest within the same specimen, or across serial sections using an array tomography workflow.
Fig. 3
Fig. 3
Comparison of WF to SR highlights significantly improved lateral resolution: YFP-A3. a: WF image showing localisation of YFP-A3 vaccinia within a HeLa cell. The SR reconstruction from a sequence of approximately 30,000 images represents 728,076 individual localisations. Enlargements of the boxed areas show the improved precision of YFP-A3 localisation from SR based image reconstruction. b: Micrograph showing the BSE signal from the group of three cells in A with WF image and SR reconstruction overlaid. c, d: Enlargements of the boxed areas in B showing localisation of the YFP signal to groups of virus particles. Vaccinia virus protein A3 localises to the inner core wall of developing virions (Roos et al., 1996, Wilton et al., 1995). As such, whilst overlay of the WF image highlights closely apposed groups of virions within the cytoplasm, overlay of the SR reconstruction allows more precise identification of specific virions expressing YFP-A3. N: nucleus. Scale bars - 5 µm (a), 10 µm (b), 1 µm (A inset, c, d).
Fig. 4
Fig. 4
Comparison of WF to SR highlights significantly improved lateral resolution: GFP-C1. a: WF image showing localisation of the GFP-C1 construct (and hence the lipid DAG) within a HeLa cell, and SR reconstruction from a sequence of approximately 30,000 images, representing 71,413 individual localisations. Enlargements of the boxed areas show the improved precision of GFP-C1 localisation from SR based image reconstruction. b: Micrograph showing the BSE signal from an individual cell expressing the GFP-C1 construct with WF image and SR reconstruction overlaid. c, d: Enlargements of the boxed areas in B showing localisation of the GFP signal to membranes. The improved lateral resolution of the SR-EM overlay reveals DAG within Golgi stacks, endoplasmic reticulum (arrows), and a putative autophagosome (asterisk). G: Golgi, M: mitochondria, N: nucleus. Scale bars - 5 µm (a, b), 1 µm (A inset, c, d).
Fig. 5
Fig. 5
The quality of SR image reconstructions is directly influenced by the vacuum pressure at the time of acquisition. a: WF, SR and SEM images showing a cropped area of the GFP-C1 expressing cell shown in Fig. 4, acquired with the chamber at atmospheric pressure. The reconstruction represents ∼ 6,000 localisations. b: An area matching that shown in A from the preceding section in the series, acquired at a chamber pressure of 200 Pa, maintained at partial pressure using water vapour. The SR reconstruction represents ∼25,000 localisations. c: An area matching that shown in A and B from the next section in the series, acquired with the chamber pumped to high vacuum (10−3 Pa). The SR reconstruction represents ∼4,000 localisations. G: Golgi, M: mitochondria. Asterisk: putative autophagosome. Scale bar – 2 µm.
Fig. 6
Fig. 6
FP blinking is directly influenced by vacuum pressure and duration of illumination. A: Single frames and a graph of average intensity per frame taken from raw SR image acquisition sequences showing the effect of cycling chamber pressure, and illumination rest periods at 200 Pa, on FP blinking (see also supplementary movies 5 and 6). For each image, the approximate point at which it was recorded is indicated on the intensity graph. The chamber was cycled from 10−3 Pa → 200 Pa → 10−3 Pa → 200 Pa → 10−3 Pa → atmosphere. Frame number and time elapsed in seconds is shown on each image. At frame 1,000, the chamber pressure was set to 200 Pa; the fluorescence intensity and number of actively blinking molecules increased substantially for a short interval once the chamber reached 200 Pa (image 2). After 4,000 frames the chamber was returned to 10−3 Pa. After 5,000 frames, the chamber pressure was set to 200 Pa; the FP intensity and blinking again increased for a short interval once 200 Pa was reached (image 5). In both cases, the increase in intensity was short lived, and declined significantly over the next 2,000 frames to reach a similar pre-cycle level. The cycling process could be repeated multiple times, with similar results each time, though the first cycle was brightest at 200 Pa. The chamber was vented with dry nitrogen after 10,000 frames, which completed by 12,500 frames, and the chamber door was opened. After a short delay (frames recorded since opening the chamber door shown in brackets), FP intensity and blinking again increased, though to a lesser degree than when cycling from 10−3 Pa to 200 Pa. In B, the chamber pressure was maintained at 200 Pa and the light source was switched on/off at defined intervals to examine the effect of a ‘rest’ period on fluorophore response. Shown here are single frames from a sequence of ∼15,000 images; at frame ‘a’, the light source was turned back on after a 5,000 image break (∼3.5 mins), and again at frame ‘b’ after a further 5,000 image break (∼3.5 mins). In both cases, the intensity of fluorescence and number of blinking FPs increased temporarily, and declined over the following 1,000 frames (indicated top right of images). Scale bars – 5 µm.
Supplementary Fig. 1
Comparison of the average number of localisations per frame at different chamber pressures. Graph showing the average number of localisations per frame at atmosphere, 200 Pa, and 10−3 Pa across each 30,000 image sequence from consecutive serial sections (200 Pa data shown in Fig. 4; cropped areas shown in Fig. 5). The first 500 frames were excluded from analysis as the EMCCD was close to saturation and FP blinking was difficult to observe (indicated by vertical line).
Supplementary Fig. 2
The quality of SR image reconstructions, and the number of individual molecule localisations detected, is inversely related to electron contrast. a: WF, SR reconstruction representing 167,796 individual localisations, and overlaid images from a ‘balanced contrast’ cell expressing the GFP-C1 construct, a similar contrast level to that shown in Fig. 3. Electron micrographs with overlaid WF and SR images are also shown. b: Enlargements of the boxed areas in A showing overlay of the SR reconstruction to specific membranous structures with a much higher degree of precision compared to the WF image alone. Cc: WF, SR reconstruction representing 51,494 individual localisations, and overlaid images from a ‘high contrast’ cell expressing the GFP-C1 construct. The signal to noise ratio in the WF image worsens as electron contrast increases, as does the number of localisations for SR reconstruction. Electron micrographs with overlaid WF and SR images are also shown. D: Enlargements of the boxed areas in c. As before, localisation of signal to specific membranous structures is possible, though it is clear that the decreased number of localisations reduces the certainty with which signals can be assigned to specific structures. G: Golgi, M: mitochondria, V: vesicles. Scale bars – 5 µm (a, c), 500 nm (b, d).
Supplementary Fig. 3
FP blinking persists at a higher frequency during imaging at 200 Pa using the SECOM platform (a) when compared to atmospheric pressure in the SECOM platform (b) and the Nikon N-STORM microscope (c). Single frames from a SR acquisition sequence acquired from cells containing YFP-A3 vaccinia in a dry mounted 200 nm thick IRF section. Each dataset was cropped to contain a single cell profile and comprises 2300 images (presented also in supplementary movies 7–9), illustrating the intensity of fluorescent signal at frame 1, 50, 200, and 2000. Note that, for clearer visualisation, contrast normalisation was applied to the 16 bit image sequences (0.1% saturated pixels). Maximum intensity projections from the raw data, and SR reconstructions (generated for each dataset using matching parameters), showed that the signal to noise ratio and number of localisations degraded more quickly in the N-STORM dataset (120,235 localisations were detected for the SECOM reconstruction in a, 77,344 for the SECOM reconstruction in b, and 52,904 for the N-STORM reconstruction in c). Scale bars – 5 µm.

Similar articles

Cited by

References

    1. Arakawa Y., Cordeiro J.V., Schleich S., Newsome T.P., Way M. The release of vaccinia virus from infected cells requires RhoA-mDia modulation of cortical actin. Cell Host Microbe. 2007;1:227–240. - PubMed
    1. Bagshaw C.R., Cherny D. Blinking fluorophores: what do they tell us about protein dynamics? Biochem. Soc. Trans. 2006;34:979–982. - PubMed
    1. Bell K., Mitchell S., Paultre D., Posch M., Oparka K. Correlative imaging of fluorescent proteins in resin-embedded plant material. Plant Physiol. 2013;161:1595–1603. - PMC - PubMed
    1. Betzig E., Patterson G.H., Sougrat R., Lindwasser O.W., Olenych S., Bonifacino J.S., Davidson M.W., Lippincott-Schwartz J., Hess H.F. Imaging intracellular fluorescent proteins at nanometer resolution. Science. 2006;313:1642–1645. - PubMed
    1. Brama E., Peddie C.J., Jones M.L., Domart M.-C., Snetkov X., Way M., Larijani B., Collinson L.M. Standard fluorescent proteins as dual-modality probes for correlative experiments in an integrated light and electron microscope. J. Chem. Biol. 2015;8:179–188.

Publication types

MeSH terms

LinkOut - more resources