. 2017 Oct;16(10):1770-1788.
doi: 10.1074/mcp.M117.066944. Epub 2017 Jun 2.

Identification of Fc Gamma Receptor Glycoforms That Produce Differential Binding Kinetics for Rituximab

Affiliations

Identification of Fc Gamma Receptor Glycoforms That Produce Differential Binding Kinetics for Rituximab

Jerrard M Hayes et al. Mol Cell Proteomics. 2017 Oct.

Abstract

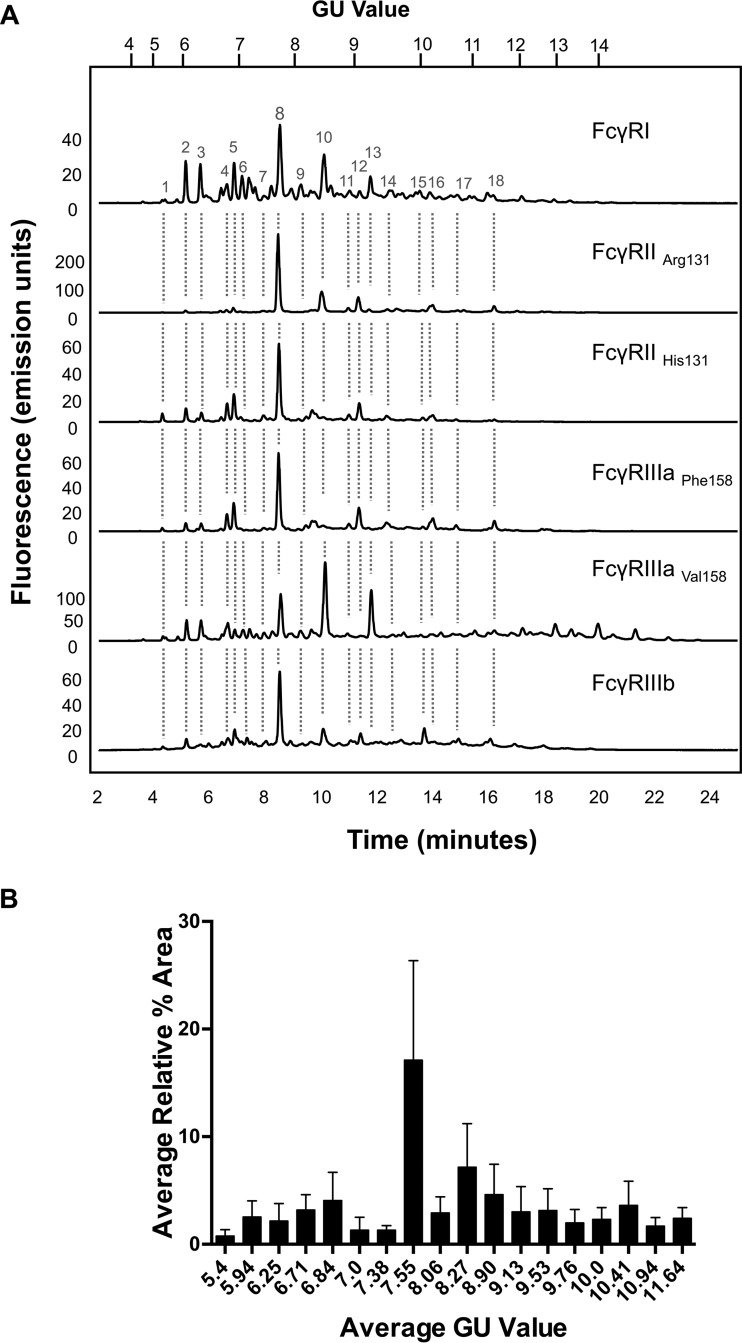
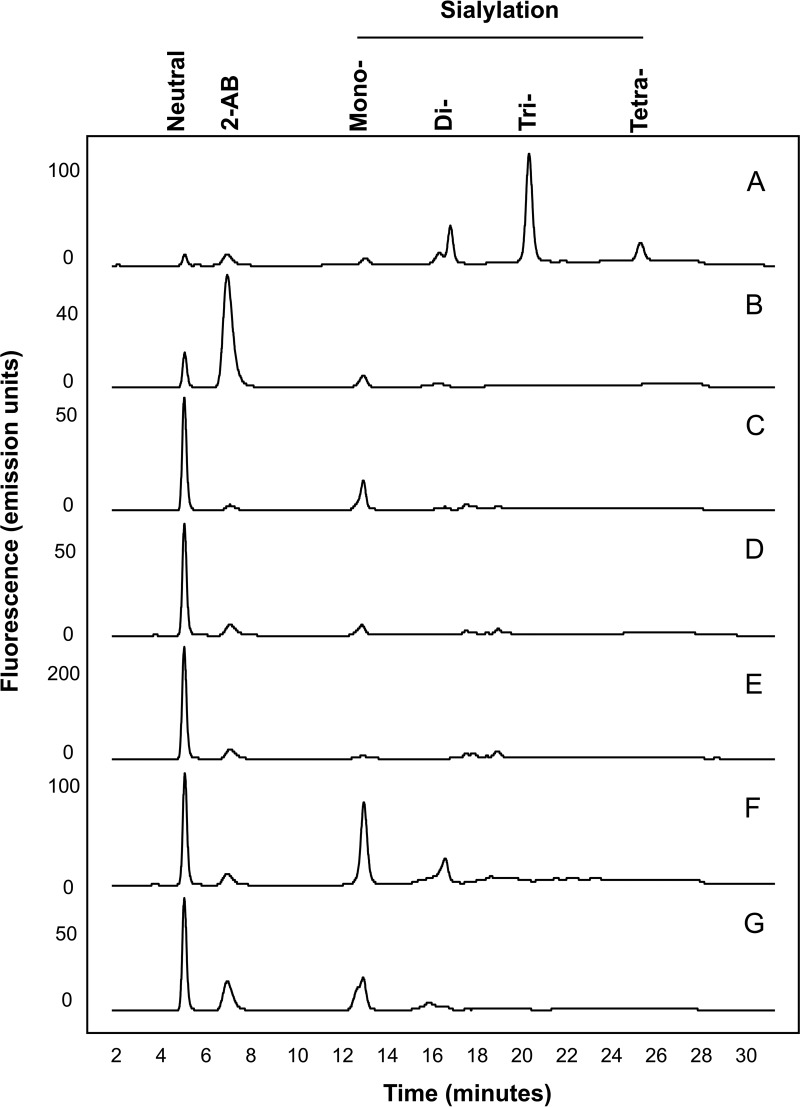
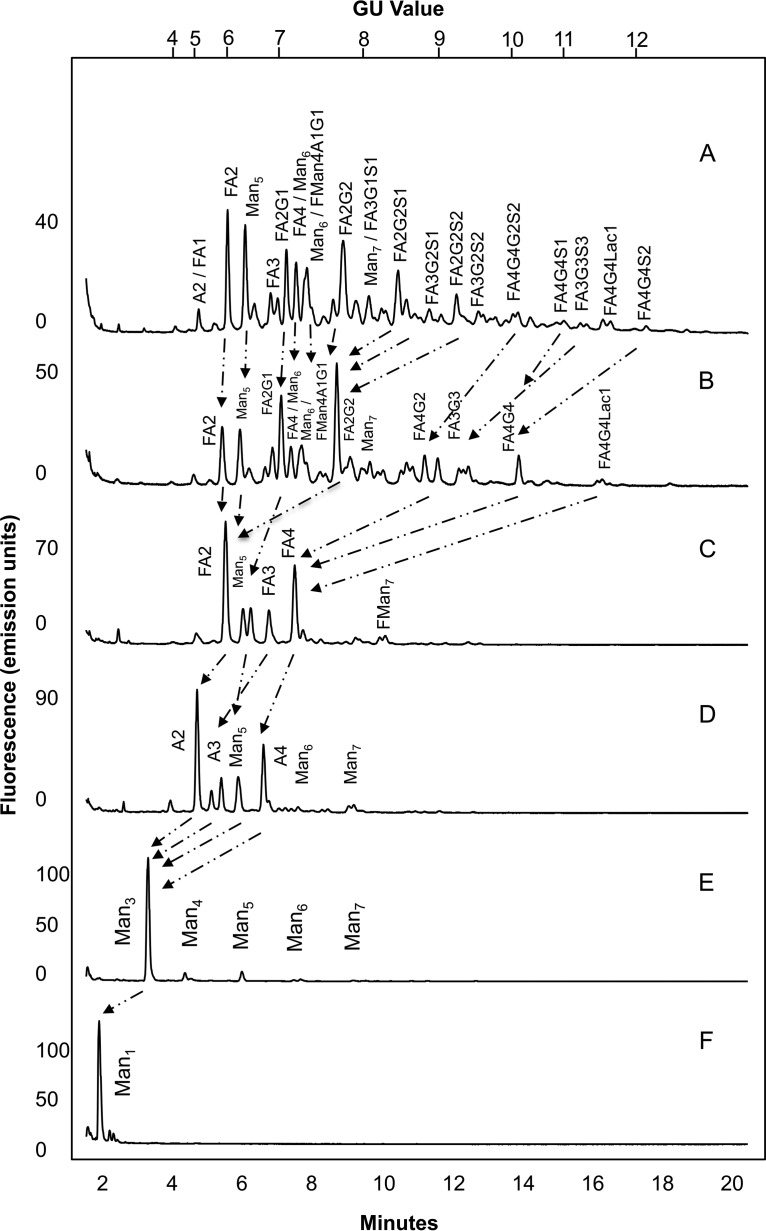
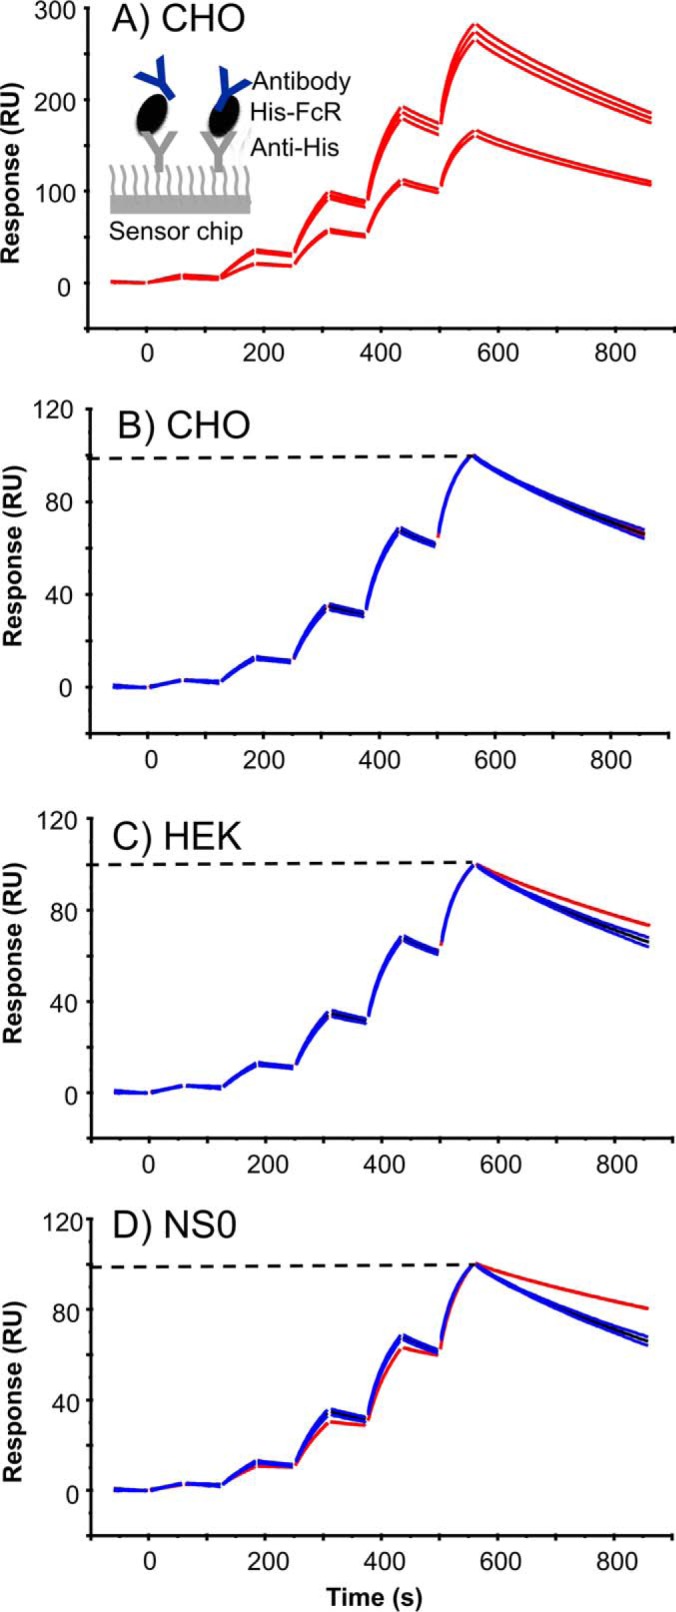
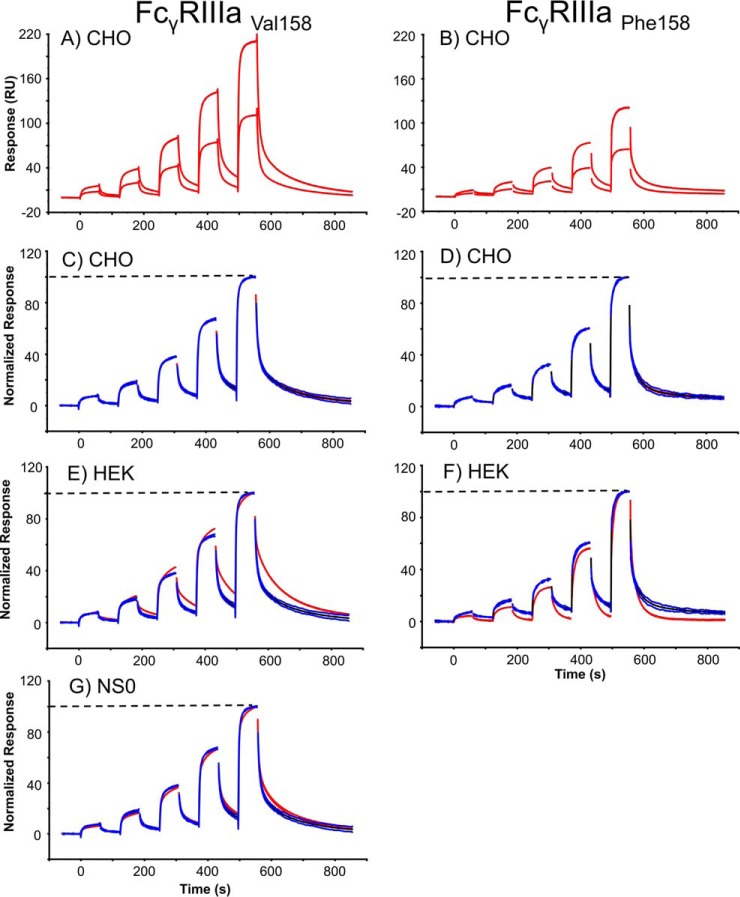
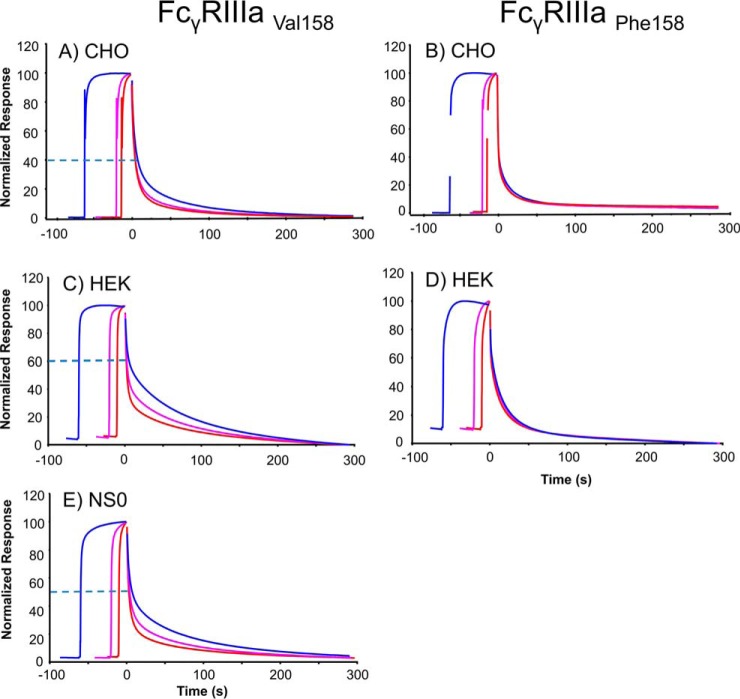
Fc gamma receptors (FcγR) bind the Fc region of antibodies and therefore play a prominent role in antibody-dependent cell-based immune responses such as ADCC, CDC and ADCP. The immune effector cell activity is directly linked to a productive molecular engagement of FcγRs where both the protein and glycan moiety of antibody and receptor can affect the interaction and in the present study we focus on the role of the FcγR glycans in this interaction. We provide a complete description of the glycan composition of Chinese hamster ovary (CHO) expressed human Fcγ receptors RI (CD64), RIIaArg131/His131 (CD32a), RIIb (CD32b) and RIIIaPhe158/Val158 (CD16a) and analyze the role of the glycans in the binding mechanism with IgG. The interactions of the monoclonal antibody rituximab with each FcγR were characterized and we discuss the CHO-FcγRIIIaPhe158/Val158 and CHO-FcγRI interactions and compare them to the equivalent interactions with human (HEK293) and murine (NS0) produced receptors. Our results reveal clear differences in the binding profiles of rituximab, which we attribute in each case to the differences in host cell-dependent FcγR glycosylation. The glycan profiles of CHO expressed FcγRI and FcγRIIIaPhe158/Val158 were compared with the glycan profiles of the receptors expressed in NS0 and HEK293 cells and we show that the glycan type and abundance differs significantly between the receptors and that these glycan differences lead to the observed differences in the respective FcγR binding patterns with rituximab. Oligomannose structures are prevalent on FcγRI from each source and likely contribute to the high affinity rituximab interaction through a stabilization effect. On FcγRI and FcγRIIIa large and sialylated glycans have a negative impact on rituximab binding, likely through destabilization of the interaction. In conclusion, the data show that the IgG1-FcγR binding kinetics differ depending on the glycosylation of the FcγR and further support a stabilizing role of FcγR glycans in the antibody binding interaction.


Conflict of interest statement

A.F., R.K., and C.A. are employees of GE Healthcare. S.M., M.P., and F.R. are employees of Boehringer Ingelheim

Figures

Fig. 1.
Fig. 1.
CHO expressed human FcγRs display complex and differential glycosylation. A, Glycan analysis of FcγRs expressed in CHO cells. Glycosylation of receptors was complex and differential with 30–40 unique glycan structures for each receptor. Following enzymatic release and HILIC UPLC analysis common structures (18) were identified and are indicated by dashed vertical lines. Numbered peaks represent the common glycan structures shown in Table I in red. GU values were assigned using internal 2-AB labeled dextran standards and integration using Waters Empower 3 software. Glycan structures and relative abundance for each receptor are shown in Table I. Glycan release and analysis experiments were performed in triplicate. B, FcγRs contain common N-glycans with differences in relative abundance. Average peak area percentages were calculated for peaks from individual receptors (FcγRI, FcγRIIaArg131, FcγRIIaHis131, FcγRIIb, FcγRIIIaPhe158, FcγRIIIaVal158). Eighteen common peaks were identified (see Fig. 1A) and values were plotted as the average GU value and average % area from three different releases of individual receptors. This value was then used to calculate the average value across the range of receptors for each peak to show the distribution in relative abundance between different receptors. Error bars represent the standard deviation for the relative % areas. Large error bars as seen for certain peaks e.g. GU 7.55 (FA2G2) signifying large differences in abundance for certain glycans between receptors. N-glycan structures corresponding to the GU values shown can be seen in red in Table I.
Fig. 2.
Fig. 2.
WAX HPLC analysis of FcγRs reveals charged glycan species and shows that glycans are mainly neutral and mono-sialylated. N-glycans of FcγRs are mainly neutral and mono-sialylated. Sialidase treatment followed by WAX analysis revealed that peaks are predominantly sialic acids. Bovine fetuin, which contains mono-, di-, tri-, and tetra-sialylated glycans was used as a standard to identify the sialylated species of FcγRs. FcγRIIIaPhe158 has the highest proportion of mono- and di-sialylated glycans, particularly in comparison to FcγRIIIaVal158. A, Bovine Fetuin; B, FcγRI; C, FcγRIIaArg131; D, FcγRIIaHis131; E, FcγRIIb; F, FcγRIIIaPhe158; G, FcγRIIIaVal158.
Fig. 3.
Fig. 3.
Exoglycosidase sequencing of the FcγR N-glycans was used to identify the monosaccharide compositions and linkage information. Arrows indicate the migrations of peaks following exoglycosidase digestion and HILIC UPLC analysis A. Undigested FcγRI glycan profile B. Arthrobacter ureafaciens sialidase (ABS) C. bovine testes β-galactosidase (BTG) D. bovine kidney α-fucosidase (BKF), E. jack bean β-N-acetylhexosaminidase (JBH), F. jack bean α-mannosidase (JBM). Peaks migrate to Man1 structures following digestion. Exoglycosidase sequencing was performed for each FcγR. The exoglycosidase panel digest for FcγRI is shown. See Supplementary Figs. for the Exoglycosidase panel digests for FcγRI, FcγRIIaArg131, FcγRIIaHis 131, FcγRIIIaPhe 158, FcγRIIIaVal158.
Fig. 4.
Fig. 4.
Rituximab binding kinetics depends on the source and glycosylation of FcγRI. Rituximab binding to FcγRI from CHO, HEK293 and NS0 cells is compared; using CHO expressed receptor as the standard. A, Experimental variation (n = 5) of rituximab (1.2, 4.7, 18.8, 75, and 300 nm) binding to two different levels of captured CHO-FcγRI (110 and 210 RU). B, Rituximab-CHO-FcγRI normalized data, used as standard. C, Rituximab-HEK-FcγRI binding (red) compared with the CHO standard. D, Rituximab-NS0-FcγRI binding (red) compared with the CHO standard. The dashed line indicates that the binding data is normalized between 0 and 100. Experimental data is shown in red, the average curve of the CHO-FcγRI standard is shown in black and the average curve standard deviation limits are shown in blue.
Fig. 5.
Fig. 5.
Rituximab binding kinetics depends on the source and glycosylation of FcγRIIIa and the polymorphic receptor variant. Comparison of rituximab binding to FcγRIIIaVal 158/Phe158, produced in CHO, HEK293 and NS0 cells, using the CHO receptors as the standard. A and B, Experimental variation (n = 5) of rituximab (24.7, 74, 222, 667, and 2000 nm) binding to two different levels (90 and 170 RU) of captured FcγRIIIa for the Phe 158 and Val 158 polymorphic variants. C and D, Rituximab-CHO-FcγRIIIa normalized data, used as the standard. E and F, Rituximab-HEK293-FcγRIIIa binding (red) compared with the CHO FcγRIIIa standards. G, Rituximab-NS0-FcγRIIIa binding (red) compared with the CHO FcγRIIIa standards. The dashed line indicates that the binding data is normalized between 0 and 100. Experimental data is shown in red, the average curve of the CHO FcγRIIIa standard is shown in black and the average curve standard deviation limits are shown in blue.
Fig. 6.
Fig. 6.
Rituximab FcγRIIIa dissociation rates depend on the interaction time and FcγR variant at saturating conditions. Saturating concentration (6 μm) of rituximab was injected over a sensor chip with ∼100 RU captured FcγRs of different types: A and B, CHO-FcγRIIIa, C and D, HEK293-FcγRIIIa. E, NS0-FcγRIIIa. Injections were performed for 10 s (red curve), 20 s (magenta curve), and 60 s (blue curve) in separate cycles ensuring that saturating levels (∼200 RU for Val 158 and 140 RU for Phe 158) were obtained for all injection times. Curves were overlaid and responses normalized between 0 and 100 and aligned at the end of the injections (time = 0). Dissociation rates were visually compared. Dashed lines indicate the level where the slower dissociation of the 60 s injection visually starts, the higher the dashed line then the larger the time effect and slower dissociation.

References

    1. Daeron M. (1997) Fc receptor biology. Annu. Rev. Immunol. 15, 203–234 - PubMed
    1. Nimmerjahn F., and Ravetch J. V. (2008) Fcgamma receptors as regulators of immune responses. Nat. Rev. Immunol. 8, 34–47 - PubMed
    1. Ravetch J. V., and Perussia B. (1989) Alternative membrane forms of Fc gamma RIII(CD16) on human natural killer cells and neutrophils. Cell type-specific expression of two genes that differ in single nucleotide substitutions. J. Exp. Med. 170, 481–497 - PMC - PubMed
    1. Koene H. R., Kleijer M., Algra J., Roos D., von dem Borne A. E., and de Haas M. (1997) Fc gammaRIIIa-158V/F polymorphism influences the binding of IgG by natural killer cell Fc gammaRIIIa, independently of the Fc gammaRIIIa-48L/R/H phenotype. Blood 90, 1109–1114 - PubMed
    1. de Haas M., Koene H. R., Kleijer M., de Vries E., Simsek S., van Tol M. J., Roos D., and von dem Borne A. E. (1996) A triallelic Fc gamma receptor type IIIA polymorphism influences the binding of human IgG by NK cell Fc gamma RIIIa. J. Immunol. 156, 2948–2955 - PubMed

Publication types