. 2017 Aug 3;130(5):655-665.
doi: 10.1182/blood-2016-10-745588. Epub 2017 Jun 2.

Targeting chronic myeloid leukemia stem cells with the hypoxia-inducible factor inhibitor acriflavine

Affiliations

Targeting chronic myeloid leukemia stem cells with the hypoxia-inducible factor inhibitor acriflavine

Giulia Cheloni et al. Blood. .

Abstract

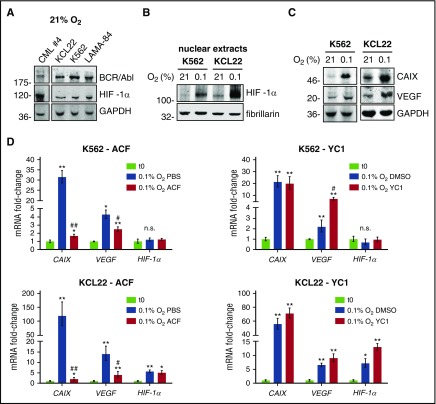
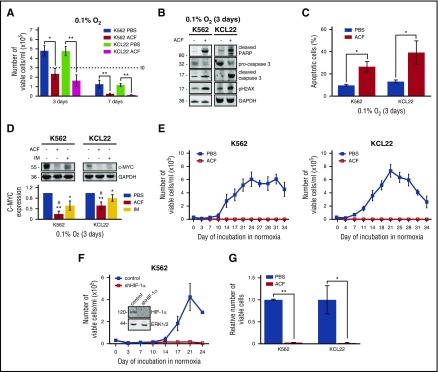
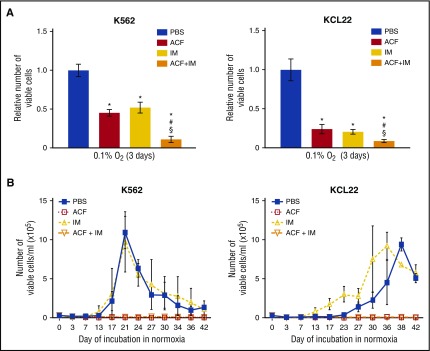
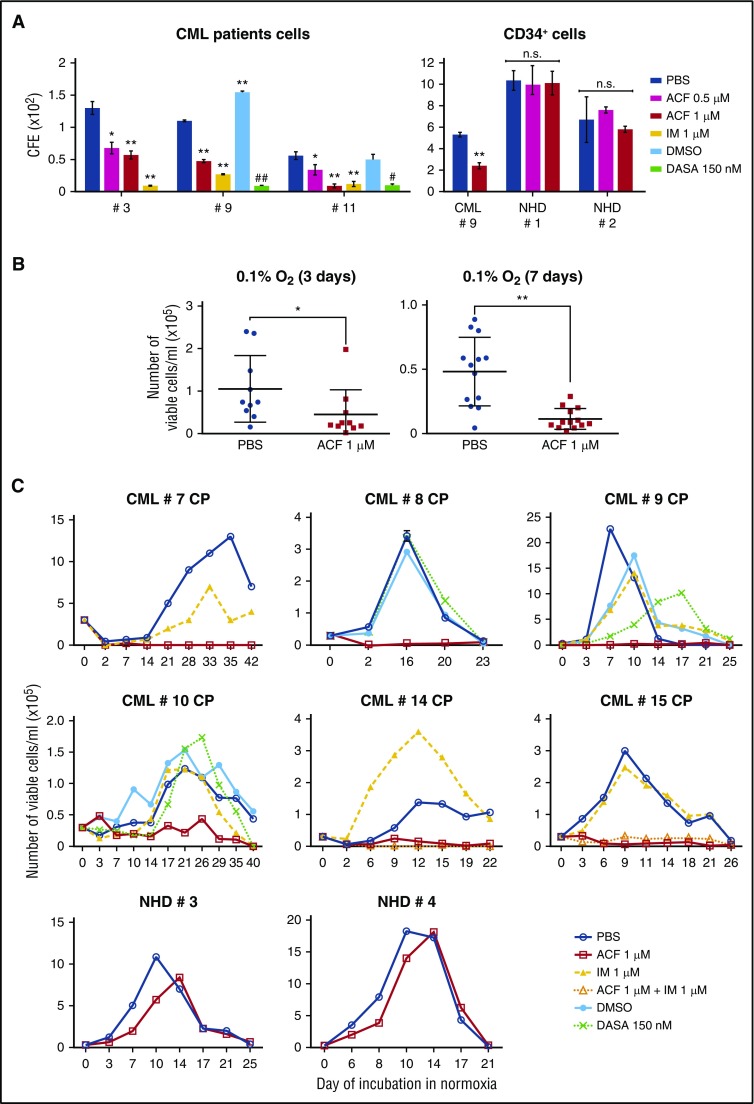
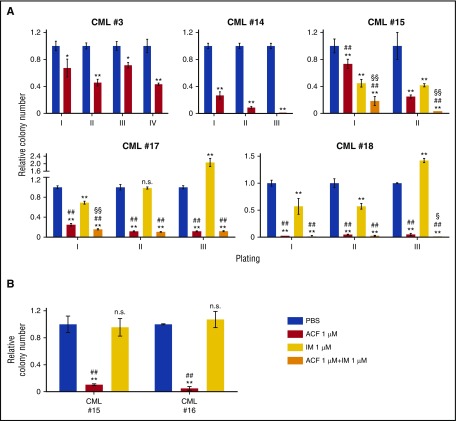
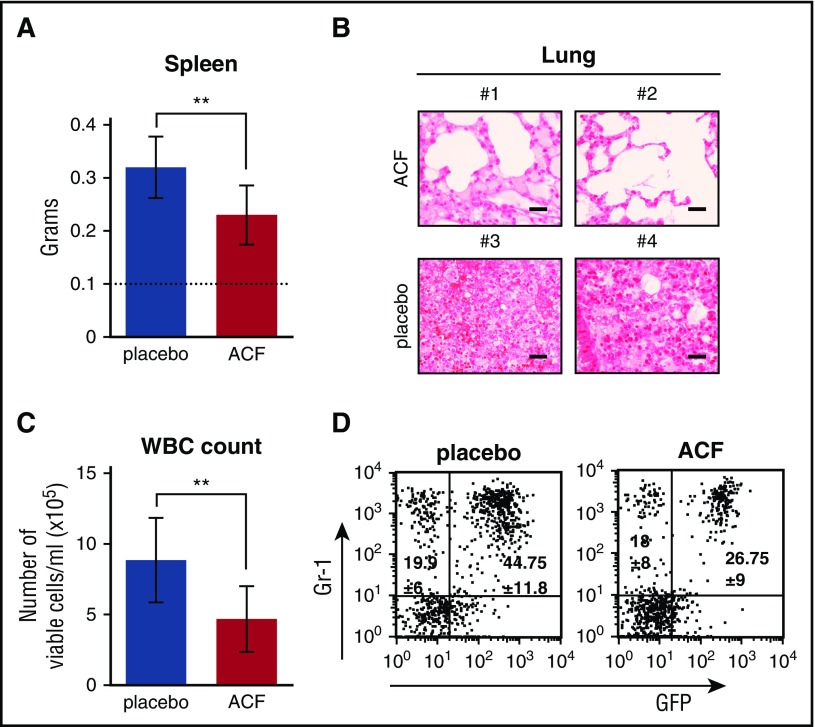
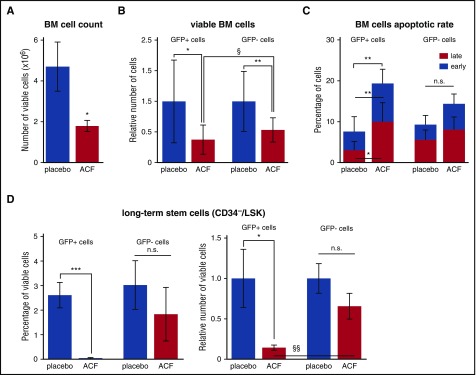
Chronic myeloid leukemia (CML) is a hematopoietic stem cell (HSC)-driven neoplasia characterized by expression of the constitutively active tyrosine kinase BCR/Abl. CML therapy based on tyrosine kinase inhibitors (TKIs) is highly effective in inducing remission but not in targeting leukemia stem cells (LSCs), which sustain minimal residual disease and are responsible for CML relapse following discontinuation of treatment. The identification of molecules capable of targeting LSCs appears therefore of primary importance to aim at CML eradication. LSCs home in bone marrow areas at low oxygen tension, where HSCs are physiologically hosted. This study addresses the effects of pharmacological inhibition of hypoxia-inducible factor-1 (HIF-1), a critical regulator of LSC survival, on the maintenance of CML stem cell potential. We found that the HIF-1 inhibitor acriflavine (ACF) decreased survival and growth of CML cells. These effects were paralleled by decreased expression of c-Myc and stemness-related genes. Using different in vitro stem cell assays, we showed that ACF, but not TKIs, targets the stem cell potential of CML cells, including primary cells explanted from 12 CML patients. Moreover, in a murine CML model, ACF decreased leukemia development and reduced LSC maintenance. Importantly, ACF exhibited significantly less-severe effects on non-CML hematopoietic cells in vitro and in vivo. Thus, we propose ACF, a US Food and Drug Administration (FDA)-approved drug for nononcological use in humans, as a novel therapeutic approach to prevent CML relapse and, in combination with TKIs, enhance induction of remission.


Conflict of interest statement

Conflict-of-interest disclosure: The authors declare no competing financial interests.

Figures

Figure 1.
Figure 1.
HIF-1α was expressed in CML cells and ACF inhibited the increase of HIF-1α target genes in low oxygen. (A) Primary (CML case 4) or CML cell lines were lysed and total cell lysates subjected to immunoblotting with the indicated antibodies. Glyceraldehyde-3-phosphate dehydrogenase (GAPDH) expression was used as a loading control. Migration of molecular weight markers is indicated on the left (in kilodaltons). One representative experiment of 3 is shown. (B-C) Cells were incubated at the indicated oxygen concentrations for 3 days. (B) Nuclear lysates were subjected to immunoblotting with the indicated antibodies. Fibrillarin was used to verify the equalization of protein loading. Migration of molecular weight markers is indicated on the left (in kilodaltons). One representative experiment of 3 is shown. (C) Total cell lysates were subjected to immunoblotting with the indicated antibodies. GAPDH was used to verify equalization of protein loading. Migration of molecular weight markers is indicated on the left (in kilodaltons). One representative experiment of 3 is shown. (D) Cells were incubated for 2 days at 0.1% O2, in the presence of 5 µM ACF or 50 µM YC1, or their solvents (PBS or DMSO, respectively). CAIX, VEGF, or HIF-1α mRNA were measured by q-PCR. Data were normalized with respect to β-actin and expressed as fold-change with respect to the values obtained for time 0 (t0) cells. Values represent mean ± standard deviation (S.D.) of 3 independent experiments, each carried out in triplicate; vs t0: *P ≤ .05, **P ≤ .01; vs control (PBS or DMSO) 0.1% O2: #P ≤ .05, ##P ≤ .01; either comparison: n.s., not significant.
Figure 2.
Figure 2.
ACF induced apoptosis and suppressed c-Myc expression and stem cell potential in CML cells. Cells were treated with PBS or 5 µM ACF or 1 µM IM and incubated at 0.1% O2 for the indicated times (primary culture; LC1). (A) Viable cells were counted at the indicated times of LC1. Dashed line indicates the number of plated cells. Values represent mean ± S.D. of data obtained from 3 independent experiments, each carried out in triplicate; *P ≤ .05, **P ≤ .01. (B) Total cell lysates were subjected to immunoblotting with the indicated antibodies. GAPDH was used to verify equalization of protein loading. Migration of molecular weight markers is indicated on the left (in kilodaltons). One representative experiment of 3 is shown. (C) Cells were stained with annexin V–APC and analyzed by flow cytometry. Values represent mean ± S.D. of data obtained from 3 independent experiments, each carried out in triplicate; *P ≤ .05. (D) Total cell lysates were subjected to immunoblotting with the indicated antibodies. GAPDH was used to verify equalization of protein loading. Migration of molecular weight markers is indicated on the left (in kilodaltons). One representative experiment and densitometric analysis of data from 4 independent experiments are shown; values represent mean ± S.D.; vs PBS: *P ≤ .05, **P ≤ .01; vs IM: #P ≤ .05. (E) Cells were transferred from day 7 LC1 to drug-free normoxic secondary cultures (LC2) to determine the maintenance of stem cell potential in LC1 via the counting of viable cells at the indicated times of incubation in LC2. Values represent mean ± S.D. of 3 independent experiments. (F) K562 cells stably transfected with shRNA against HIF-1α (shHIF-1α) or control shRNA were incubated in low-oxygen LC1 for 7 days and then transferred to normoxic LC2, to count viable cells at the indicated times of incubation in LC2. Values represent mean ± S.D. of 3 independent experiments. (F, inset) Cells from time 0 LC1 were lysed and subjected to immunoblotting with the indicated antibodies. ERK1/2 was used to verify equalization of protein loading. Migration of molecular weight markers is indicated on the left (in kilodaltons). (G) Cells were treated with PBS or 5 µM ACF from day 6 to day 9 of incubation in low-oxygen LC1 and then transferred to drug-free normoxic LC2 to count viable cells. Data, relative to the peak of LC2 repopulation (day 21), are expressed as fraction of the value obtained for PBS. Values represent mean ± S.D. of data obtained from 4 independent experiments; *P ≤ .05, **P ≤ .01.
Figure 3.
Figure 3.
IM did not interfere with the ACF-driven suppression of stem cell potential. Cells were treated with PBS or 5 µM ACF or 1 µM IM, alone or in combination (ACF+IM), and incubated at 0.1% O2 (LC1). (A) Viable cells were counted at day 3 of LC1. Data are expressed as fraction of the value obtained for PBS. Values represent mean ± S.D. of data obtained from 3 independent experiments; vs PBS: *P ≤ .01; vs ACF: #P ≤ .05; vs IM: §P ≤ .05. (B) Cells were transferred from day 7 LC1 to drug-free normoxic secondary cultures (LC2), to determine the maintenance of stem cell potential in LC1 via the counting of viable cells at the indicated times of incubation in LC2. Values represent mean ± S.D. of data obtained from 3 independent experiments.
Figure 4.
Figure 4.
ACF impaired stem cell potential and reduced colony formation ability of primary CML cells, but not normal cells. (A) Total (left) or CD34+ (right) light-density BMMCs from CML patients or CD34+ light-density PBMCs from NHDs (right) were plated in methylcellulose-containing medium and treated as indicated from time 0 of incubation (PBS, vehicle for ACF or IM; DMSO, vehicle for DASA). Colony number was scored after 7 days. Values represent mean ± S.D. of data obtained from experiments performed in duplicate; vs PBS: *P ≤ .05, **P ≤ .01; vs DMSO: #P ≤ .05, ##P ≤ .01. (B-C) Light-density BMMCs from CML patients or light-density PBMCs from NHDs were treated as indicated (PBS, vehicle for ACF or IM; DMSO, vehicle for DASA) and incubated at 0.1% O2 (LC1). (B) Viable cells from CML patients were counted at day 3 (n = 10) or day 7 (n = 12) of incubation at 0.1%O2 (LC1). Values represent mean ± S.D.; *P ≤ .05, **P ≤ .01. (C) Cells were transferred from day 7 LC1 to drug-free normoxic LC2 to determine the maintenance of stem cell potential in LC1 via the counting of viable cells at the indicated times of incubation in LC2. Values represent results from single experiments or mean ± S.D. of data obtained in triplicate (CML #8).
Figure 5.
Figure 5.
ACF impaired serial colony formation and long-term culture-initiation abilities of primary CML cells. (A) Light-density BMMCs from CML patients were plated in methylcellulose-containing medium (I) and treated as indicated from time 0 of incubation (PBS, vehicle for ACF or IM). After 7 to 14 days, colony number was scored and cells replated in secondary, tertiary, or quaternary cultures (II, III, IV). Data are expressed as a fraction of the value obtained for PBS-treated cultures. Values represent mean ± S.D. of data obtained from experiments performed in duplicate; vs PBS: *P ≤ .05, **P ≤ .01; vs IM: #P ≤ .05, ##P ≤ .01; vs ACF: §P ≤ .05, §§P ≤ .01. (B) Light-density BMMCs from CML patients were treated as indicated, incubated at 0.1% O2 for 2 days and transferred to drug-free liquid cultures incubated at 21% O2. After 5 weeks, cells were replated in methylcellulose-containing medium and colony number was scored after 14 days. Data are expressed as fraction of the value obtained for PBS-treated cultures. Values represent mean ± S.D. of data obtained from experiments performed in duplicate; vs PBS: **P ≤ .01; ACF vs IM: ##P ≤ .01.
Figure 6.
Figure 6.
ACF reduced CML development in vivo. CML mice were treated daily for 10 days with ACF or placebo and euthanized after 1 additional day. (A) Spleen weight; dotted line: non-CML mice. Data are mean ± S.D. of 8 mice per experimental variant; **P ≤ .01. (B) Hematoxylin-stained lung sections (original magnification ×40) from 2 representative mice per experimental variant (scale bar, 25 µm). (C) Total PB WBCs. Data are mean ± S.D. from 8 mice per experimental variant; **P ≤ .01. (D) Percentage of GFP+ (leukemic) or GFP (nonleukemic) myeloid cells (Gr-1+) in PB. Plots show data from 1 representative mouse per experimental variant. Means ± S.D. from 8 mice per experimental variant are reported inside the plots.
Figure 7.
Figure 7.
ACF reduced CML development and decreased the number of long-term LSCs in vivo. CML mice were treated daily for 10 days with ACF or placebo and euthanized after 1 additional day. (A) Number of BM viable cells. (B) Relative number of GFP+ (leukemic) or GFP (nonleukemic) cells in BM; data are expressed as fraction of the value obtained for placebo. (C) Apoptotic rate of GFP+ or GFP BM cells. (D) Percentage (left) and relative number (right) of GFP+ or GFP/LT-LSK cells in BM; data are expressed as fraction of the value obtained for placebo. (A-D) Values represent mean ± S.D. of data from 8 mice per experimental variant. ACF- vs PBS-treated mice: *P ≤ .05, **P ≤ .01, ***P ≤ .001; ACF-treated mice, GFP vs GFP+ cells: §P ≤ .05, §§P ≤ .01.

Similar articles

Cited by

References

    1. Druker BJ, Sawyers CL, Kantarjian H, et al. . Activity of a specific inhibitor of the BCR-ABL tyrosine kinase in the blast crisis of chronic myeloid leukemia and acute lymphoblastic leukemia with the Philadelphia chromosome. N Engl J Med. 2001;344(14):1038-1042. - PubMed
    1. Graham SM, Jørgensen HG, Allan E, et al. . Primitive, quiescent, Philadelphia-positive stem cells from patients with chronic myeloid leukemia are insensitive to STI571 in vitro. Blood. 2002;99(1):319-325. - PubMed
    1. Hu Y, Swerdlow S, Duffy TM, Weinmann R, Lee FY, Li S. Targeting multiple kinase pathways in leukemic progenitors and stem cells is essential for improved treatment of Ph+ leukemia in mice. Proc Natl Acad Sci USA. 2006;103(45):16870-16875. - PMC - PubMed
    1. Giuntoli S, Rovida E, Barbetti V, Cipolleschi MG, Olivotto M, Dello Sbarba P. Hypoxia suppresses BCR/Abl and selects imatinib-insensitive progenitors within clonal CML populations. Leukemia. 2006;20(7):1291-1293. - PubMed
    1. Giuntoli S, Tanturli M, Di Gesualdo F, Barbetti V, Rovida E, Dello Sbarba P. Glucose availability in hypoxia regulates the selection of chronic myeloid leukemia progenitor subsets with different resistance to imatinib-mesylate. Haematologica. 2011;96(2):204-212. - PMC - PubMed

Publication types

MeSH terms