. 2017 Jun 20;114(25):E4914-E4923.
doi: 10.1073/pnas.1704553114. Epub 2017 Jun 2.

Modeling gene regulation from paired expression and chromatin accessibility data

Affiliations

Modeling gene regulation from paired expression and chromatin accessibility data

Zhana Duren et al. Proc Natl Acad Sci U S A. .

Abstract

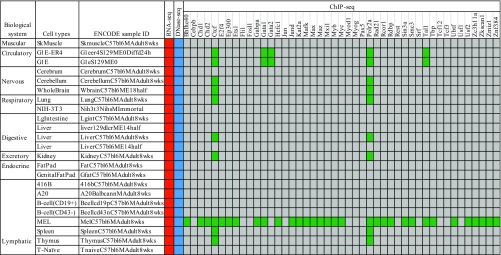
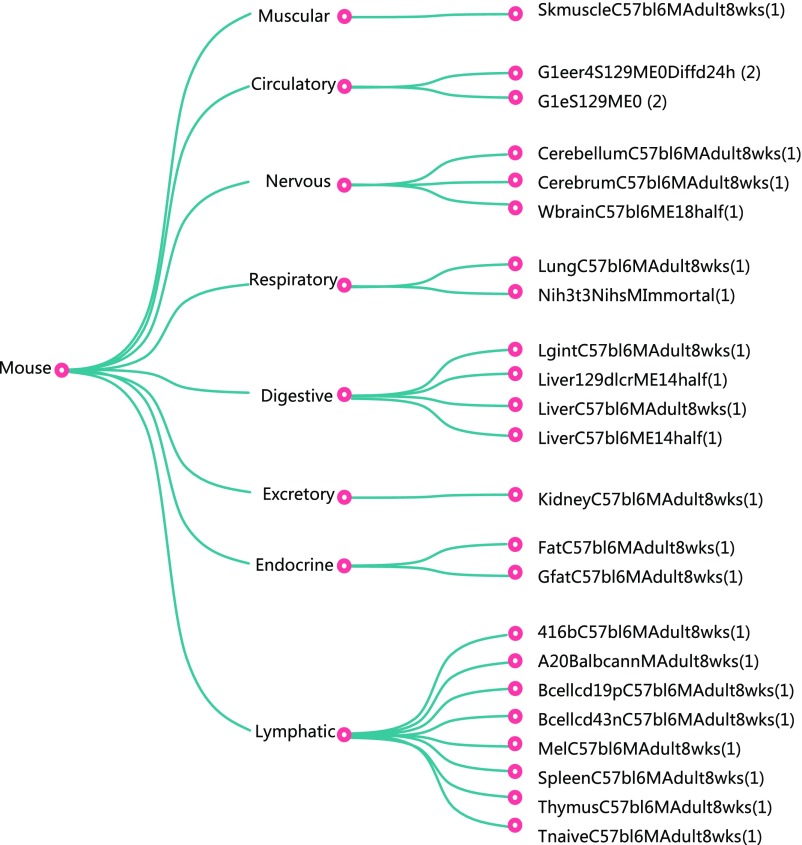
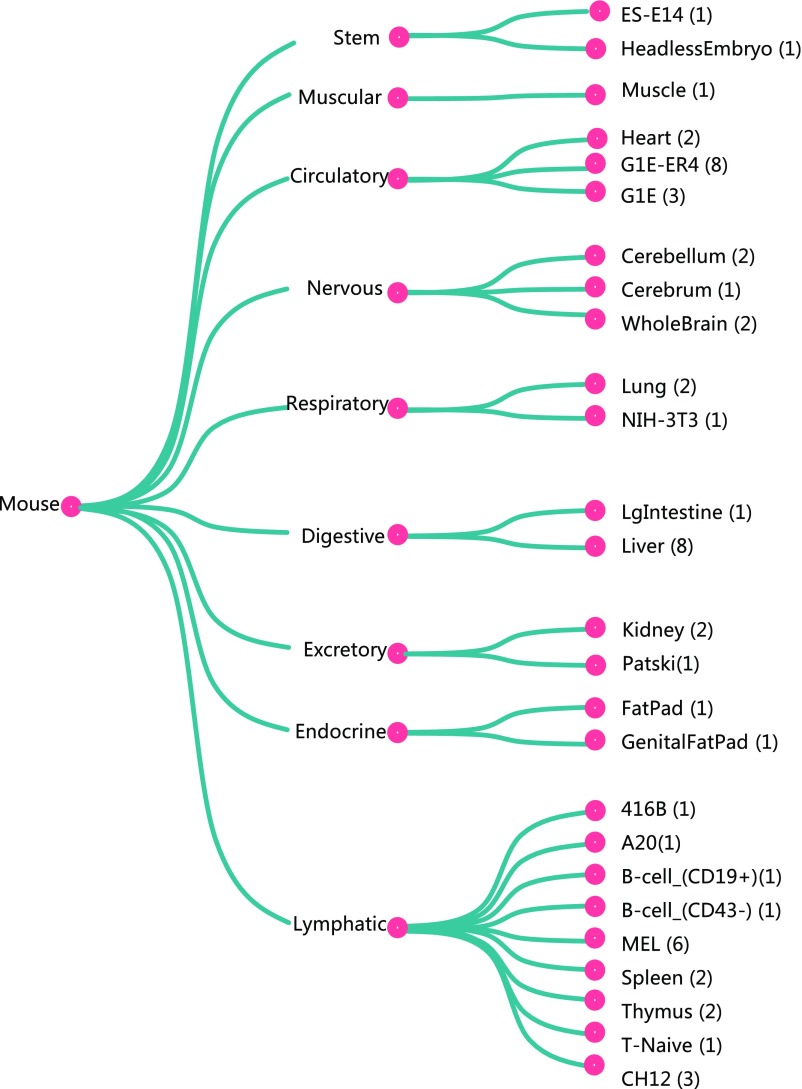
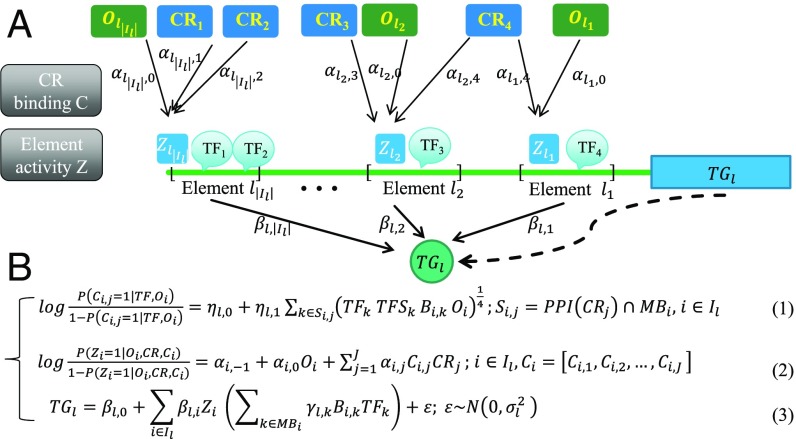
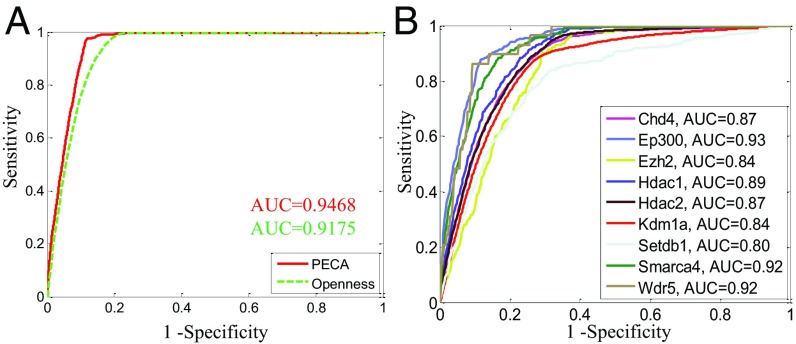
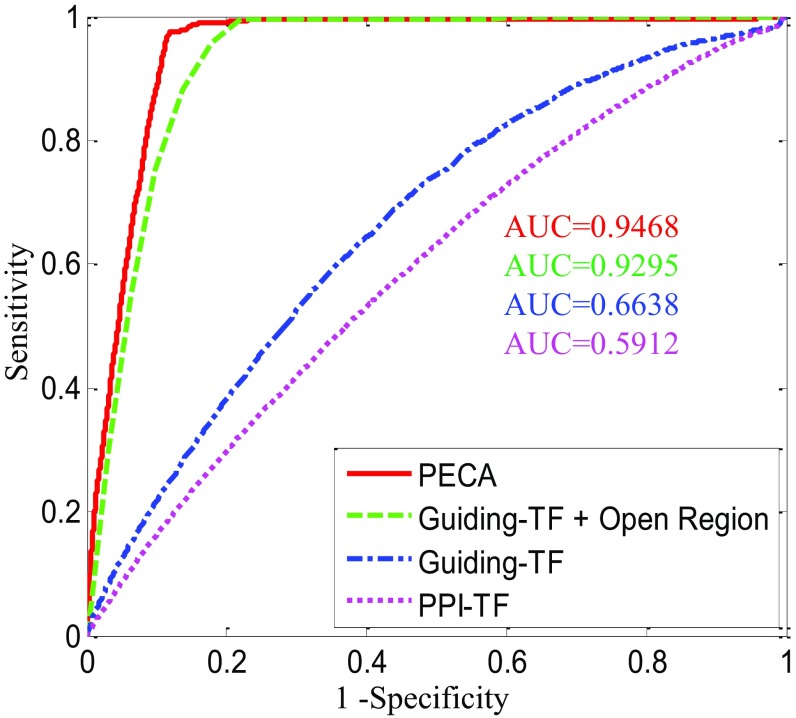
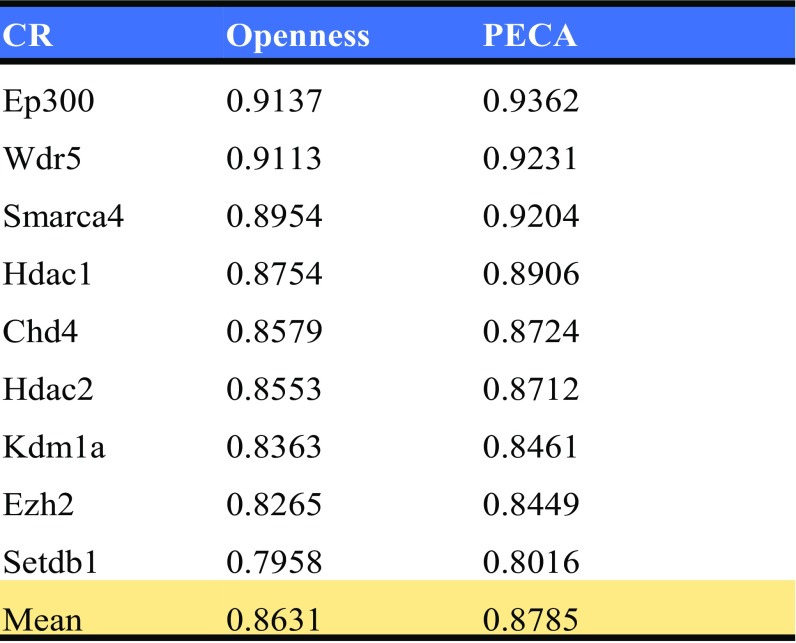
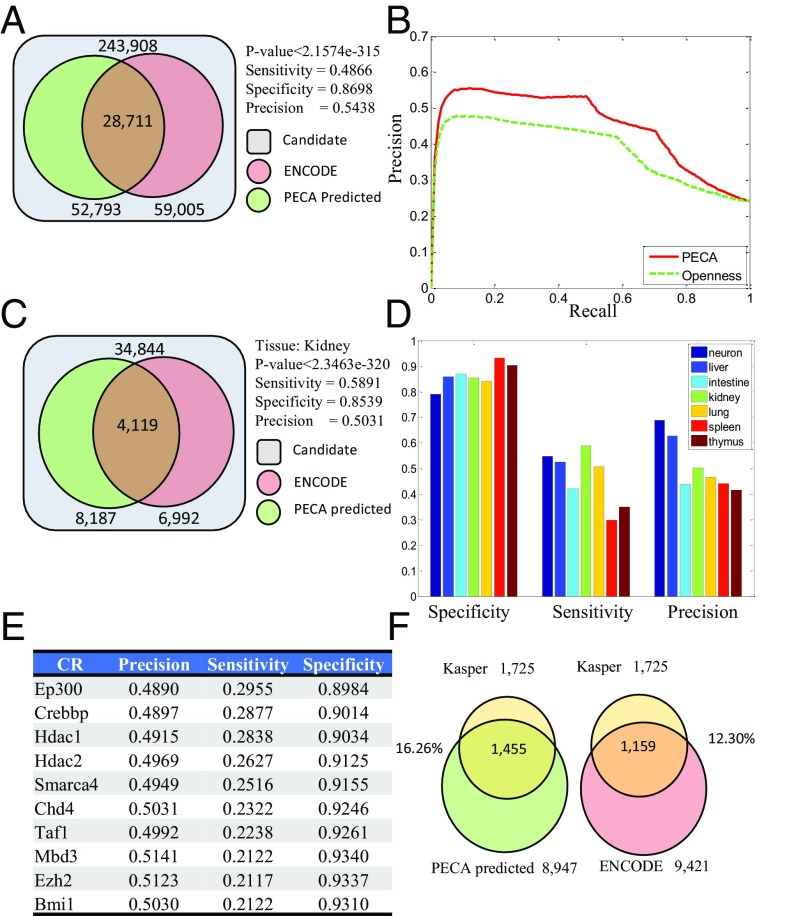
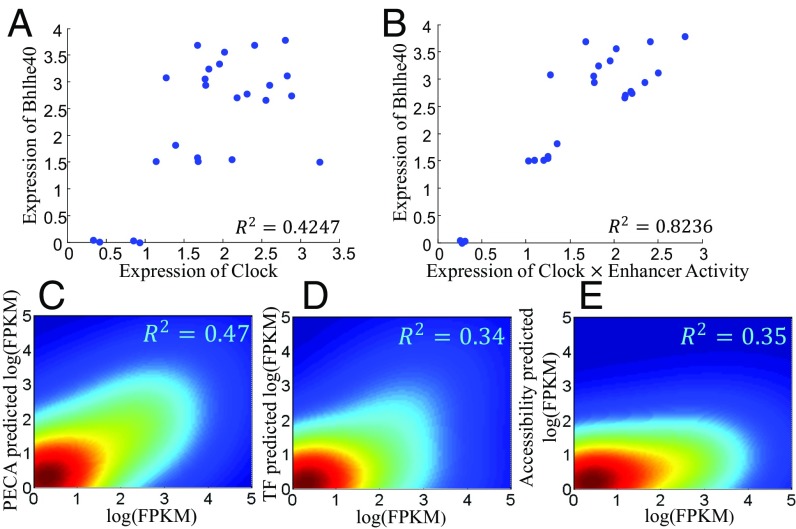
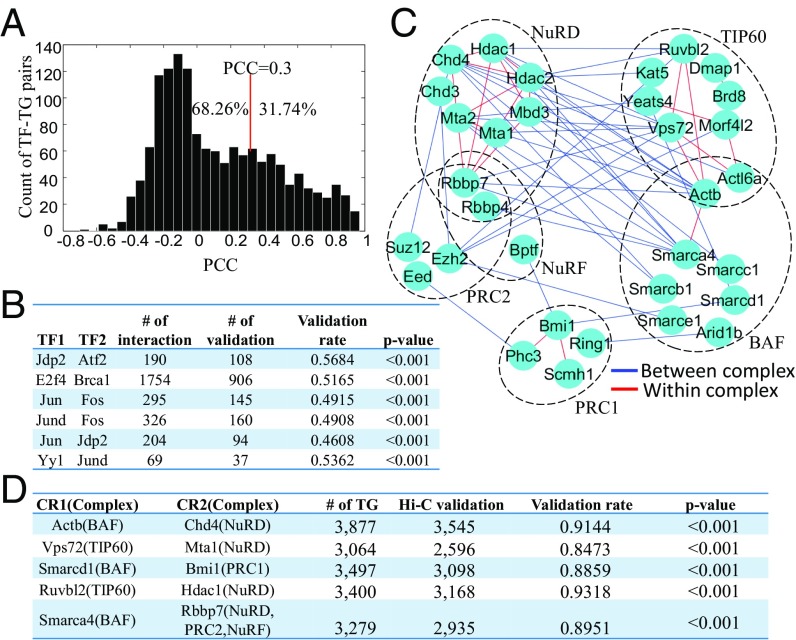
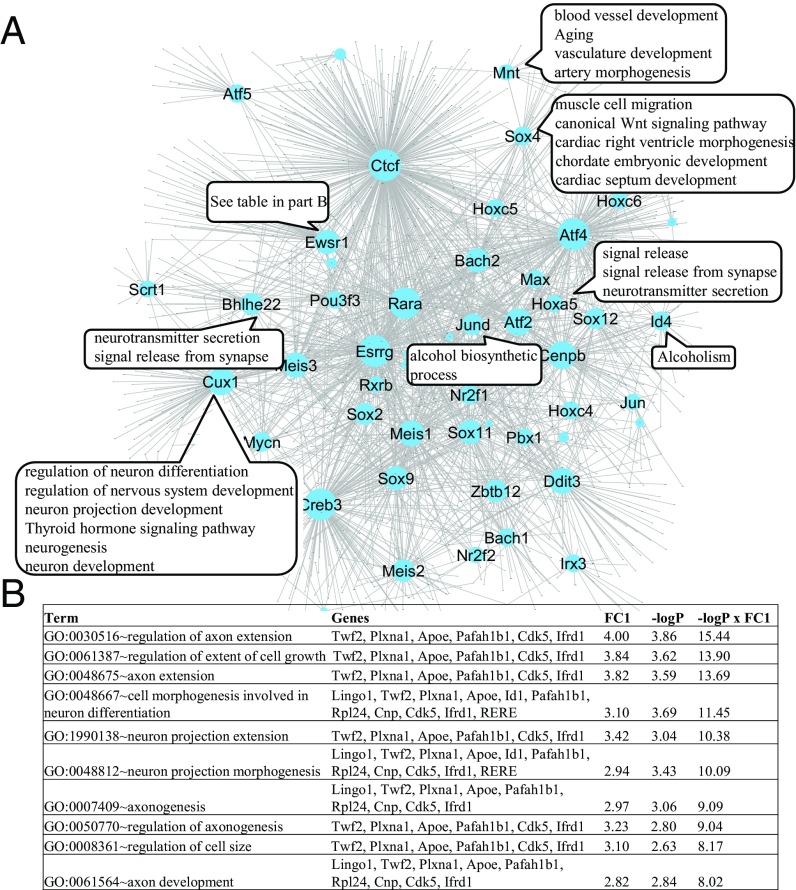
The rapid increase of genome-wide datasets on gene expression, chromatin states, and transcription factor (TF) binding locations offers an exciting opportunity to interpret the information encoded in genomes and epigenomes. This task can be challenging as it requires joint modeling of context-specific activation of cis-regulatory elements (REs) and the effects on transcription of associated regulatory factors. To meet this challenge, we propose a statistical approach based on paired expression and chromatin accessibility (PECA) data across diverse cellular contexts. In our approach, we model (i) the localization to REs of chromatin regulators (CRs) based on their interaction with sequence-specific TFs, (ii) the activation of REs due to CRs that are localized to them, and (iii) the effect of TFs bound to activated REs on the transcription of target genes (TGs). The transcriptional regulatory network inferred by PECA provides a detailed view of how trans- and cis-regulatory elements work together to affect gene expression in a context-specific manner. We illustrate the feasibility of this approach by analyzing paired expression and accessibility data from the mouse Encyclopedia of DNA Elements (ENCODE) and explore various applications of the resulting model.

Keywords: chromatin activity; chromatin regulator; gene regulation; regulatory element; transcription factor.


Conflict of interest statement

The authors declare no conflict of interest.

Figures

Fig. 1.
Fig. 1.
Genome-wide data for gene-regulatory inference. Each row represents a particular cellular context under which multiple types of genome-wide data may be available. In this paper we illustrate our method by analyzing data from 25 contexts studied in the mouse ENCODE project covering a variety of mouse cell types and developmental stages. Expression data (from RNA-seq, red boxes) and chromatin accessibility data (from DNase-seq or ATAC-seq, blue boxes) are available for each context, but most of the location data (from ChIP-seq data, green boxes) for transcriptional regulators are missing. We expect that the number of contexts (i.e., number of rows) with expression and accessibility data will increase rapidly in the future, but corresponding location data will be sparse; i.e., gray boxes indicating missing data will remain numerous as the number of rows in the table grows.
Fig. S1.
Fig. S1.
The 25 ENCODE samples with matched RNA-seq and DNase-seq data at bio-sample level. These matched samples are used in PECA model training. More detailed information on these samples is in Dataset S5.
Fig. S2.
Fig. S2.
The 56 ENCODE samples with matched RNA-seq and DNase-seq data at cell-type level. These matched samples are used in out-sample gene expression prediction in RA-induced mESC differentiation data. More detailed information of these samples is in Dataset S5.
Fig. 2.
Fig. 2.
Schematic overview of PECA model. (A) PECA is a model for transcriptional regulation that integrates matched gene expression and chromatin accessibility data with well-defined cis-REs (promoter of lth TG is denoted as element l1 and enhancers are denoted as elements l2, l3,, etc. The set of REs associated with the lth TG is denoted as Il = {l1,l2,}). The input of PECA includes the expression of TF genes, CR genes, and TGs; the openness of Res; the motif binding in the elements for TFs, and protein–protein interactions (PPI) among CRs and TFs. (B) The three components of PECA are described in Eqs. 13 (Table 1 for definitions of notations): (i) CR localization prediction in Eq. 1 models how a CR is recruited to a RE by its interacting sequence-specific TFs. C (Ci,j = 0,1) is introduced as a hidden variable to indicate whether the jth CR has been recruited to the ith RE. (ii) RE activity prediction in Eq. 2 models how the activation status of a RE is modulated by the expressions of recruited CRs and the RE’s openness. Z (Zi = 0, 1) is introduced as a hidden variable to denote the activity of the ith RE. (iii) TG expression prediction in Eq. 3 models how the activities of REs and the expressions of binding TFs together explain TG expression. Based on this model and the observed expression and accessibility data, we can estimate the model parameters and the hidden variables (C, Z).
Fig. 3.
Fig. 3.
PECA accurately predicts CR binding/recruitment status. (A) Comparison of PECA-based prediction of Ep300 binding status on MEL with accessibility-based prediction. (B) ROC curves of PECA prediction of binding status for nine CRs on mESC.
Fig. S3.
Fig. S3.
PECA outperforms three alternative methods, PPI-TF motif occurrence, guiding-TF motif occurrence, and combination of guiding TFs with open regions, in predicting Ep300 binding sites in MEL. In total there are 419,299 candidate cis-REs and 18,998 ChIP-seq peaks as a gold standard in MEL. Given a CR and tissue context, guiding TFs are defined as TFs that satisfy the following three conditions: (i) interact with the CR in a protein–protein interaction network, (ii) are dynamically expressed across tissues, and (iii) are highly expressed in a given tissue. For PPI-TF and guiding-TF motif occurrence, the motif binding strength on element (jlog(Pvaluej)) is used as the prediction score. In a combination of guiding-TF motif occurrence with the open region, the product of the overlapping fraction with the open region and motif binding strength are the prediction scores for the elements. PECA uses the posterior probability of CR binding (Ci,j) to score the elements. We slide these scores and plot the ROC curves and the y axis is sensitivity and the x axis is 1 − specificity. The ROC curves show that the open region can dramatically improve the AUC and PECA reaches the highest AUC at 0.9465.
Fig. S4.
Fig. S4.
Comparison of PECA-based prediction of AUC of nine CRs binding status on mESC with accessibility-based prediction.
Fig. 4.
Fig. 4.
PECA accurately predicts the activation status of REs. (A) Significant overlap of PECA predicted enhancer with ENCODE enhancers (P value <2.1574e-315). We examine the activation status of 34,844 enhancers in seven tissues (see text for criteria for choice of tissues and enhancers). The activation status of these enhancers has been annotated by ENCODE based on ChIP-seq data. In total we need to predict a binary matrix of size 34,844 × 7 = 243,908. (B) Precision-recall curve of PECA-based prediction using ENCODE annotation as gold standard. (C) Significant overlap of PECA predicted active enhancers with ENCODE active enhancers in kidney (P value <2.3463e-320). (D) Performance of enhancer activity prediction by PECA in each of seven tissues, using ENCODE enhancers as gold standard positives. (E) List of CRs with high predictive power. The results are based on the contribution of each CR in predicting enhancer activity, using ENCODE enhancers as gold standard positives. (F) Comparison of ENCODE enhancers and PECA predicted enhancers with a set of enhancers independently discovered by Kasper et al. (17) in MEF.
Fig. 5.
Fig. 5.
PECA accurately predicts expressions of TGs. Taking the Clock-Bhehl40 pair as an example (A), TF expression (Clock) has a clear but moderate correlation with TG expression (Bhehl40). The R2 is 0.42. (B) The product of Clock expression and the activation status of an RE (chr6:108,658,100–108,660,100) have a much higher correlation (R2 = 0.82) with Bhehl40 expression. This example illustrates the usefulness of RE accessibility in the prediction. (C–E) Out-sample comparison of gene expression prediction by PECA with those by TF expression or by RE accessibility. Matched expression and accessibility data were generated in a new cellular context (RA-induced differentiation of mESC) different from those used to train the PECA model. In this example, the model is trained from 56 cell types with matched expression and accessibility data. Fig. S2 provides details on these cell types.
Fig. 6.
Fig. 6.
PECA extracts regulatory relations. (A) Distribution of PCCs of validated TF–TG pairs detected by PECA. It is clear that PECA can recover many TF–TG pairs with low PCCs that cannot be detected by the traditional correlation-based method. (B) Candidate chromatin loop is inferred as a promoter and enhancer pair (associated with the same TG) on which two TFs with known protein–protein interaction are binding, respectively; i.e., one TF is promoter binding and the other is enhancer binding. For each interacting TF pair in the table, we compare the inferred chromatin loops to Hi-C data. Significant fractions of the predicted chromatin loops are validated by Hi-C experimental data. (C) Cooperating CR–CR pairs are further classified according to whether the two CRs in the pair tend to bind to the same element (red edge) or to different elements (blue edge). (D) A candidate chromatin loop is inferred as a pair of different REs bound, respectively, by two different CRs with protein–protein interaction and belonging to two different complexes. Most of the chromatin loops are validated by Hi-C experimental data (all validation percentages are larger than 80%). We also performed the permutation test and all of the predicted CR pairs are significantly validated by Hi-C data (all P values <0.001).
Fig. 7.
Fig. 7.
PECA reveals a context-specific network in mESC differentiation (6 d after RA-induced differentiation). (A) Node size of each TF is proportional to the number of target genes. For some highly expressed TFs, enriched GO terms of their target genes are noted in the associated text boxes. (B) Enriched GO terms of Ewsr1’s target genes, where FC1 means fold change defined as count/(expected count + 1). Only those GO terms with ranking score (last column) greater than 8 are shown.

References

    1. Schena M, Shalon D, Davis RW, Brown PO. Quantitative monitoring of gene expression patterns with a complementary DNA microarray. Science. 1995;270:467–470. - PubMed
    1. Ren B, et al. Genome-wide location and function of DNA binding proteins. Science. 2000;290:2306–2309. - PubMed
    1. Johnson DS, Mortazavi A, Myers RM, Wold B. Genome-wide mapping of in vivo protein-DNA interactions. Science. 2007;316:1497–1502. - PubMed
    1. Boyle AP, et al. High-resolution mapping and characterization of open chromatin across the genome. Cell. 2008;132:311–322. - PMC - PubMed
    1. Buenrostro JD, Giresi PG, Zaba LC, Chang HY, Greenleaf WJ. Transposition of native chromatin for fast and sensitive epigenomic profiling of open chromatin, DNA-binding proteins and nucleosome position. Nat Methods. 2013;10:1213–1218. - PMC - PubMed

Publication types

MeSH terms