. 2017 Jun 20;114(25):6545-6550.
doi: 10.1073/pnas.1617286114. Epub 2017 Jun 2.

Crystal structure of tubulin tyrosine ligase-like 3 reveals essential architectural elements unique to tubulin monoglycylases

Affiliations

Crystal structure of tubulin tyrosine ligase-like 3 reveals essential architectural elements unique to tubulin monoglycylases

Christopher P Garnham et al. Proc Natl Acad Sci U S A. .

Abstract

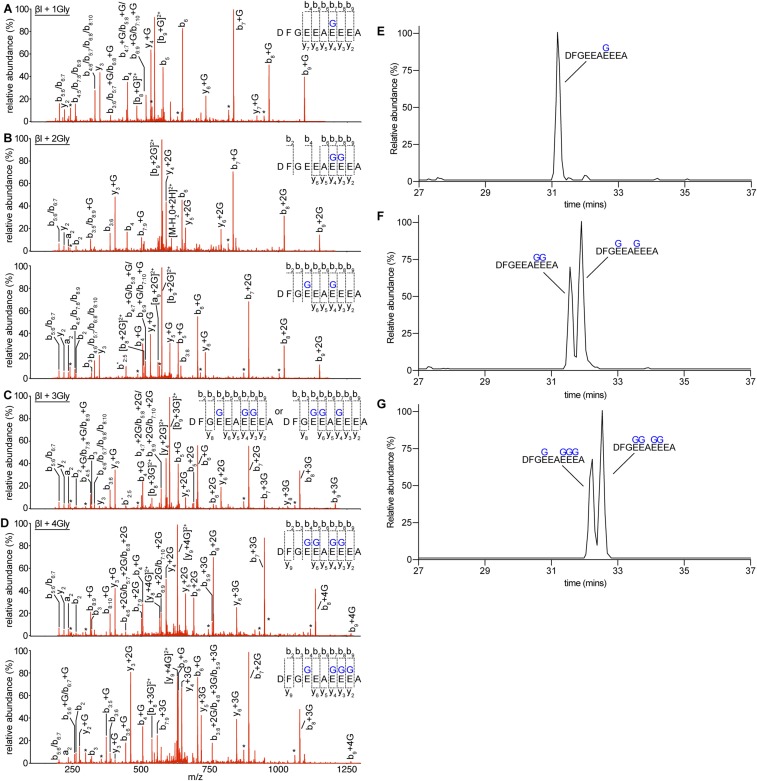
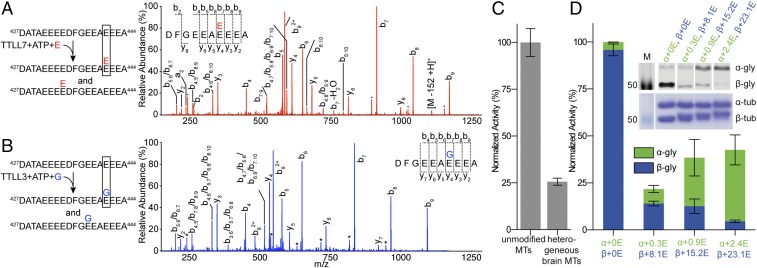
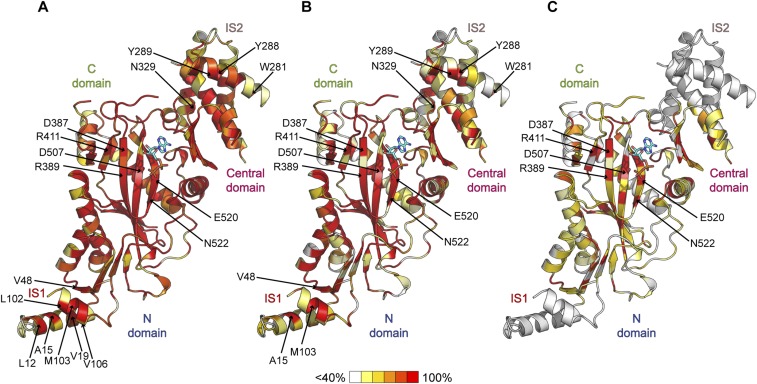
Glycylation and glutamylation, the posttranslational addition of glycines and glutamates to genetically encoded glutamates in the intrinsically disordered tubulin C-terminal tails, are crucial for the biogenesis and stability of cilia and flagella and play important roles in metazoan development. Members of the diverse family of tubulin tyrosine ligase-like (TTLL) enzymes catalyze these modifications, which are part of an evolutionarily conserved and complex tubulin code that regulates microtubule interactions with cellular effectors. The site specificity of TTLL enzymes and their biochemical interplay remain largely unknown. Here, we report an in vitro characterization of a tubulin glycylase. We show that TTLL3 glycylates the β-tubulin tail at four sites in a hierarchical order and that TTLL3 and the glutamylase TTLL7 compete for overlapping sites on the tubulin tail, providing a molecular basis for the anticorrelation between glutamylation and glycylation observed in axonemes. This anticorrelation demonstrates how a combinatorial tubulin code written in two different posttranslational modifications can arise through the activities of related but distinct TTLL enzymes. To elucidate what structural elements differentiate TTLL glycylases from glutamylases, with which they share the common TTL scaffold, we determined the TTLL3 X-ray structure at 2.3-Å resolution. This structure reveals two architectural elements unique to glycyl initiases and critical for their activity. Thus, our work sheds light on the structural and functional diversification of TTLL enzymes, and constitutes an initial important step toward understanding how the tubulin code is written through the intersection of activities of multiple TTLL enzymes.

Keywords: TTLL enzymes; glutamylation; glycylation; tubulin code; tubulin modification.


Conflict of interest statement

The authors declare no conflict of interest.

Figures

Fig. 1.
Fig. 1.
TTLL3 is a glycylation-initiating enzyme that modifies the β-tubulin tail. (A) Deconvoluted mass spectra of a synthetic C-terminal α1B- (Left) and βI-tubulin peptide (Right) glycylated by TTLL3 at a 1:20 enzyme:peptide molar ratio. Unmodified peptides at t 0 h, black; peaks corresponding to glycylated products, green and blue for α1B and βI, respectively. The Gly number added to each species is indicated. (B) Deconvoluted α- and β-tubulin mass spectra of Taxol-stabilized human microtubules (MTs) glycylated by TTLL3 at a 1:20 enzyme:tubulin molar ratio. The Gly number added is indicated and colored according to isoform. * and ** indicate Na+ and (N2FeOH)1+ adducts generated during LC/MS, respectively (46). (C) Reverse-phase LC/MS of TTLL3-modified human naïve microtubules tracking the normalized m/z intensity of individual βI-tubulin glycylated species over time (SI Materials and Methods). Mean ± SEM (n = 3). (D) Hierarchy of TTLL3 glycylation on the βI-tubulin tail from MS/MS experiments (Materials and Methods).
Fig. S1.
Fig. S1.
TTLL3 glycylation time course with microtubule and synthetic βI-tubulin peptide substrates monitored via reverse-phase LC/MS. (A) Chromatogram (220 nm) of Taxol-stabilized human naïve microtubules modified by TTLL3 at a 1:10 ratio and separated via reverse-phase LC/MS. Note that all β-tubulin isoforms coelute during reverse-phase separation. mAu, absorbance units. (B) Deconvoluted LC/MS spectra showing the raw intensity of each species during the time course (t = 0, 0.5, 1, 2, 4, 8, 12, 18, and 24 h). Two representative spectra (blue and red) are shown for each time point. Only βI-tubulin species are labeled, as only their intensities were tracked during the reaction. (C) Reverse-phase LC/MS analysis of TTLL3 glycylated synthetic βI-tubulin tail peptide modified at a 1:10 ratio tracking the normalized m/z intensity of individual glycylated βI-tubulin peptide species over time (SI Materials and Methods). Values are mean ± SEM (n = 4). (D) Deconvoluted LC/MS spectra showing the raw intensity of each peptide species during the time course (t = 0, 0.75, 1.5, 3, 6, 9, 17.5, and 24 h). Two representative spectra are shown for each time point.
Fig. S2.
Fig. S2.
MS/MS sequencing of tubulin C-terminal tails proteolytically released from microtubules glycylated by TTLL3. MS/MS sequencing of Asp-N–released C-terminal naïve human microtubule tails glycylated by X. tropicalis TTLL3. (A) Monoglycylated species. (B) Diglycylated species. (C) Triglycylated species. (D) Tetraglycylated species. Individual a-, b-, and y-series ions for each spectrum are indicated, as is the deduced amino acid sequence. Asterisks indicate ions with a neutral loss of an H2O group. All possible species are listed for ions whose mass does not allow for unambiguous deduction of amino acid sequence. Two triglycylated species, DFGEEAEEEA and DFGEEAEEEA (glycylation sites are indicated in bold), coeluted during reverse-phase separation and could not be separated into individual spectra. For clarity, we list the added Gly numbers next to the y and b ions as +n Gly, where n is the number of glycines on that particular ion species. (E) Extracted-ion chromatogram of Asp-N–released monoglycylated tail peptides showing predominantly a single species modified at E441. (F) XIC of Asp-N–released diglycylated tail peptides showing two distinct species, modified at either E438/E441 or E441/E442. (G) XIC of Asp-N–released tetraglycylated tail peptides showing two distinct species, modified at either E438/E441/E442/E443 or E438/E439/E441/E442 (see Materials and Methods for further details).
Fig. 2.
Fig. 2.
TTLL3 and TTLL7 compete for overlapping sites on the β-tubulin tail. (A) MS/MS spectrum of a βI-tubulin tail peptide fragment proteolytically released from microtubules glutamylated by TTLL7 showing glutamylation at E441. Individual a-, b-, and y-series ions for each spectrum are shown together with the deduced sequence. Asterisks indicate ions with neutral loss of an H2O group. The annotation i:j represents a fragment from internal cleavage; for example, b4:7 represents the peptide fragment from the fourth to the seventh residue. All possible species are listed when different fragments have the same mass. (B) MS/MS spectrum of a βI-tubulin tail peptide fragment proteolytically released from microtubules glycylated by TTLL3 showing glycylation at E441 (annotated as in A). (C) Normalized glycylation activity of TTLL3 on unmodified and heterogeneous brain microtubules. Mean ± SEM (n = 3). (D) Normalized TTLL3 glycylation activity of TTLL3 on unmodified and glutamylated microtubules. Mean ± SEM (n = 2). The weighted average of glutamates added to α- and β-tubulin is indicated. (D, Inset) Western blot of the 3-h time point of each reaction probed with the monoglycylation-specific TAP952 antibody (Top) and Coomassie-stained SDS/PAGE of glutamylated microtubules used as substrates (Bottom).
Fig. S3.
Fig. S3.
MS/MS sequencing of tubulin C-terminal tails proteolytically released from microtubules glutamylated by TTLL7. (A) Reverse-phase LC/MS analyses of TTLL7-modified Taxol-stabilized human microtubules. Deconvoluted α- and β-tubulin mass spectra after 0- and 1-h incubation with TTLL7 at a 1:10 enzyme:tubulin molar ratio. The weighted average of glutamates added is indicated and colored according to isoform. (B and C) MS/MS sequencing of Asp-N–released microtubule tails glutamylated by X. tropicalis TTLL7. Individual a-, b-, and y-series ions for each spectrum are indicated, as is the deduced amino acid sequence. Asterisks indicate ions with a neutral loss of an H2O group. All possible species are listed when different fragments have the same mass.
Fig. 3.
Fig. 3.
TTLL3 crystal structure and comparison across the TTLL family. (A) Cartoon representation of the TTLL3 core bound to AMPPNP. (B) Close-up of the interface between IS2 α7 and central domain α5. (C) Close-up showing interactions between IS1 α1 and α3. (D) X-ray crystal structure of TTL [Protein Data Bank (PDB) ID code 4IHJ]. (E) Hybrid X-ray and cryo-EM structure of TTLL7 [PDB ID code 4YLS, Electron Microscopy Data Bank (EMD) ID code EMD-6307]; the cMTBD atomic model (gold) is based on the EM map and is incomplete. Nucleotides are in ball-and-stick format. Spheres indicate disordered segments.
Fig. S4.
Fig. S4.
X-ray crystal structure of TTLL3. (A) Stereoview of a section of the electron density at 1σ after single-wavelength anomalous dispersion phasing and density modification. Shown is a section of X. tropicalis TTLL3 centered on helix α11. Additional electron density attributable to EMP-modified Cys150 is indicated. (B) Asymmetric unit dimer of TTLL3. (C) Gel-permeation chromatogram of X. tropicalis TTLL3 (residues 6–569, E520Q). Approximately 3 mg of protein was separated on a Superdex 75 column (10/300) in 20 mM Hepes (pH 7), 200 mM KCl, 10 mM MgCl2, and 2 mM TCEP. (C, Inset) Protein standards under the same buffer conditions. Vo, void volume; Vt, total column volume. (D) Normalized in vitro glycylation activity of TTLL3 residues 6–569, 6–592, and 1–830. The 1–830 construct was purified from HEK293 cells. Error bars represent SEM (n = 3). (E) Alignment of the two TTLL3 copies in the asymmetric unit. (F) Close-up view of the active site of TTLL3 showing Fo − Fc (gray mesh; σ2.5) and 2Fo − Fc omit map electron density (orange mesh; σ2.5) before modeling the nucleotide. AMPPNP with the γ-phosphate unresolved is shown in ball-and-stick representation.
Fig. S5.
Fig. S5.
Alignment of TTLL3 and TTLL8 sequences. Secondary structure elements are indicated above the corresponding sequence. α-helices, cylinders; β-strands, arrows; random coil, lines. Segments of TTLL3 not built due to poorly resolved electron density are denoted by dashed lines. Sequence identity is color-coded using a gradient from white (below 40%) to red (100%). Residues involved in nucleotide binding are denoted by an asterisk; residues critical for activity are indicated by a red X. The red arrow indicates an autoglycylation site in TTLL3 identified by MS/MS sequencing. Residues involved in the formation of a π-helix are denoted by Π. Mutations in TTLL3 associated with colon cancer (23, 41) are indicated in red above their respective positions; inactivating mutations (12) in the human elongating glycylase TTLL10 are colored gray.
Fig. 4.
Fig. 4.
Molecular determinants of microtubule glycylation by TTLL3. (A) TTLL3 molecular surface colored according to conservation (red, 100% identity; white, <40%). (B) TTLL3 molecular surface colored according to electrostatic potential (red, negative; blue, positive; from −7 to +7 kBT). IS2 residues D265–D267 are not resolved in our structure. (C) TTLL3 structure showing residues important for glycylation. Residues at the proposed microtubule-binding interface are shown in aqua; those in the active site and tubulin tail-binding groove are shown in orange. IS1 and IS2 are in red and violet, respectively. Disordered regions are shown as spheres. (D) Normalized in vitro glycylation activity of recombinant structure-guided TTLL3 mutants with unmodified human microtubules. Activity was measured by Western blot using the TAP952 anti-monoglycylated tubulin antibody (SI Materials and Methods). *P < 0.05, **P < 0.01, and ****P < 0.0001. Mean ± SEM (n ≥ 6).
Fig. S6.
Fig. S6.
TTLL3 surface colored according to conservation and electrostatic potential. (A) Surface representation of TTLL3 (rotated 90° compared with the view in Fig. 4A) colored according to conservation among TTLL3 isoforms (red, 100% conservation; white, <40%). Arrows indicate residues important for glycylation. (B) TTLL3 molecular surface (rotated 90° compared with the view in Fig. 4B) color-coded according to electrostatic potential (red, negative; blue, positive; from −7 to +7 kBT).
Fig. 5.
Fig. 5.
TTLL3 and TTLL8 share structural elements critical for glycylation. (A) The TTLL3 molecular surface is colored according to conservation across TTLL3 and TTLL8s as in Fig. 4A. Arrows indicate TTLL8 residues important for glycylation. Residues D328–D330 are not resolved in our structure (SI Materials and Methods); their approximate position is indicated by an arrow. (B) Normalized glycylation activity of GFP-tagged wild-type mouse TTLL8 and site-directed mutants as determined by quantifying the glycylation signal from immunofluorescence in U2OS cells (SI Materials and Methods; n ≥ 50 cells for each construct; error bars show SEM; ***P < 0.001; ****P < 0.0001). (C) Sequence alignment of TTLL3 and TTLL8 showing conservation of the IS2 DID motif. Cm, Chelonia mydas; Dr, Danio rerio; Hs, Homo sapiens; Mm, Mus musculus; Sc, Struthio camelus australis; Xt, X. tropicalis. (D) Cellular distribution (green) and glycylation activity (red) of GFP-tagged wild type and IS2 mutants transiently transfected in U2OS cells. (Scale bar, 10 μm.) (D, Insets) (Magnification, 2.5×.)
Fig. S7.
Fig. S7.
Conservation across TTLL glycylases. (A) Cartoon representation of the TTLL3 structure, colored according to sequence similarity (4) among TTLL3 isoforms. Gradient from red (100% conserved) to white (<40%). (B) As in A, but colored according to conservation between the TTLL3 and -8 isoforms. (C) As in A, but colored according to conservation among TTLL3, -8, and -10. Active-site residues conserved in TTLL3, -8, and -10 are indicated, as are residues important for the structural integrity of IS1 and IS2.
Fig. S8.
Fig. S8.
Structure-based multiple sequence alignment of representative human TTLL sequences: TTLL3 (NP_001021100, BAG59759, NR_037162.1), TTLL8 (XP_016884665.1), TTLL10 (NP_001123517.1), TTLL1 (NP_03695.1), TTLL6 (NP_001124390.1), TTLL7 (NP_078962.4), and TTL (NP_714923.1). Alignment was performed with the program T-Coffee (www.ebi.ac.uk/Tools/msa/tcoffee/). The output alignment was used as input in JALVIEW (www.jalview.org) and manually curated. Residues are colored according to the Blosum62 matrix, with an identity threshold set to 30%. Secondary structure elements are indicated above the corresponding sequence. Disordered elements are designated by a hatched line. IS1 and IS2 specific to monoglycylases TTLL3 and TTLL8 are colored in red as in Fig. S5. The cationic microtubule-binding domain (cMTBD) and cMTBD anchor helix specific to all autonomous glutamylases (only TTLL6 and TTLL7 sequences are shown) are colored orange and aqua, respectively, as in Fig. 3. Glycylase-specific residues important for activity are highlighted with a red box, whereas residues universally conserved across TTL and TTLLs important for activity are highlighted by a black box.

Similar articles

Cited by

References

    1. Roll-Mecak A. Intrinsically disordered tubulin tails: Complex tuners of microtubule functions? Semin Cell Dev Biol. 2015;37:11–19. - PMC - PubMed
    1. Verhey KJ, Gaertig J. The tubulin code. Cell Cycle. 2007;6:2152–2160. - PubMed
    1. Yu I, Garnham CP, Roll-Mecak A. Writing and reading the tubulin code. J Biol Chem. 2015;290:17163–17172. - PMC - PubMed
    1. Valenstein ML, Roll-Mecak A. Graded control of microtubule severing by tubulin glutamylation. Cell. 2016;164:911–921. - PMC - PubMed
    1. Bieling P, et al. CLIP-170 tracks growing microtubule ends by dynamically recognizing composite EB1/tubulin-binding sites. J Cell Biol. 2008;183:1223–1233. - PMC - PubMed

Publication types