

Factors Associated with Frailty and Its Trajectory among Patients on Hemodialysis
- PMID: 28576906
- PMCID: PMC5498360
- DOI: 10.2215/CJN.12131116
Factors Associated with Frailty and Its Trajectory among Patients on Hemodialysis
Abstract
Background and objectives: Frailty is common among patients on hemodialysis and associated with adverse outcomes. However, little is known about changes in frailty over time and the factors associated with those changes.
Design, setting, participants, & measurements: To address these questions, we examined 762 participants in the A Cohort to Investigate the Value of Exercise/Analyses Designed to Investigate the Paradox of Obesity and Survival in ESRD cohort study, among whom frailty was assessed at baseline and 12 and 24 months. We used ordinal generalized estimating equations analyses and modeled frailty (on a scale from zero to five possible components) and death during follow-up.
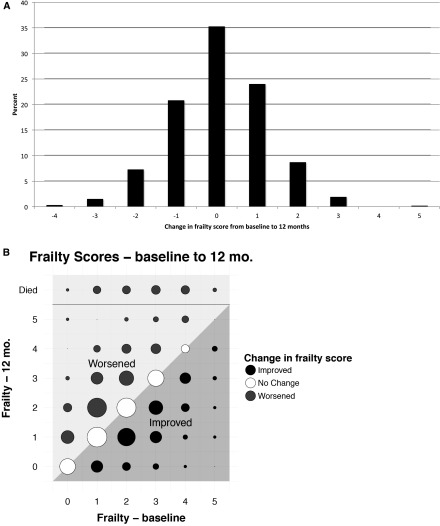
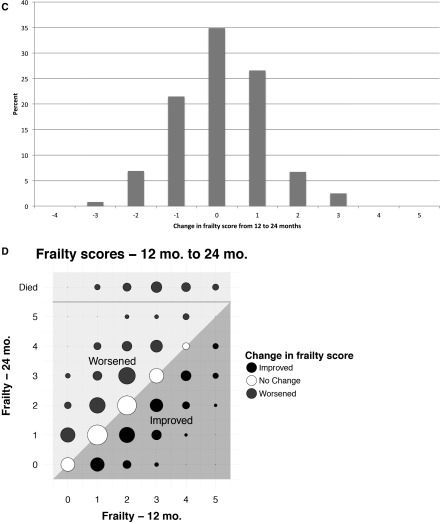
Results: The mean frailty score at baseline was 1.9, and the distribution of frailty scores was similar at each evaluation. However, most participants' scores changed, with patients improving almost as often as worsening (overall change, 0.2 points per year; 95% confidence interval, 0.1 to 0.3). Hispanic ethnicity (0.6 points per year; 95% confidence interval, 0.0 to 1.1) and diabetes (0.7 points per year; 95% confidence interval, 0.3 to 1.0) were associated with higher frailty scores and higher serum albumin concentration with lower frailty scores (-1.1 points per g/dl; 95% confidence interval, -1.5 to -0.7). In addition, patients whose serum albumin increased over time were less likely to become frail, with each 1-g/dl increase in albumin associated with a 0.4-point reduction in frailty score (95% confidence interval, -0.80 to -0.05). To examine the underpinnings of the association between serum albumin and frailty, we included serum IL-6, normalized protein catabolic rate, and patient self-report of hospitalization within the last year in a second model. Higher IL-6 and hospitalization were statistically significantly associated with worse frailty at any point and worsening frailty over time, whereas normalized protein catabolic rate was not independently associated with frailty.
Conclusions: There was substantial year to year variability in frailty scores, with approximately equal numbers of patients improving and worsening. Markers of inflammation and hospitalization were independently associated with worsening frailty. Studies should examine whether interventions to address inflammation or posthospitalization rehabilitation can improve the trajectory of frailty.
Keywords: Adiposity; Follow-Up Studies; Hispanic Americans; Humans; IL6 protein, human; Inflammation; Interleukin-6; Serum Albumin; chronic kidney disease; diabetes mellitus; end-stage renal disease; frailty; functional status; hemodialysis; hospitalization; obesity; physical function; renal dialysis.
Copyright © 2017 by the American Society of Nephrology.
Figures

References
-
- Morley JE, Vellas B, van Kan GA, Anker SD, Bauer JM, Bernabei R, Cesari M, Chumlea WC, Doehner W, Evans J, Fried LP, Guralnik JM, Katz PR, Malmstrom TK, McCarter RJ, Gutierrez Robledo LM, Rockwood K, von Haehling S, Vandewoude MF, Walston J: Frailty consensus: A call to action. J Am Med Dir Assoc 14: 392–397, 2013 - PMC - PubMed
-
- Fried LP, Tangen CM, Walston J, Newman AB, Hirsch C, Gottdiener J, Seeman T, Tracy R, Kop WJ, Burke G, McBurnie MA; Cardiovascular Health Study Collaborative Research Group : Frailty in older adults: Evidence for a phenotype. J Gerontol A Biol Sci Med Sci 56: M146–M156, 2001 - PubMed
Publication types
MeSH terms
Substances
Grants and funding
LinkOut - more resources
Full Text Sources
Other Literature Sources
Medical
Miscellaneous
