

Binocular Disparity Selectivity Weakened after Monocular Deprivation in Mouse V1
- PMID: 28576937
- PMCID: PMC5511882
- DOI: 10.1523/JNEUROSCI.1193-16.2017
Binocular Disparity Selectivity Weakened after Monocular Deprivation in Mouse V1
Abstract
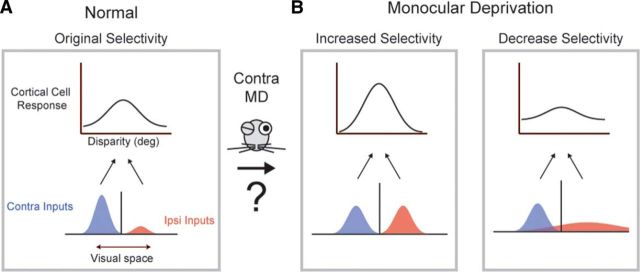
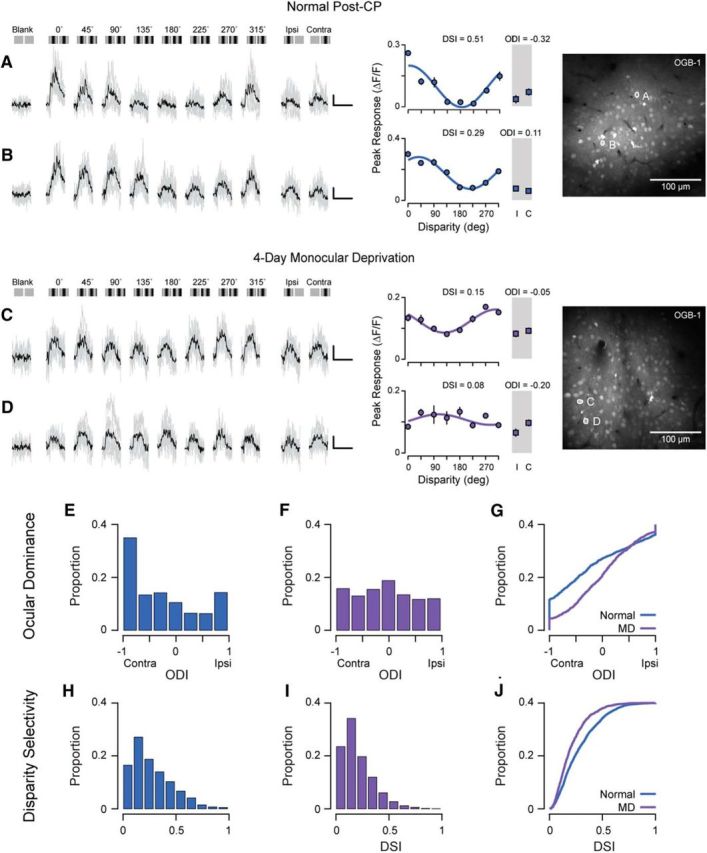
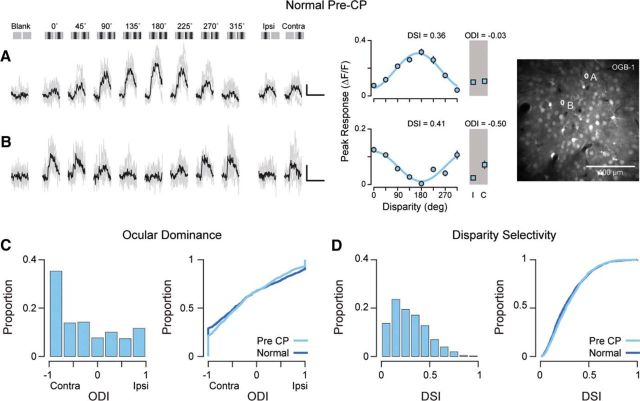
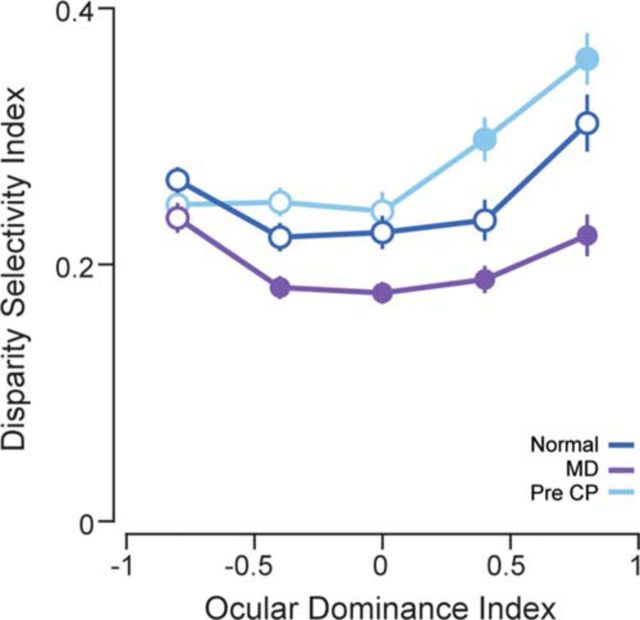
Experiences during the critical period sculpt the circuitry within the neocortex, leading to changes in the functional responses of sensory neurons. Monocular deprivation (MD) during the visual critical period causes shifts in ocular preference, or dominance, toward the open eye in primary visual cortex (V1) and disrupts the normal development of acuity. In carnivores and primates, MD also disrupts the emergence of binocular disparity selectivity, a cue resulting from integrating ocular inputs. This disruption may be a result of the increase in neurons driven exclusively by the open eye that follows deprivation or a result of a mismatch in the convergence of ocular inputs. To distinguish between these possibilities, we measured the ocular dominance (OD) and disparity selectivity of neurons from male and female mouse V1 following MD. Normal mouse V1 neurons are dominated by contralateral eye input and contralateral eye deprivation shifts mouse V1 neurons toward more balanced responses between the eyes. This shift toward binocularity, as assayed by OD, decreased disparity sensitivity. MD did not alter the initial maturation of binocularity, as disparity selectivity before the MD was indistinguishable from normal mature animals. Decreased disparity tuning was most pronounced in binocular and ipsilaterally biased neurons, which are the populations that have undergone the largest shifts in OD. In concert with the decline in disparity selectivity, we observed a shift toward lower spatial frequency selectivity for the ipsilateral eye following MD. These results suggest an emergence of novel synaptic inputs during MD that disrupt the representation of disparity selectivity.SIGNIFICANCE STATEMENT We demonstrate that monocular deprivation during the developmental critical period impairs binocular integration in mouse primary visual cortex. This impairment occurs despite an increase in the degree to which neurons become more binocular. We further demonstrate that our deprivation did not impair the maturation of disparity selectivity. Disparity selectivity has already reached a matured level before the monocular deprivation. The loss of disparity tuning is primarily observed in neurons dominated by the open eye, suggesting a link between altered inputs and loss of disparity sensitivity. These results suggest that new inputs following deprivation may not maintain the precise spatial relationship between the two eye inputs required for disparity selectivity.
Keywords: binocular disparity; critical period; monocular deprivation; mouse visual cortex; plasticity.
Copyright © 2017 the authors 0270-6474/17/376517-10$15.00/0.
Figures
Similar articles
-
Long-term Monocular Deprivation during Juvenile Critical Period Disrupts Binocular Integration in Mouse Visual Thalamus.J Neurosci. 2020 Jan 15;40(3):585-604. doi: 10.1523/JNEUROSCI.1626-19.2019. Epub 2019 Nov 25. J Neurosci. 2020. PMID: 31767678 Free PMC article.
-
Functional Differentiation of Mouse Visual Cortical Areas Depends upon Early Binocular Experience.J Neurosci. 2021 Feb 17;41(7):1470-1488. doi: 10.1523/JNEUROSCI.0548-20.2020. Epub 2020 Dec 29. J Neurosci. 2021. PMID: 33376158 Free PMC article.
-
Disparity Sensitivity and Binocular Integration in Mouse Visual Cortex Areas.J Neurosci. 2020 Nov 11;40(46):8883-8899. doi: 10.1523/JNEUROSCI.1060-20.2020. Epub 2020 Oct 13. J Neurosci. 2020. PMID: 33051348 Free PMC article.
-
Comparative Neuroplasticity in Frontal- and Lateral-Eyed Mammals With Induced-Binocular Vision Dysfunction: Insights From Monocular Deprivation Models.Eur J Neurosci. 2025 Jul;62(1):e70179. doi: 10.1111/ejn.70179. Eur J Neurosci. 2025. PMID: 40634238 Free PMC article. Review.
-
Neuronal Representation of 3-D Space in the Primary Visual Cortex and Control of Eye Movements.Perception. 2015;44(8-9):995-1006. doi: 10.1177/0301006615594930. Epub 2015 Aug 14. Perception. 2015. PMID: 26562914 Review.
Cited by
-
Binocular visual experience drives the maturation of response variability and reliability in the visual cortex.iScience. 2022 Aug 18;25(9):104984. doi: 10.1016/j.isci.2022.104984. eCollection 2022 Sep 16. iScience. 2022. PMID: 36105593 Free PMC article.
-
Contralateral Bias of High Spatial Frequency Tuning and Cardinal Direction Selectivity in Mouse Visual Cortex.J Neurosci. 2017 Oct 18;37(42):10125-10138. doi: 10.1523/JNEUROSCI.1484-17.2017. Epub 2017 Sep 18. J Neurosci. 2017. PMID: 28924011 Free PMC article.
-
Binocular integration of retinal motion information underlies optic flow processing by the cortex.Curr Biol. 2021 Mar 22;31(6):1165-1174.e6. doi: 10.1016/j.cub.2020.12.034. Epub 2021 Jan 22. Curr Biol. 2021. PMID: 33484637 Free PMC article.
-
In Vivo Imaging of the Coupling between Neuronal and CREB Activity in the Mouse Brain.Neuron. 2020 Mar 4;105(5):799-812.e5. doi: 10.1016/j.neuron.2019.11.028. Epub 2019 Dec 26. Neuron. 2020. PMID: 31883788 Free PMC article.
-
Chronic Monocular Deprivation Reveals MMP9-Dependent and -Independent Aspects of Murine Visual System Plasticity.Int J Mol Sci. 2022 Feb 23;23(5):2438. doi: 10.3390/ijms23052438. Int J Mol Sci. 2022. PMID: 35269580 Free PMC article.
References
Publication types
MeSH terms
Grants and funding
LinkOut - more resources
Full Text Sources
Other Literature Sources