Riparian Meadow Response to Modern Conservation Grazing Management
- PMID: 28577051
- PMCID: PMC5544782
- DOI: 10.1007/s00267-017-0897-1
Riparian Meadow Response to Modern Conservation Grazing Management
Abstract
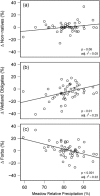
Riparian meadows occupy a small proportion of the public lands in the western United States but they provide numerous ecosystem services, including the production of high-quality forage for livestock grazing. Modern conservation management strategies (e.g., reductions in livestock stocking rates and adoption of new riparian grazing standards) have been implemented to better balance riparian conservation and livestock production objectives on publicly managed lands. We examined potential relationships between long-term changes in plant community, livestock grazing pressure and environmental conditions at two spatial scales in meadows grazed under conservation management strategies. Changes in plant community were not associated with either livestock stocking rate or precipitation at the grazing allotment (i.e., administrative) scale. Alternatively, both grazing pressure and precipitation had significant, albeit modest, associations with changes in plant community at the meadow (i.e., ecological site) scale. These results suggest that reductions in stocking rate have improved the balance between riparian conservation and livestock production goals. However, associations between elevation, site wetness, precipitation, and changes in plant community suggest that changing climate conditions (e.g., reduced snowpack and changes in timing of snowmelt) could trigger shifts in plant communities, potentially impacting both conservation and agricultural services (e.g., livestock and forage production). Therefore, adaptive, site-specific management strategies are required to meet grazing pressure limits and safeguard ecosystem services within individual meadows, especially under more variable climate conditions.
Keywords: Climate change; Livestock grazing; Long-term; Plant community monitoring; Public lands; Riparian meadows; United States Forest Service.
Conflict of interest statement
The authors declare that they have no competing interests.
Figures


Similar articles
-
Montane meadow plant community response to livestock grazing.Environ Manage. 2014 Aug;54(2):301-8. doi: 10.1007/s00267-014-0294-y. Epub 2014 May 22. Environ Manage. 2014. PMID: 24849070
-
FORAGES AND PASTURES SYMPOSIUM: Improving soil health and productivity on grasslands using managed grazing of livestock.J Anim Sci. 2015 Jun;93(6):2626-40. doi: 10.2527/jas.2014-8787. J Anim Sci. 2015. PMID: 26115251
-
Livestock management, beaver, and climate influences on riparian vegetation in a semi-arid landscape.PLoS One. 2018 Dec 11;13(12):e0208928. doi: 10.1371/journal.pone.0208928. eCollection 2018. PLoS One. 2018. PMID: 30533026 Free PMC article.
-
Multi-paddock grazing on rangelands: why the perceptual dichotomy between research results and rancher experience?J Environ Manage. 2013 Oct 15;128:699-717. doi: 10.1016/j.jenvman.2013.05.064. Epub 2013 Jul 11. J Environ Manage. 2013. PMID: 23850765 Review.
-
Effects of Livestock Grazing On The Ecology Of Sierra Meadows: A Review of The Current State of Scientific Knowledge To Inform Meadow Restoration And Management.Environ Manage. 2022 Jun;69(6):1118-1136. doi: 10.1007/s00267-022-01634-7. Epub 2022 Mar 29. Environ Manage. 2022. PMID: 35352198
Cited by
-
Assessing the Impact of Environmental and Management Variables on Mountain Meadow Yield and Feed Quality Using a Random Forest Model.Plants (Basel). 2025 Jul 11;14(14):2150. doi: 10.3390/plants14142150. Plants (Basel). 2025. PMID: 40733386 Free PMC article.
References
-
- Acreman M, Holden J. Hows wetlands affect floods. Wetlands. 2013;33:773–786. doi: 10.1007/s13157-013-0473-2. - DOI
-
- Allen-Diaz BH. Water table and plant species relationships in Sierra Nevada meadows. Am Midl Nat. 1991;126:30–43. doi: 10.2307/2426147. - DOI
-
- Bales RC et al. (2011) Forests and Water in the Sierra Nevada Watershed Ecosystem Enhancement Project. Sierra Nevada Research Institute. Merced, CA. Report Number 11.1
-
- Belsky AJ, Matzke A, Uselman S. Survey of livestock influences on stream and riparian ecosystems in the western United States. J Soil Water Conserv. 1999;54:419–431.
MeSH terms
LinkOut - more resources
Full Text Sources
Other Literature Sources

