. 2017 Aug;35(8):1973-1983.
doi: 10.1002/stem.2645. Epub 2017 Jun 15.

IP6K1 Reduces Mesenchymal Stem/Stromal Cell Fitness and Potentiates High Fat Diet-Induced Skeletal Involution

Affiliations

IP6K1 Reduces Mesenchymal Stem/Stromal Cell Fitness and Potentiates High Fat Diet-Induced Skeletal Involution

Siddaraju V Boregowda et al. Stem Cells. 2017 Aug.

Abstract

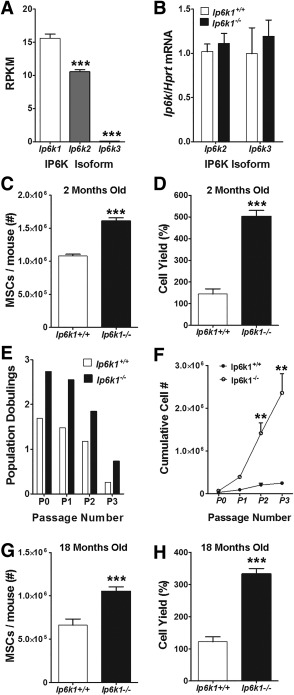
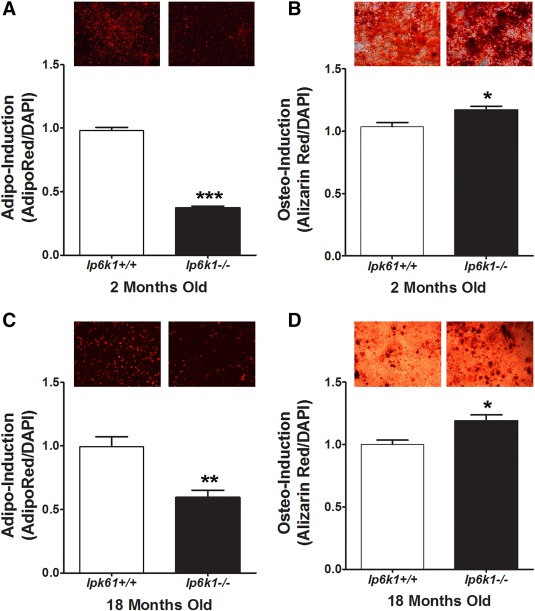
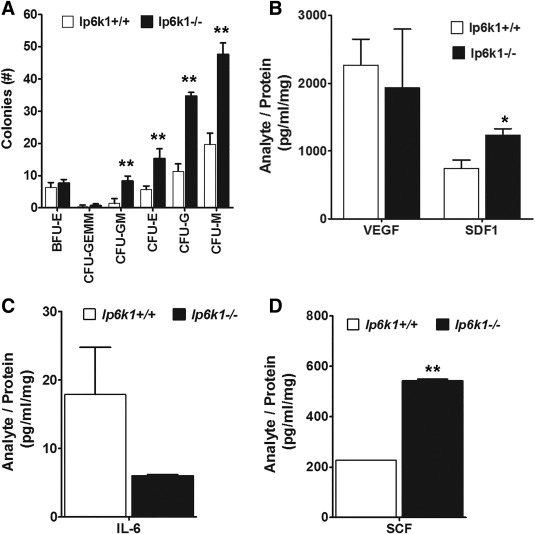
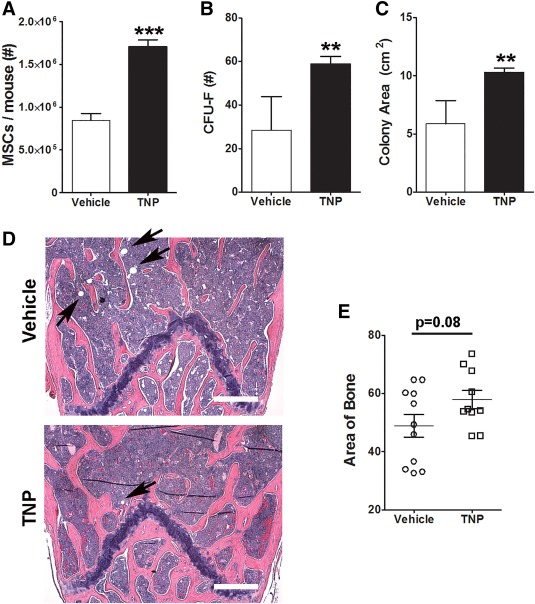
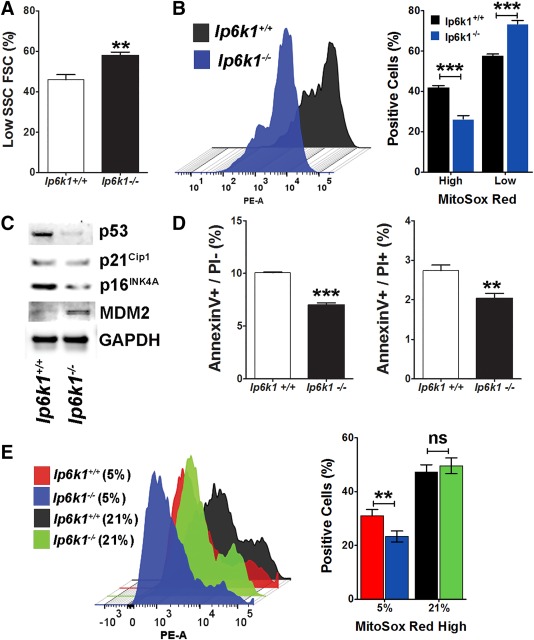
Mesenchymal stem/stromal cells (MSCs) are the predominant source of bone and adipose tissue in adult bone marrow and play a critical role in skeletal homeostasis. Age-induced changes in bone marrow favor adipogenesis over osteogenesis leading to skeletal involution and increased marrow adiposity so pathways that prevent MSC aging are potential therapeutic targets for treating age-related bone diseases. Here, we show that inositol hexakisphosphate kinase 1 (Ip6k1) deletion in mice increases MSC yields from marrow and enhances cell growth and survival ex vivo. In response to the appropriate stimuli, Ip6k1-/- versus Ip6k1+/+ MSCs also exhibit enhanced osteogenesis and hematopoiesis-supporting activity and reduced adipogenic differentiation. Mechanistic-based studies revealed that Ip6k1-/- MSCs express higher MDM2 and lower p53 protein levels resulting in lower intrinsic mitochondrial reactive oxygen species (ROS) levels as compared to Ip6k1+/+ MSCs, but both populations upregulate mitochondrial ROS to similar extents in response to oxygen-induced stress. Finally, we show that mice fed a high fat diet exhibit reduced trabecular bone volume, and that pharmacological inhibition of IP6K1 using a pan-IP6K inhibitor largely reversed this phenotype while increasing MSC yields from bone marrow. Together, these findings reveal an important role for IP6K1 in regulating MSC fitness and differentiation fate. Unlike therapeutic interventions that target peroxisome proliferator-activated receptor gamma and leptin receptor activity, which yield detrimental side effects including increased fracture risk and altered feeding behavior, respectively, inhibition of IP6K1 maintains insulin sensitivity and prevents obesity while preserving bone integrity. Therefore, IP6K1 inhibitors may represent more effective insulin sensitizers due to their bone sparing properties. Stem Cells 2017;35:1973-1983.

Keywords: Adipogenesis; Bone; High fat diet; Inositol hexakisphosphate kinase 1; Mesenchymal stem cells; Mesenchymal stromal cells; Osteogenesis.


Figures

Figure 1
Figure 1
Deletion of inositol hexakisphosphate kinase 1 (Ip6k1) enhances yield and proliferative potential of primary, marrow‐derived mouse mesenchymal stem/stromal cells (MSCs). (A): RNA‐Seq analysis of Ip6k isoforms in mouse MSCs. Note that Ip6k1 is the predominate isoform. (B): Quantitative polymerase chain reaction analysis of Ip6k2 and Ip6k3 in Ip6k1 −/− MSCs. (C, G): Total yield of marrow‐derived MSCs following immunodepletion from young (2 months, C) versus old mice (18 months, G). (D, H): Yield of MSCs (percentage of initially plated cells) from young (D) and old (H) mice after 7 days of culture expansion. (E, F): Total population doublings (E) and cumulative cell yield (F) of immunodepleted MSCs from 2 months old wild type and Ip6k1 −/− mice over four cell passages. All data represent mean ± SD (n = 3). (A, C, D, G), and (H) are Student's t test (***, p < .001), and (F) is two‐way analysis of variance with Tukey post hoc test (**, p < .01). Abbreviations: Ip6k1, inositol hexakisphosphate kinase 1; MSC, mesenchymal stem/stromal cell; RPKM, Reads per Kilobase of transcripts per Million mapped reads.
Figure 2
Figure 2
Enhanced osteogenic and reduced adipogenic differentiation of inositol hexakisphosphate kinase 1 (Ip6k1) null mesenchymal stem/stromal cells (MSCs). (A, C): Quantification of adipogenic differentiation by MSCs isolated from young (2 months, A) and old mice (18 months, C). Photomicrographs (top panels) are cell monolayers stained with AdipoRed at 3 days post‐induction. (B, D): Quantification of osteogenic differentiation by MSCs isolated from young (C) and old (D) mice. Photomicrographs (right panels) are cell monolayers stained with Alizarin Red at 10 days post‐induction. All data represent mean ± SD (n = 3) from experiments repeated three times. Student's t test (*, p < .05; **, p < .01; ***, p < .001). Magnification of photomicrographs is ×50. Abbreviations: DAPI, 4′,6‐diamidino‐2‐phenylindole; Ip6k1, inositol hexakisphosphate kinase 1.
Figure 3
Figure 3
Inositol hexakisphosphate kinase 1 (Ip6k1) deletion enhances mesenchymal stem/stromal cell (MSC) hematopoiesis‐support activity. (A): Methylcellulose colony forming assays using conditioned media from Ip6K1+/+ versus Ip6k1 −/− MSCs. Data are mean ± SD (n = 3). **, p < .01 by analysis of variance (ANOVA) and Tukey post hoc test. (B): Conditioned media from Ip6K1+/+ versus Ip6k1 −/− MSCs was concentrated 50‐fold and analyzed using Luminex‐based multiplex bead arrays. Data represent mean ± SD (n = 2). (A) is two‐way ANOVA with Tukey post hoc test (**, p < .001) and (B–D) are Student's t test (*, p < .05; **, p < .01). Abbreviations: BFU, blast forming unit; CFU, colony forming unit; E, erythroid; G, granulocyte; GEMM, granulocyte, erythrocyte, monocyte, megakaryocyte; GM, granulcoyte, monocyte; M, monocyte; IL‐6, interleukin‐6; IP6K1, inositol hexakisphosphate kinase 1; SCF, stem cell factor; SDF, stromal derived factor; VEGF, vascular endothelial growth factor.
Figure 4
Figure 4
Pharmacological inhibition of inositol hexakisphosphate kinase 1 (IP6K1) preserves mesenchymal stem/stromal cell (MSC) integrity and inhibits high fat diet (HFD)‐induced adipogenesis and bone loss in adult bone marrow. (A): Total yield of immunodepleted MSCs from the bone marrow of mice fed a HFD for 2 months and treated with vehicle or N2‐(m‐trifluorobenzyl), N6‐(p‐nitrobenzyl)purine (10 mg/kg IP, n = 7 mice). Data represent mean ± SD (n = 3). (B): CFU‐F frequency measured in whole bone marrow from mice in (A). Data represent mean ± SD (n = 5). (C): Total area occupied by CFU‐Fs from (B). (D): Representative histological sections of long bones stained with H&E from mice in (A). Pink stained areas represent bone. Arrows demark lipid vacuoles. Magnification is ×50. Scale bar = 180 µm. (E): Total area of bone determined by morphometric analysis of tissue sections (two sections per mouse, n = 6 mice per group) from mice in (A). Data represent mean ± SD (n = 10–11). Student's t test (**, p < .01; ***, p < .001). Abbreviations: CFU, colony forming unit; F, fibroblast; MSC, mesenchymal stem/stromal cell; TNP, N2‐(m‐Trifluorobenzyl), N6‐(p‐nitrobenzyl)purine.
Figure 5
Figure 5
Inositol hexakisphosphate kinase 1 (Ip6k1) deletion enhances mesenchymal stem/stromal cell (MSC) survival and resistance to oxidative stress. (A): Flow cytometric analysis showing percentage of low forward scatter cells and side scatter cells in Ip6k1+/+ versus Ip6k1 −/− MSC populations isolated from 2 months old mice and cultured in 5% oxygen saturation. (B): Left panel; representative histogram from flow cytometric analysis of MSC populations from (A) after staining with MitoSOX Red. Right panel: Percentage of MitoSOX Red high and low expressing cells in each MSC population. Data represent mean ± SD (n = 2). (C): Western blot of MSC cell extracts isolated from femurs and tibias of 8‐week‐old Ip6k1 −/− and Ip6k1+/+mice. (D): Flow cytometric analysis of Annexin V and PI stained MSCs from (A) showing percentage of preapoptotic (AnnexinV+/PI) and apoptotic (AnnexinV+/PI+) cells. Data are mean ± SD (n = 2). (E): Left panel; representative histogram from flow cytometric analysis of MitoSOX Red stained MSCs cultured in 5% oxygen saturation or 21% oxygen saturation. Right panel: Percentage of MitoSOX Red high expressing cells in each MSC population. Data are mean ± SD (n = 2). Student's t test (**, p < .01; ***, p < .001). Abbreviations: FSC, forward scatter cell; Ip6k1, inositol hexakisphosphate kinase 1; PE‐A, phycoerythrin; SSC, side scatter cell.

References

    1. Phinney DG. Building a consensus regarding the nature and origin of mesenchymal stem cells. J Cell Biochem 2002;38:7–12. - PubMed
    1. Crisan M, Yap S, Casteilla L, et al. A perivascular origin for mesenchymal stem cells in multiple human organs. Cell Stem Cell 2008;3:301–313. - PubMed
    1. Mendez‐Ferrer S, Michurina TV, Ferraro F, et al. Mesenchymal and haematopoietic stem cells form a unique bone marrow niche. Nature 2010;466:829–834. - PMC - PubMed
    1. Sugiyama T, Kohara H, Noda M et al. Maintenance of the hematopoietic stem cell pool by CXCL12‐CXCR4 chemokine signaling in bone marrow stromal cell niches. Immunity 2006;25:977–988. - PubMed
    1. Sacchetti B, Funari A, Michienzi S, et al. Self‐renewing osteoprogenitors in bone marrow sinusoids can organize a hematopoietic microenvironment. Cell 2007;131:324–336. - PubMed

Substances