. 2017 Jun 2;7(1):2704.
doi: 10.1038/s41598-017-02599-y.

Confounding factors of ultrafiltration and protein analysis in extracellular vesicle research

Affiliations

Confounding factors of ultrafiltration and protein analysis in extracellular vesicle research

Glenn Vergauwen et al. Sci Rep. .

Abstract

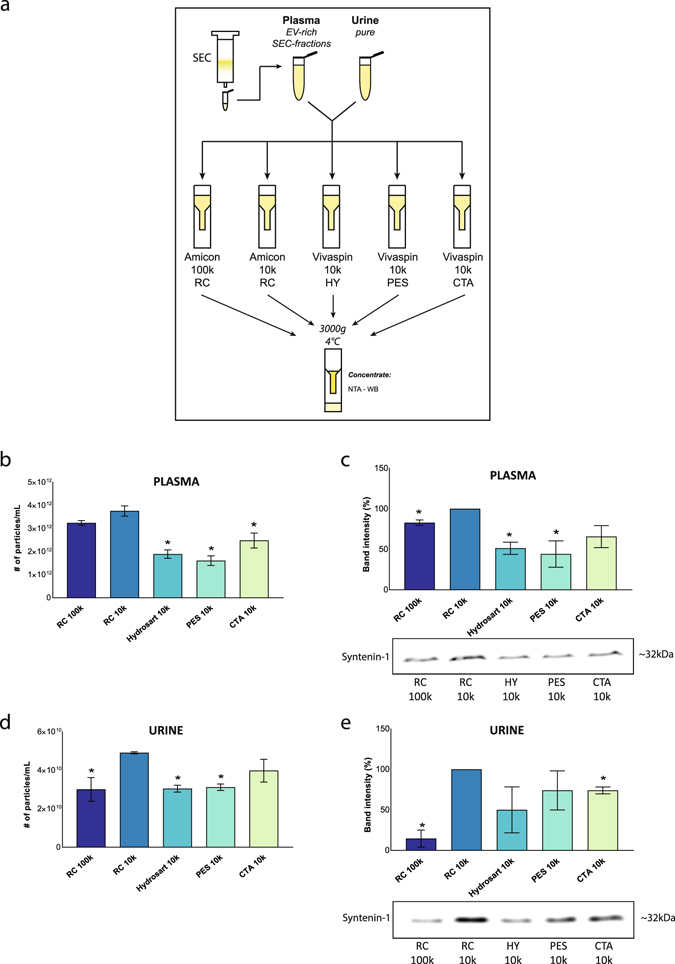
Identification and validation of extracellular vesicle (EV)-associated biomarkers requires robust isolation and characterization protocols. We assessed the impact of some commonly implemented pre-analytical, analytical and post-analytical variables in EV research. Centrifugal filters with different membrane types and pore sizes are used to reduce large volume biofluids prior to EV isolation or to concentrate EVs. We compared five commonly reported filters for their efficiency when using plasma, urine and EV-spiked PBS. Regenerated cellulose membranes with pore size of 10 kDa recovered EVs the most efficient. Less than 40% recovery was achieved with other filters. Next, we analyzed the effect of the type of protein assays to measure EV protein in colorimetric and fluorometric kits. The fluorometric assay Qubit measured low concentration EV and BSA samples the most accurately with the lowest variation among technical and biological replicates. Lastly, we quantified Optiprep remnants in EV samples from density gradient ultracentrifugation and demonstrate that size-exclusion chromatography efficiently removes Optiprep from EVs. In conclusion, choice of centrifugal filters and protein assays confound EV analysis and should be carefully considered to increase efficiency towards biomarker discovery. SEC-based removal of Optiprep remnants from EVs can be considered for downstream applications.


Conflict of interest statement

The authors declare that they have no competing interests.

Figures

Figure 1
Figure 1
Comparative analysis of centrifugal filters for protein and particle recovery of EVs in PBS. (a) 2 mL PBS spiked with GFP-positive EVs was centrifuged at 3,000 g. Concentrate and filtrate were collected. Lysates of filter membranes were used for analysing retained proteins. (b) Particle recovery was analyzed using Nanoparticle tracking analysis (n = 3, *p < 0.0001). (c) Protein recovery was assessed based on protein concentration measurements (n = 3, *p < 0.0001). (d) Retained proteins on the filter membrane were quantified (n = 3, *p < 0.0009). (e) Lysates were used for Western blot immunostaining for GFP. Mean values + SD are indicated. Significant differences were calculated using Student’s t-test with RC 10k as reference. Original immunostaining results are shown in Supplementary Fig. 10. Abbreviations: PBS: phosphate buffered saline. GFP: green fluorescent protein. EV: extracellular vesicle. RC: regenerated cellulose. HY: Hydrosart. PES: polyethersulfone. CTA: cellulose triacetate. WB: Western blot. NTA: Nanoparticle tracking analysis. PCM: protein concentration measurement. RT-qPCR: real time quantitative polymerase chain reaction. EM: electron microscopy.
Figure 2
Figure 2
Comparative analysis of centrifugal filters for EV-associated RNA recovery in PBS. Four genes present in EVs derived from MCF-7 Rab27b-GFP cell line were assessed using RT-qPCR. Results are expressed relatively to spike-in EV RNA level for (a) NOP10, (b) OST4, (c) SNRPG and (d) TOMM7. Triplicate experiments are indicated by three bars per condition. Mean values + SEM are indicated (n = 3). Abbreviations: PBS: phosphate buffered saline. EV: extracellular vesicle. RC: regenerated cellulose. HY: Hydrosart. PES: polyethersulfone. CTA: cellulose triacetate. RT-qPCR: real time quantitative polymerase chain reaction.
Figure 3
Figure 3
Comparative analysis of centrifugal filters for protein and particle recovery from plasma and urine. (a) Blood plasma was loaded on SEC column and EV-rich fractions were concentrated using five different centrifugal filters. Urine was concentrated using the same type of filters. (b) Nanoparticle Tracking Analysis (n = 2, *p < 0.05) and (c) Western blot analysis for syntenin-1 was performed on concentrated EV-rich SEC-fractions from plasma (n = 2, *p < 0.04). Western blot analysis was quantified using RC 10k as reference. (d) Concentrated urine was analyzed by Nanoparticle tracking analysis (n = 2, *p < 0.05) and (e) Western blot analysis for syntenin-1 (n = 2, *p < 0.02). Western blot analysis was quantified using RC 10k as reference in (c,e). Mean values + SD are indicated. Significant differences were calculated using Student’s t-test with RC 10k as reference. Original immunostaining results are shown in Supplementary Fig. 10. Abbreviations: SEC: size-exclusion chromatography. EV: extracellular vesicle. RC: regenerated cellulose. HY: Hydrosart. PES: polyethersulfone. CTA: cellulose triacetate. WB: Western blot. NTA: Nanoparticle tracking analysis. PCM: protein concentration measurement.
Figure 4
Figure 4
Comparison of the performance of different protein assays to measure protein concentration of BSA and EV samples. (a) Seven different protein assays (four colorimetric, three fluorometric) were compared using three different samples: BSA 400 µg/mL, BSA 200 µg/mL and EV sample. Identical sample volume was used in all assays and proper dilution to working sample volume was implemented. (b,c) All protein assays were performed on two known BSA concentrations: (b) 400 µg/mL (n = 3, *p < 0.003) and (c) 200 µg/mL (n = 3, *p < 0.05). Red dotted line indicates known BSA concentration. Mean values + SD are indicated. Significant differences were calculated using Student’s t-test with Qubit as reference. Abbreviations: EV: extracellular vesicle. BSA: bovine serum albumin. Exp.: Experiment.
Figure 5
Figure 5
Performance of different protein assays to measure protein concentration of EV samples. (a) Protein quantification for one EV sample using three colorimetric assays (MicroBCA, BCA, Bradford) was performed opposed to one fluorometric assay (Qubit) (n = 3, *p < 0.003). (b) All fluorometric assays (Qubit, FluoroProfile, NanoOrange) were tested on another EV-sample (n = 3, *p < 0.005). Mean values + SD are indicated. Significant differences were calculated using Student’s t-test with Qubit as reference. Abbreviations: EV: extracellular vesicle. BSA: bovine serum albumin.
Figure 6
Figure 6
The implementation of size-exclusion chromatography to remove Optiprep remnants from EV samples. (a) Optiprep density gradients were loaded with PBS to obtain blank EV-density fractions (F1) and with CCM to obtain EV-containing fractions (F2). EVs were retrieved by pelleting at 100,000 g (P1) or by size-exclusion chromatography (S1). Quantity of Optiprep in S1 and P1 was calculated using DC Protein assay. SEC was performed on F2 and consecutive SEC fractions (S2) were analyzed by NTA and protein analysis for GFP and CD9. (b) Comparative graph of NTA from S2 (connected line, marked area = SD) and Optiprep quantification of S1 (three differently colored bars representing three independent gradients, SD indicated). (c) Protein analysis of S2 by Western blot analysis for GFP and CD9 quantification by TRIFic CD9 assay. Original immunostaining results are shown in Supplementary Fig. 10. Abbreviations: PBS: phosphate buffered saline. CCM: concentrated conditioned medium. GFP: green fluorescent protein. EV: extracellular vesicle. WB: Western blot. NTA: Nanoparticle tracking analysis. SEC: size-exclusion chromatography.

References

    1. Simons M, Raposo G. Exosomes - vesicular carriers for intercellular communication. Curr. Opin. Cell Biol. 2009;21:575–81. doi: 10.1016/j.ceb.2009.03.007. - DOI - PubMed
    1. Melo SA, et al. Glypican-1 identifies cancer exosomes and detects early pancreatic cancer. Nature. 2015;523:177–182. doi: 10.1038/nature14581. - DOI - PMC - PubMed
    1. Taylor DD, Gercel-Taylor C. MicroRNA signatures of tumor-derived exosomes as diagnostic biomarkers of ovarian cancer. Gynecol. Oncol. 2008;110:13–21. doi: 10.1016/j.ygyno.2008.04.033. - DOI - PubMed
    1. Ciardiello C, et al. Focus on Extracellular Vesicles: New Frontiers of Cell-to-Cell Communication in Cancer. Int. J. Mol. Sci. 2016;17:175. doi: 10.3390/ijms17020175. - DOI - PMC - PubMed
    1. Lötvall J, et al. Minimal experimental requirements for definition of extracellular vesicles and their functions: a position statement from the International Society for Extracellular Vesicles. J. Extracell. Vesiclesvesicles. 2014;3:26913. doi: 10.3402/jev.v3.26913. - DOI - PMC - PubMed

Publication types