. 2017 Jul 5:59:71-79.
doi: 10.1016/j.jbiomech.2017.05.014. Epub 2017 May 22.

The role of adhesion junctions in the biomechanical behaviour and osteogenic differentiation of 3D mesenchymal stem cell spheroids

Affiliations

The role of adhesion junctions in the biomechanical behaviour and osteogenic differentiation of 3D mesenchymal stem cell spheroids

F E Griffin et al. J Biomech. .

Abstract

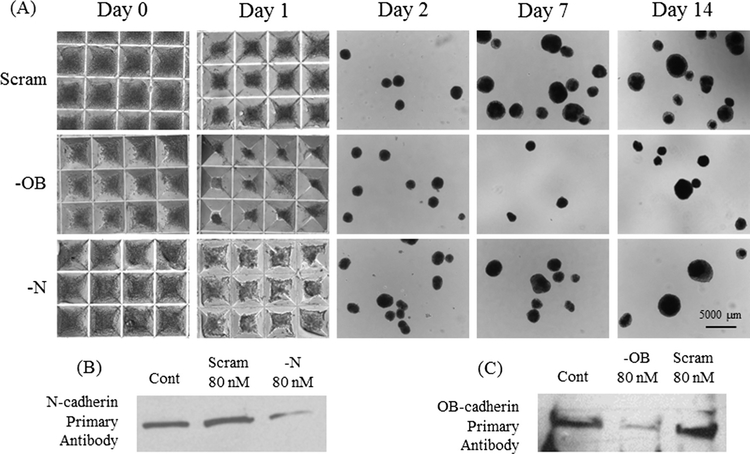
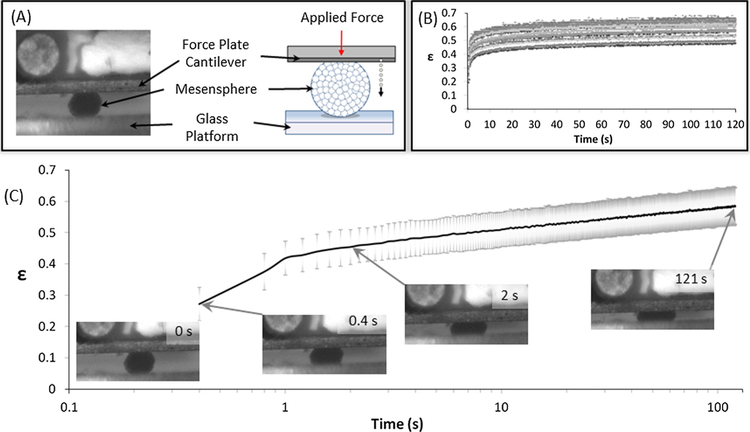
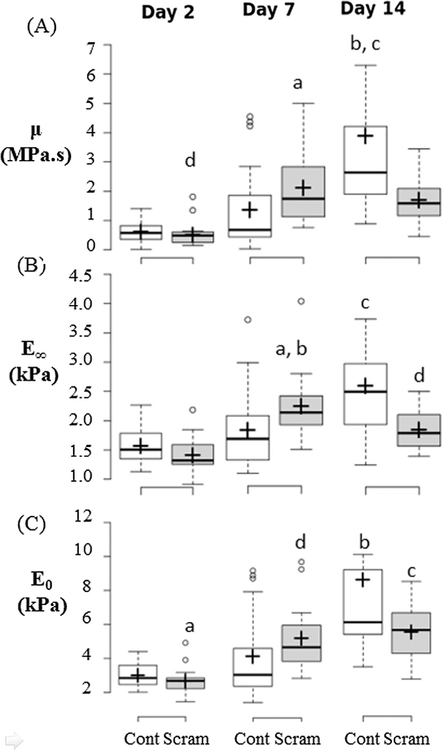
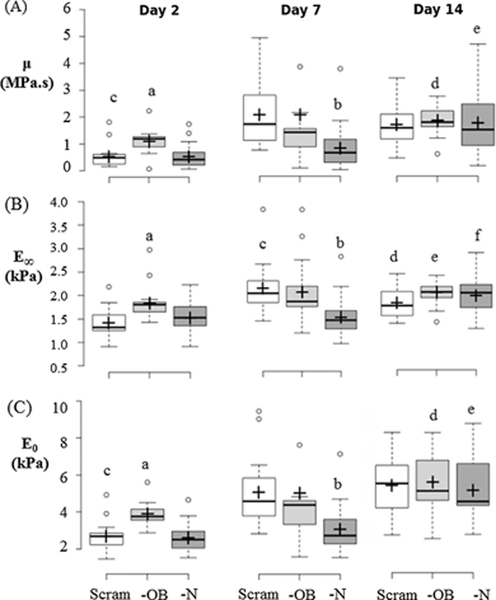
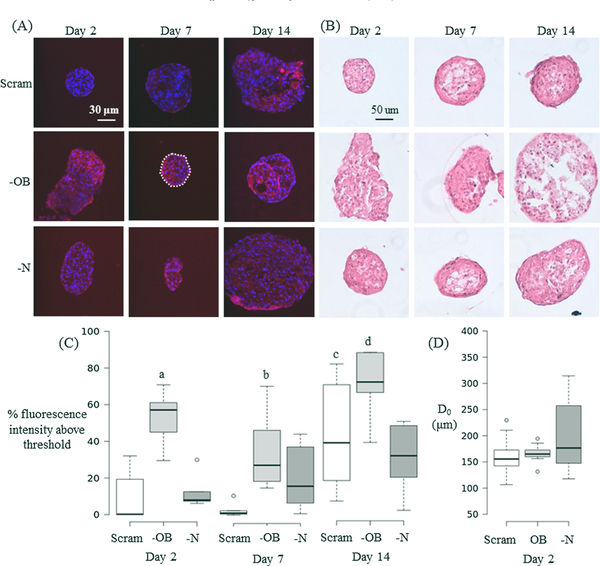
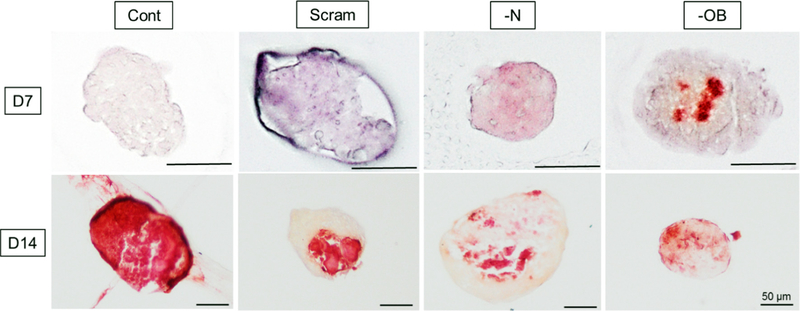
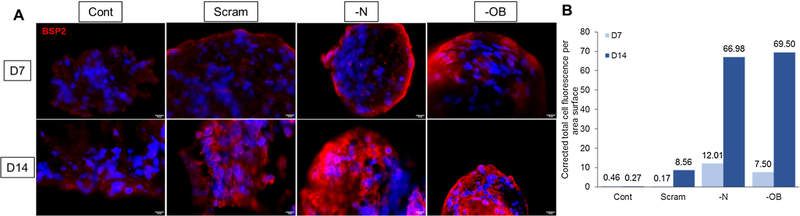
Osteogenesis of mesenchymal stem cells (MSC) can be regulated by the mechanical environment. MSCs grown in 3D spheroids (mesenspheres) have preserved multi-lineage potential, improved differentiation efficiency, and exhibit enhanced osteogenic gene expression and matrix composition in comparison to MSCs grown in 2D culture. Within 3D mesenspheres, mechanical cues are primarily in the form of cell-cell contraction, mediated by adhesion junctions, and as such adhesion junctions are likely to play an important role in the osteogenic differentiation of mesenspheres. However the precise role of N- and OB-cadherin on the biomechanical behaviour of mesenspheres remains unknown. Here we have mechanically tested mesenspheres cultured in suspension using parallel plate compression to assess the influence of N-cadherin and OB-cadherin adhesion junctions on the viscoelastic properties of the mesenspheres during osteogenesis. Our results demonstrate that N-cadherin and OB-cadherin have different effects on mesensphere viscoelastic behaviour and osteogenesis. When OB-cadherin was silenced, the viscosity, initial and long term Young's moduli and actin stress fibre formation of the mesenspheres increased in comparison to N-cadherin silenced mesenspheres and mesenspheres treated with a scrambled siRNA (Scram) at day 2. Additionally, the increased viscoelastic material properties correlate with evidence of calcification at an earlier time point (day 7) of OB-cadherin silenced mesenspheres but not Scram. Interestingly, both N-cadherin and OB-cadherin silenced mesenspheres had higher BSP2 expression than Scram at day 14. Taken together, these results indicate that N-cadherin and OB-cadherin both influence mesensphere biomechanics and osteogenesis, but play different roles.

Keywords: Biomechanics; Cadherin; Mesenchymal stem cell; Suspension culture; Viscoelastic.


Conflict of interest statement

Conflict of interest

All authors declare no financial or competing interests.

Figures

Fig. 1.
Fig. 1.
(A) Bright field images of mesensphere formation and at days 1, 2, 7 and 14. (B) Western Blot of N-cadherin siRNA (80 or 160 nM concentrations), scrambled siRNA at 80 nM concentration and untreated, control MSCs. (C) Western Blot of OB-cadherin siRNA (80 concentration), scrambled siRNA at 80 nM concentration and untreated, control MSCs. Groups: Cont: untreated control, Scram: scrambled siRNA, —N: N-cadherin siRNA, —OB: OB-cadherin siRNA.
Fig. 2.
Fig. 2.
(A) Schematic of testing equipment including cantilever for force application (red arrow) and measurement, mesensphere and glass prism. Dotted arrow indicates motion tracking of cantilever displacement during compression of mesensphere. The mesensphere is placed on a glass prism and then a constant force is applied for the duration of the test. (B) Nominal creep strain (ε) calculated as tip displacement normalised to initial mesensphere height. Data from testing of n = 19 samples of day 2 Scrambled siRNA treated mesenspheres. (C) Nominal creep strain (ε) for day 2 Scrambled siRNA treated mesenspheres. The grey borders denote standard deviation of the data. Inset are representative Brightfield images showing the initial compression of the mesensphere by the cantilever at 0, 0.4, 2 s and the mesensphere in compression at the end of the test (121 s). (For interpretation of the references to colour in this figure legend, the reader is referred to the web version of this article.)
Fig. 3.
Fig. 3.
Scrambled siRNA treatment causes decrease in mesensphere viscosity (μ), long term Young’s modulus (E) and instantaneous Young’s modulus (E0). Box Plots of (A) Viscosity (μ), (B) Long Term Young’s Modulus (E), and (C) instantaneous Young’s modulus (E0) for untreated cells (Cont) and scrambled siRNA treated cells (Scram). Significance is declared at p < 0.05. For (A) a p = 0.006 vs. day 7 Cont, b: p = 0.001 vs. day 14 Scram, c: p < 0.001 vs. days 2 & 7 Cont, d: p < 0.001 vs. days 7 & 14 Scram. (B) a p < 0.006 vs. day 7 Cont, b p < 0.001 vs. days 2 Scram, c p < 0.001 vs. days 2 & 7 Cont & day 14 Scram, d p = 0.001 vs. days 2 & 7 Scram. (C) a: p < 0.001 vs. days 7 & 14 Scram, b: p < 0.001 vs. days 2 & 7 Cont, c: p < 0.016 vs. day 7 Cont.
Fig. 4.
Fig. 4.
—OB mesensphere viscosity (μ), instantaneous Young’s modulus (E0) and long term Young’s modulus (E) are higher than Scram and —N at day 2. Box-plots of (A) μ, (B) E, and (C) E0 comparing between treatment groups during each time point or comparing between time points within each group for day 2, day 7, and day 14. Significance is declared at p < 0.05. (A) a: p < 0.001 vs day 2 Scram & —N, b: p < 0.02 vs. day 7 Scram & —OB, c: p < 0.001 vs. days 7 & 14 Scram, d: p = 0.025 vs. day 2 & 7 —OB, e: p < 0.005 vs. days 2 & 7 —N. (B) a: p < 0.009 vs. day 2 Scram & —N, b: p < 0.002 vs day 7 Scram & —OB, c: p < 0.001 vs days 2 Scram, d: p = 0.04 vs day 2 & 7 Scram, e: p = 0.037 vs day 2 —OB, day 14 SC, f: p < 0.003 vs days 2 & 7 —N. (C) a: p < 0.001 vs day 2 Scram & —N, b: p < 0.009 vs day 7 Scram & —OB, c: p < 0.001 vs days 7 & 14 Scram, d: p < 0.007 vs days 2 & 7 —OB, e: p < 0.001 vs days 2 & 7 —N. Groups: Scram: scrambled siRNA, —OB: OB-cadherin siRNA, —N: N-cadherin siRNA.
Fig. 5.
Fig. 5.
(A) Immunofluorescent images of mesenspheres at day 2, 7 and 14. The nucleus (blue) is stained with DAPI and the cytoskeleton (red) is stained with TRITC Phalloidin. The white dashed line in the central panel encloses the mesensphere area analysed for fluorescence intensity in that image. (B) H&E staining of mesenspheres at day 2, 7 and 14. (C) Boxplots of Day 2 cytoskeletal fluorescence showing % intensity above the threshold value. n = 6 samples for each group and time point. (D) Horizontal diameter of mesenspheres at day 2 measured before mechanical testing. Groups: scrambled siRNA (Scram), OB-cadherin siRNA (—OB), N-cadherin siRNA (—N). Kruskal-Wallis non-parametric tests were performed and significance is declared at p < 0.05. For (C) a < 0.002 vs. day 2 (Scram, —N). b = 0.003 vs. day 7 Scram. c = 0.023 vs. days 2 & 7 Scram. d < 0.02 vs. 7 (—OB) and day 14 (—N). (For interpretation of the references to colour in this figure legend, the reader is referred to the web version of this article.)
Fig. 6.
Fig. 6.
Alizarin Red staining of mesenspheres at day 7 and day 14 for all four treatment groups: Groups: Scram: scrambled siRNA, —OB: OB-cadherin siRNA, —N: N-cadherin siRNA. Scale bars represent 50 μm.
Fig. 7.
Fig. 7.
BMP2 immunofluorescent staining of mesenspheres at day 7 and day 14. Groups: Scram: scrambled siRNA, —OB: OB-cadherin siRNA, —N: N-cadherin siRNA. Scale bars represent 10 μm. The corrected total cell fluorescence per area surface was measured for each condition (B).

Similar articles

Cited by

References

    1. Baraniak P, McDevitt T, 2012. Scaffold-free culture of mesenchymal stem cell spheroids in suspension preserves multilineage potential. Cell Tissue Res. 347 (3), 701–711. - PMC - PubMed
    1. Chopra A, Tabdanov E, Patel H, Janmey PA, Kresh JY, 2011. Cardiac myocyte remodeling mediated by N-cadherin-dependent mechanosensing. Am. J. Physiol. -Heart Circul. Physiol 300 (4), H1252. - PMC - PubMed
    1. Cook MM, Futrega K, Osiecki M, Kabiri M, Kul B, Rice A, Atkinson K, Brooke G, Doran M, 2012. Micromarrows—three-dimensional coculture of hematopoietic stem cells and mesenchymal stromal cells. Tissue Eng. Part C: Methods 18 (5), 319–328. - PubMed
    1. Darling EM, Topel M, Zauscher S, Vail TP, Guilak F, 2008. Viscoelastic properties of human mesenchymally-derived stem cells and primary osteoblasts, chondrocytes, and adipocytes. J. Biomech 41 (2), 454–464. - PMC - PubMed
    1. Engler AJ, Griffin MA, Sen S, Bönnemann CG, Sweeney HL, Discher DE, 2004. Myotubes differentiate optimally on substrates with tissue-like stiffness pathological implications for soft or stiff microenvironments. J. Cell Biol. 166 (6), 877–887. - PMC - PubMed