. 2017 Jun 2;7(1):2724.
doi: 10.1038/s41598-017-02882-y.

Hsp70 facilitates trans-membrane transport of bacterial ADP-ribosylating toxins into the cytosol of mammalian cells

Affiliations

Hsp70 facilitates trans-membrane transport of bacterial ADP-ribosylating toxins into the cytosol of mammalian cells

Katharina Ernst et al. Sci Rep. .

Abstract

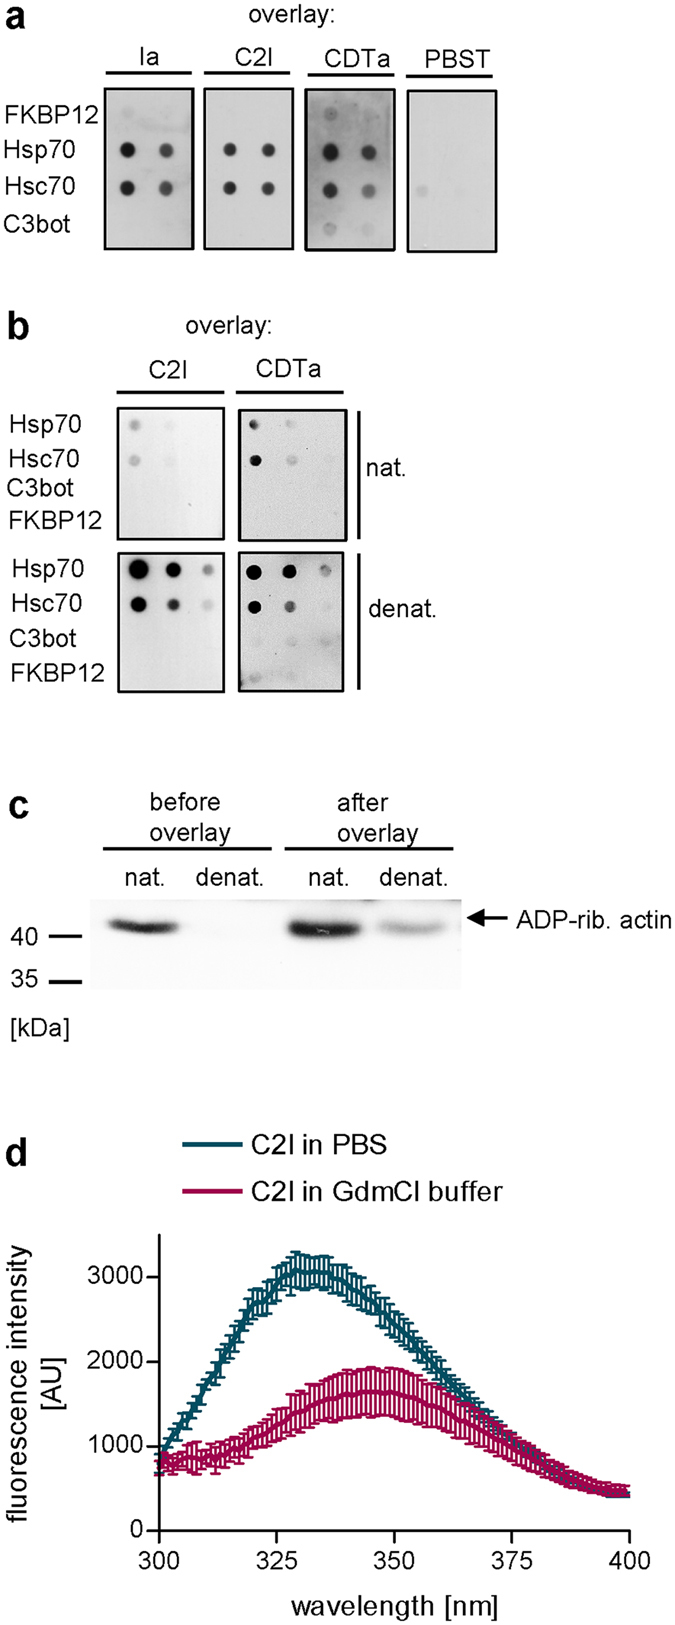
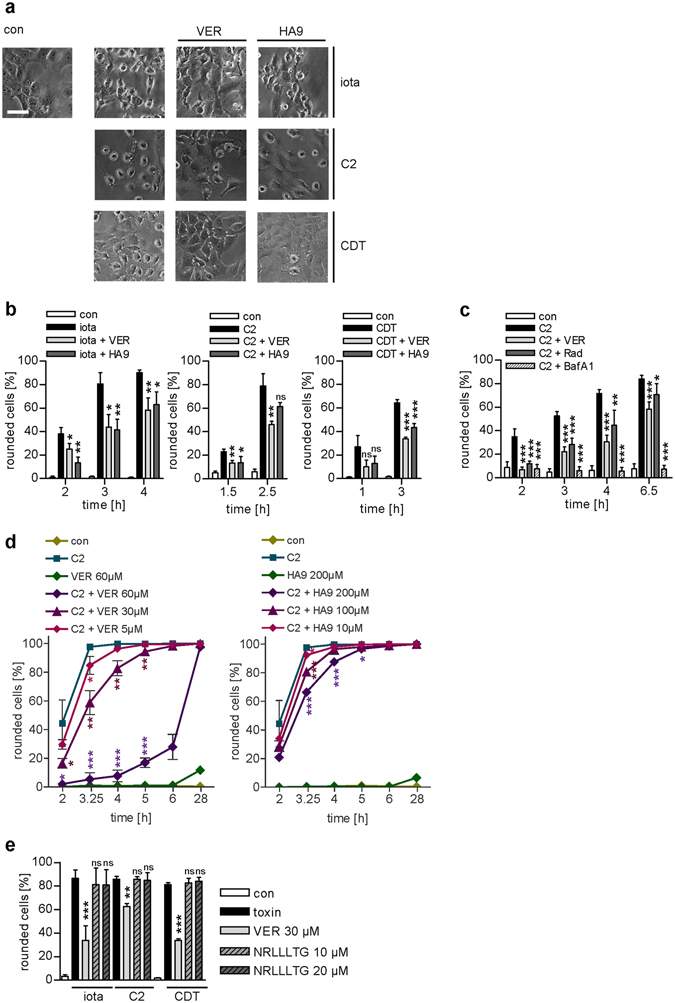
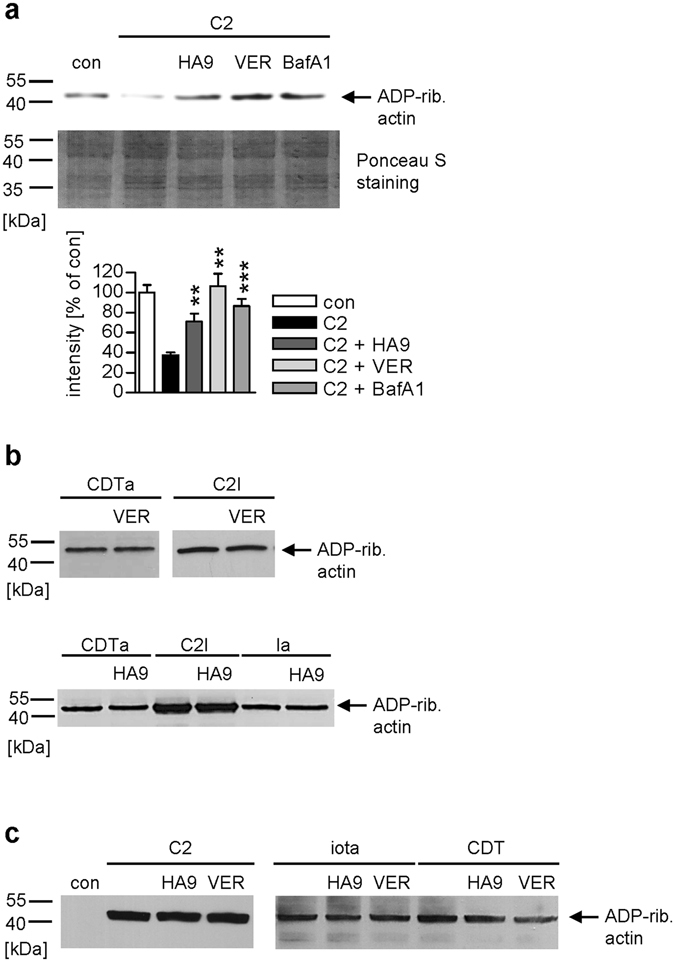
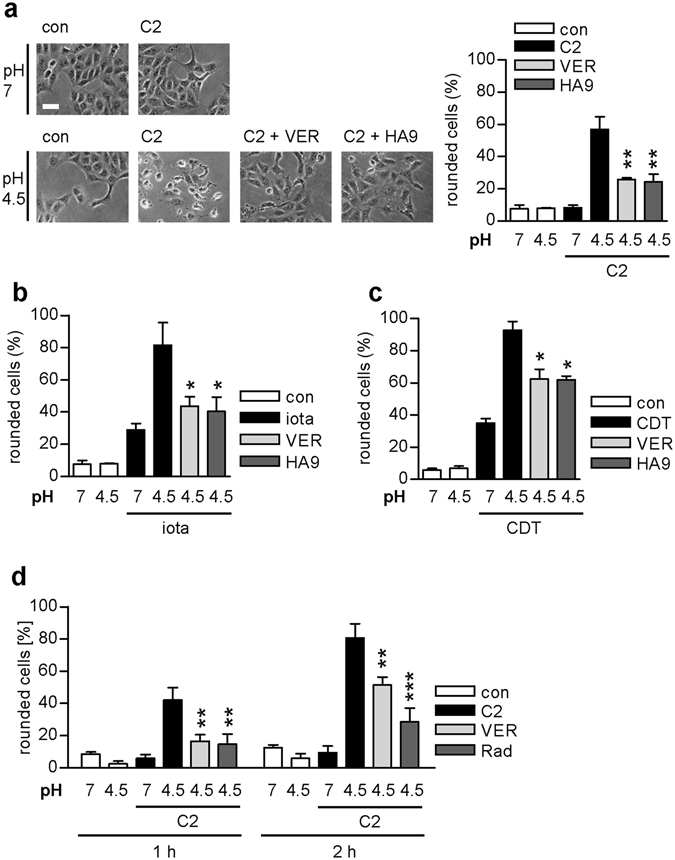
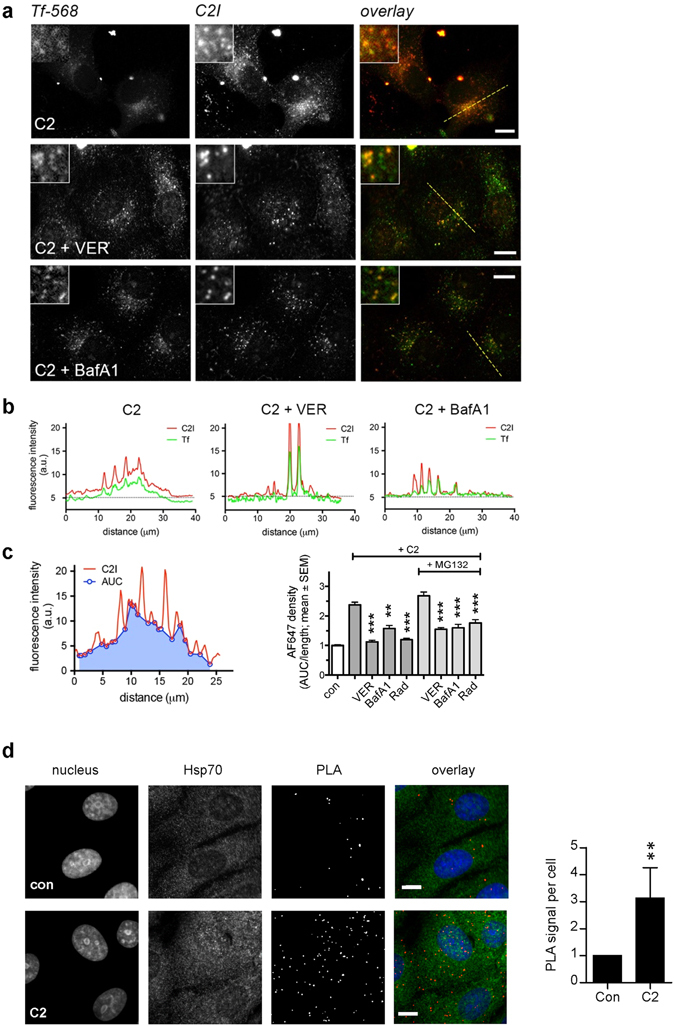
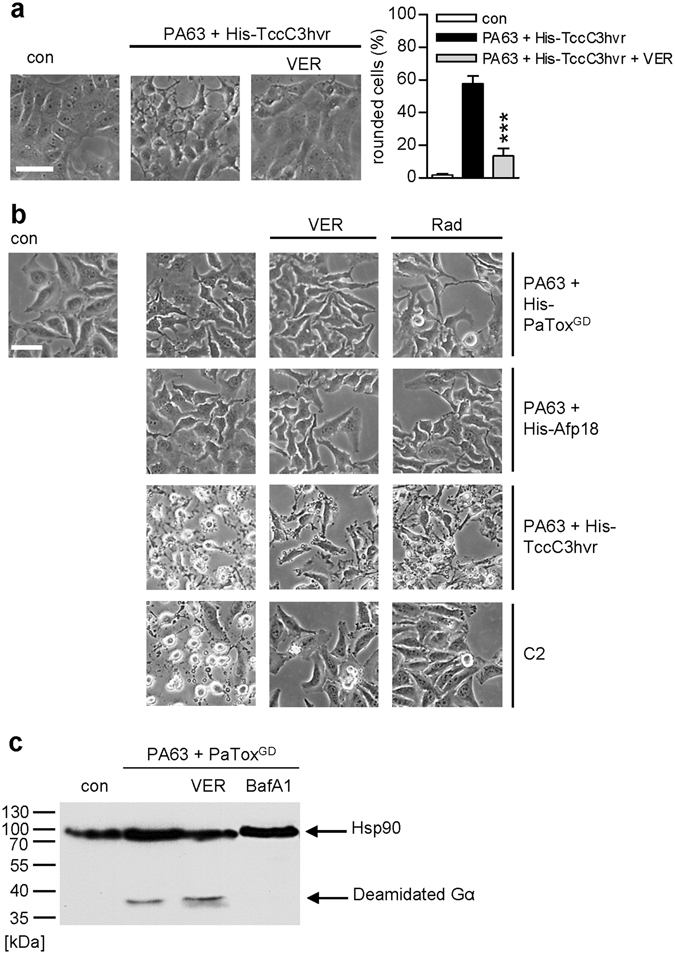
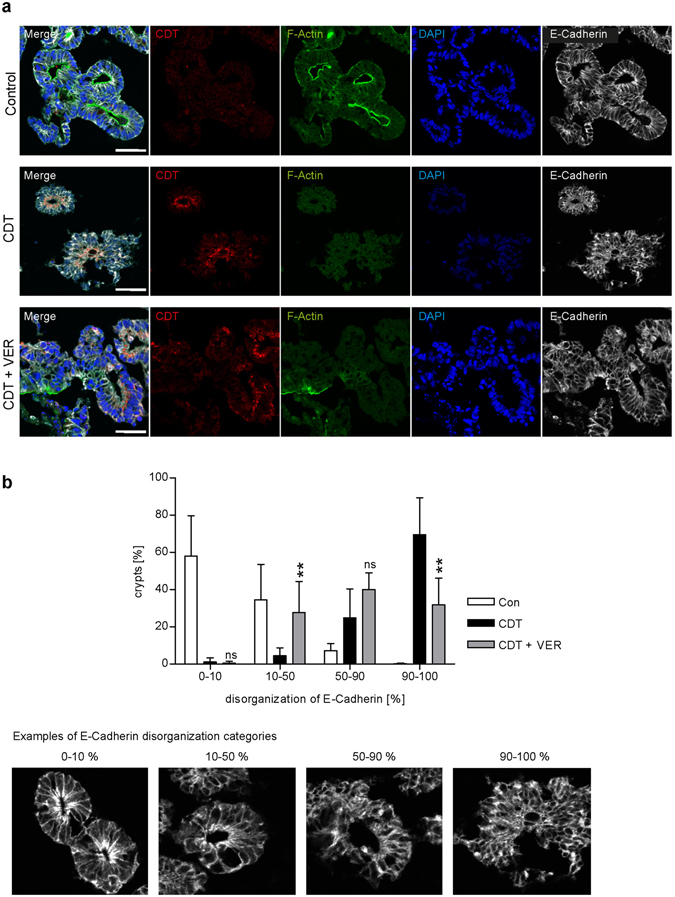
Binary enterotoxins Clostridium (C.) botulinum C2 toxin, C. perfringens iota toxin and C. difficile toxin CDT are composed of a transport (B) and a separate non-linked enzyme (A) component. Their B-components mediate endocytic uptake into mammalian cells and subsequently transport of the A-components from acidic endosomes into the cytosol, where the latter ADP-ribosylate G-actin resulting in cell rounding and cell death causing clinical symptoms. Protein folding enzymes, including Hsp90 and peptidyl-prolyl cis/trans isomerases facilitate transport of the A-components across endosomal membranes. Here, we identified Hsp70 as a novel host cell factor specifically interacting with A-components of C2, iota and CDT toxins to facilitate their transport into the cell cytosol. Pharmacological Hsp70-inhibition specifically prevented pH-dependent trans-membrane transport of A-components into the cytosol thereby protecting living cells and stem cell-derived human miniguts from intoxication. Thus, Hsp70-inhibition might lead to development of novel therapeutic strategies to treat diseases associated with bacterial ADP-ribosylating toxins.


Conflict of interest statement

The authors declare that they have no competing interests.

Figures

Figure 1
Figure 1
(a) Hsp70 and Hsc70 directly bind to C2I, Ia and CDTa in vitro. Decreasing concentrations of recombinant Hsp70 and Hsc70 were spotted onto a membrane using the dot blot system. For control, FKBP12 and C. botulinum C3 protein were spotted. Subsequently, the membrane was blocked, cut and probed with biotin-labeled proteins C2I, Ia, CDTa (200 ng/ml) or with PBST for control. Bound C2I, Ia and CDTa were detected with Strep-POD using the ECL system. Equal amounts of spotted protein was confirmed by Ponceau S staining (not shown). The dot blot panel was cropped for presentation purposes only. (b) Denaturation of enzyme components enhances binding to Hsc/Hsp70. The experiment was conducted as described in (a) except that enzyme components were denatured or left untreated for native conformation prior to overlay. The dot blot panel was cropped for presentation purposes only. (c) Denaturation of C2I is confirmed by loss of enzyme activity. Samples from overlay solutions prepared in (b) were taken prior and after 1 h overlay incubation and tested for in vitro enzyme activity. Therefore, samples were incubated with cell lysate in the presence of biotin-NAD+. Biotinylated i.e. ADP-ribosylated actin was detected by Western blotting. Ponceau S staining demonstrates equal amounts of protein (not shown). The Western blot panel was cropped for presentation purposes only. (d) Conformational changes of C2I induced by GdmCl. Tryptophan fluorescence scan was performed to measure conformational changes of C2I by GdmCl compared to PBS.
Figure 2
Figure 2
The Hsc/Hsp70 inhibitor VER and the specific Hsp70 inhibitor HA9 inhibit intoxication of Vero cells with iota, C2 and CDT toxin. Vero cells were pre-incubated for 30 min at 37 °C with VER (30 µM) or HA9 (100 µM) or left untreated for control. Subsequently, iota toxin (15 ng/ml Ia plus 30 ng/ml Ib), C2 toxin (50 ng/ml C2I plus 100 ng/ml C2IIa) and CDT (15 ng/ml CDTa plus 30 ng/ml CDTb) were added. (a) Pictures show the toxin-induced morphological changes after 3 h for iota toxin, after 2.5 h for C2 toxin and after 1 h for CDT intoxication. Bar = 50 µm. (b) The percentage of rounded cells was determined from images at the indicated time points. Values are given as mean ± SD (n = 3). Significance was tested by using the Student’s t test and values refer to samples treated with toxin only (ns = not significant, *p < 0.05, **p < 0.01, ***p < 0.001). (c) Inhibition of proteasomal degradation does not affect inhibitory effect of VER on C2 intoxication. Vero cells were pre-incubated for 1 h with the proteasome inhibitor MG132 (30 µM). VER (30 µM), Rad (20 µM) and BafA1 (100 nM) were added for additional 30 min. Subsequently, cells were challenged with C2 toxin (50 ng/ml C2I plus 100 ng/ml C2IIa). Pictures were taken and analyzed as described in (b). (d) Concentration-dependent inhibition of C2 toxin intoxication by VER and HA9. Cells were treated as described in (b) 250 ng/ml C2I plus 500 ng/ml C2IIa were used. (e) Non-cell permeable Hsp70-inhibitory peptide NRLLLTG does not inhibit intoxication with iota, C2 or CDT toxins. Vero cells were pre-incubated with NRLLLTG (10 or 20 µM) for 30 min and then challenged with the toxins for 2 h. Rounded cells were counted as described above. Values are given as mean ± SD (n = 3). Significance was tested by using the Student’s t test and values refer to samples treated with toxin only (ns = not significant, *p < 0.05, **p < 0.01, ***p < 0.001).
Figure 3
Figure 3
(a) Effect of VER and HA9 on the ADP-ribosylation of actin in C2 toxin-treated cells. Vero cells were pre-incubated with VER (30 µM) or HA9 (100 µM) for 30 min at 37 °C. For control, cells were pre-incubated with BafA1 (30 nM) or left untreated. Subsequently, C2 toxin (75 ng/ml C2I plus 150 ng/ml C2IIa) was added for 4 h at 37 °C. Then, cells were lysed and all samples incubated with fresh C2I (300 ng) and biotin-NAD+ for 30 min at 37 °C. Biotinylated, i.e. ADP-ribosylated (ADP-rib.) actin was detected by Western blotting and intensity of signals quantified by densitometry. Values show the percentage of signal referring to untreated cells (con) and are normalized on the amount of whole lysate protein and are given as mean ± SEM (n = 4). Significance was tested by using the Student’s t test and values refer to samples treated with toxin only (**p < 0.01, ***p < 0.001). The Western blot panel was cropped for presentation purposes only. (b) VER and HA9 do not inhibit enzyme activity of iota, C2 or CDT toxin. Vero cell lysate was pre-incubated with 30 µM VER or 100 µM HA9 for 30 min at 37 °C. For control, cell lysates were left untreated. Subsequently, C2I, Ia or CDTa (each 200 ng) and biotin-NAD+ were added for 20 min at 37 °C. Biotin-labeled i.e. ADP-ribosylated actin was detected as described before. The Western blot panel was cropped for presentation purposes only. (c) VER and HA9 do not inhibit the receptor binding of iota, C2 or CDT toxin. After pre-incubation with HA9 (100 µM) or VER (30 µM), Vero cells were cooled to 4 °C and C2 toxin (100 ng/ml C2I plus 200 ng/ml C2IIa), iota toxin (100 ng/ml Ia plus 200 ng/ml Ib) and CDT (100 ng/ml CDTa plus 200 ng/ml CDTb) were added for 30 min. For control, cells were left untreated. After washing, the cell-bound C2, iota and CDT toxin were detected by analyzing the ADP-RT activity of the cell-associated C2I, Ia and CDTa in vitro via biotin-NAD+ and Western blotting. The Western blot panel was cropped for presentation purposes only.
Figure 4
Figure 4
Pharmacological inhibition of Hsp/Hsc70 activity inhibits the pH-dependent membrane translocation of the enzyme components of iota, C2 and CDT toxin into the cytosol. For the toxin translocation assay, Vero cells were pre-incubated with HA9 (100 µM) or VER (30 µM) in combination with BafA1 (100 nM) and for control with BafA1 (100 nM) alone for 30 min at 37 °C. After binding of C2 toxin (100 ng/ml C2I plus 200 ng/ml C2IIa) (a), iota toxin (200 ng/ml Ia plus 200 ng/ml Ib) (b), or CDT toxin (150 ng/ml CDTa plus 150 ng/ml CDTb) (c) at 4 °C, cells were challenged with warm acidic medium to allow the direct translocation of the enzyme components across the cytoplasmic membrane into the host cell cytosol. For control, cells were incubated with neutral medium. Subsequently, cells were further incubated at 37 °C and cell morphology was monitored. The percentage of rounded cells was determined from images taken after 2 h for C2 and iota toxin and after 1.5 h for CDT. (d) Inhibition of pH-dependent membrane translocation of C2I by VER is not impaired by inhibition of proteasomal degradation. Vero cells were pre-incubated with MG132 (30 µM) for 1 h. Subsequently, the experiment was conducted as described in (a). 100 ng/ml C2I and 200 ng/ml C2IIa were used. Values are given as mean ± SD (n = 3). Bar = 50 µm. Significance was tested by using the Student’s t test and values refer to samples treated with toxin only under acidic conditions (ns = not significant, *p < 0.05, **p < 0.01, ***p < 0.001).
Figure 5
Figure 5
Hsp70 inhibition by VER leads to enhanced co-localization of C2I with early endosomes and a reduced amount of C2I in the cytosol of target cells. (a) Vero cells were pre-incubated with 30 µM VER, 100 nM BafA1 or left untreated. Subsequently, cells were challenged with an enzymatic inactive C2 toxin mutant (1 µg/ml C2IE387/389Q plus 1 µg/ml C2IIa) in the presence of 10 µg/ml transferrin-Alexa Fluor 568 for 1 h at 37 °C. C2I and transferrin i.e. early endosomes were visualized by fluorescence microscopy. Bars = 10 μm. (b) Plot profiles along the dotted lines in (a) illustrate increased C2I intensity in Tf-568 positive structures and that the diffuse cytosolic labeling is reduced in cells treated with either VER or BafA1. (c) Quantitative analysis of the average cytosolic C2I signal, excluding endosomal peaks. Areas under the curve (AUCs) were calculated and corrected for length of the line (AUC/length) resulting in the cytosolic C2I density. The experiment was also performed with an additional pre-incubation of 1 h with 30 µM MG132, an inhibitor of proteasomal degradation. Data represent means from 25–130 cells per condition form 2–5 independent replicates. (d) C2I interacts with Hsp70 in cultured cells. Vero cells were incubated with C2 toxin (1 µg C2I plus 1 µg C2IIa) or left untreated for control for 1 h at 37 °C. Subsequently, the fluorescence-based PLA assay was performed according to the manufacturer’s manual. The nucleus was stained with Hoechst. PLA signal represents one protein interaction event of C2I and Hsp70. Bars = 10 µm. The amount of PLA signals per nucleus was quantified by a software using a computer-vision algorithm based on OpenCV. Values are normalized to control samples and are given as mean ± SEM (n = 5 independent experiments, at least 100 cells per sample per experiment were analyzed). Significance was tested by using the Mann-Whitney test (**p < 0.05).
Figure 6
Figure 6
VER interferes with the uptake of an isolated ADP-RT domain (a) but has no inhibitory effect on uptake of isolated glycosyltransferases or deamidases (b). (a) Vero cells were pre-incubated with VER (30 µM) for 30 min and then challenged with PA63 (100 ng/ml) plus His-TccC3hvr (100 ng/ml) for 3 h at 37 °C. The percentage of rounded cells was determined. Values are given as mean ± SD (n = 3). Bar = 50 µm. Significance was tested by using the Student’s t test and values refer to samples treated with toxin only (***p < 0.001). (b) HeLa cells were pre-incubated with 30 µM VER (second lane), 20 µM Rad (third lane) or left untreated for negative control (=con) and positive control (first lane, cells treated with toxin only) for 30 min. Subsequently, cells were challenged with 500 ng/ml PA63 plus 370 ng/ml His-PaToxGD (first row) or 500 ng/ml PA63 plus 370 ng/ml His-Afp18 (second row) for 1 h or with 200 ng/ml PA63 plus 100 ng/ml His-TccC3hvr (third row) or 50 ng/ml C2I plus 100 ng/ml C2IIa (fourth row) for 3 h at 37 °C. Bar = 50 µm . (c) VER has no inhibitory effect on the deamidation status of cells treated with PA63 plus His-PaToxGD. HeLa cells were pre-incubated with VER (30 µM) or BafA1 (30 nM) or left untreated for control. Subsequently, 125 ng/ml PA63 plus 93 ng/ml His-PaToxGD were added. After 4 h, cells were washed, lysed and samples were subjected to SDS-PAGE. In Western Blot analysis, the modified, i.e. deamidated, Gα was detected with a deamidation-specific antibody (anti-GαQ205). Equal amounts of protein were confirmed by Hsp90 detection. The Western blot panel was cropped for presentation purposes only.
Figure 7
Figure 7
VER reduces the CDT-induced destruction of F-actin and disorganization of E-cadherin in human miniguts. (a) Miniguts were pre-incubated for 30 min at 37 °C with 60 µM VER or left untreated for controls. CDTa (500 ng/ml) plus CDTb (1000 ng/ml) were added for 3 h. After washing and extraction from matrigel, miniguts were fixed and frozen sections were prepared. CDTa, E-cadherin, nuclei and F-actin were stained and visualized by confocal microscopy. Bar = 50 µm. (b) Quantitative analysis of disorganization of E-cadherin. The degree of disorganization of E-cadherin was categorized in four groups. Every visible crypt structure was analyzed and assigned to one of the categories for which examples are given below. Data was collected from two individual experiments (n = 2, at least 28 pictures per sample were analyzed) and blinded analysis of each experiment was performed by two individual persons. Significance was tested by using the Student’s t test and values refer to samples treated with toxin only (ns = not significant, *p < 0.05, **p < 0.01, ***p < 0.001).

Similar articles

Cited by

References

    1. Gerding DN, Johnson S, Rupnik M, Aktories K. Clostridium difficile binary toxin CDT: mechanism, epidemiology, and potential clinical importance. Gut Microbes. 2014;5:15–27. doi: 10.4161/gmic.26854. - DOI - PMC - PubMed
    1. Kurazono H, Hosokawa M, Matsuda H, Sakaguchi G. Fluid accumulation in the ligated intestinal loop and histopathological changes of the intestinal mucosa caused by Clostridium botulinum C2 toxin in the pheasant and chicken. Res. Vet. Sci. 1987;42:349–353. - PubMed
    1. Ohishi I. Lethal and vascular permeability activities of botulinum C2 toxin induced by separate injections of the two toxin components. Infect. Immun. 1983;40:336–339. - PMC - PubMed
    1. Songer JG. Clostridial enteric diseases of domestic animals. Clin. Microbiol. Rev. 1996;9:216–234. - PMC - PubMed
    1. Aktories K, et al. Botulinum C2 toxin ADP-ribosylates actin. Nature. 1986;322:390–392. doi: 10.1038/322390a0. - DOI - PubMed

Publication types

LinkOut - more resources