

Race and nativity are major determinants of tuberculosis in the U.S.: evidence of health disparities in tuberculosis incidence in Michigan, 2004-2012
- PMID: 28578689
- PMCID: PMC5457589
- DOI: 10.1186/s12889-017-4461-y
Race and nativity are major determinants of tuberculosis in the U.S.: evidence of health disparities in tuberculosis incidence in Michigan, 2004-2012
Abstract
Background: The incidence of TB in Michigan was 1.5 per 100,000 people in 2012, roughly half the U.S. incidence. Despite successes in TB control, disparities in TB still exist in Michigan, particularly by race, age, and nativity. A major challenge in understanding disparities in TB burden is distinguishing between TB cases resulting from recent transmission and those resulting from reactivation of latent TB infection, information critical to tailoring control strategies. We examined nine-year trends in tuberculosis (TB) incidence patterns for the entire population of Michigan, and within demographic subgroups.
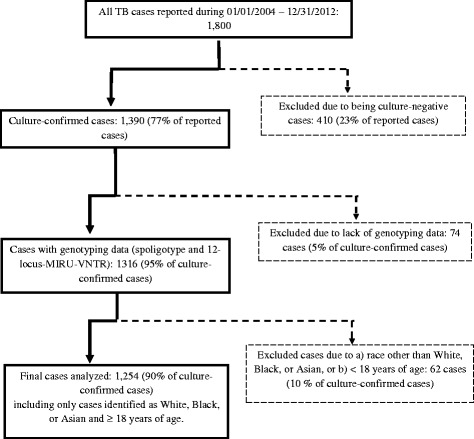
Methods: Using a cross-sectional study of TB surveillance data, we analyzed 1254 TB cases reported in Michigan during 2004-2012. Cases included were those for whom both spoligotyping and 12-locus-MIRU-VNTR results were available. Using a combination of the genotyping information and time of diagnosis, we then classified cases as resulting from either recent transmission or reactivation of latent TB infection. We used multivariable negative binomial regression models to study trends in the TB incidence rate for the entire population and by race, nativity, gender, and age.
Results: Overall, the incidence rate of TB declined by an average of 8% per year-11% among recently transmitted cases, and 9% among reactivation cases. For recently transmitted disease, Blacks had an average incidence rate 25 times greater than Whites, after controlling for nativity, gender, and age. For disease resulting from latent TB infection Asians had an average incidence rate 24 times greater than Whites, after controlling for nativity, gender, and age.
Conclusions: Disparities in incidence persist despite ongoing TB control efforts. Greater disparities were observed by race and nativity demonstrating some of the ways that TB incidence is socially patterned. Reducing these disparities will require a multi-faceted approach encompassing the social and environmental contexts of high-risk populations.
Keywords: Health disparities; Infectious disease; Social determinants of health; Tuberculosis.
Figures

References
Publication types
MeSH terms
Grants and funding
LinkOut - more resources
Full Text Sources
Other Literature Sources
Medical
