. 2017 Jun 2;12(1):93.
doi: 10.1186/s13014-017-0823-y.

Treating lung cancer with dynamic conformal arc therapy: a dosimetric study

Affiliations

Treating lung cancer with dynamic conformal arc therapy: a dosimetric study

Primož Peterlin et al. Radiat Oncol. .

Abstract

Background: Lung cancer patients are often in poor physical condition, and a shorter treatment time would reduce their discomfort. Dynamic conformal arc therapy (DCAT) offers a shorter treatment time than conventional 3D conformal radiotherapy (3D CRT) and is usually available even in departments without inverse planning possibilities. We examined its suitability as a treatment modality for lung cancer patients.

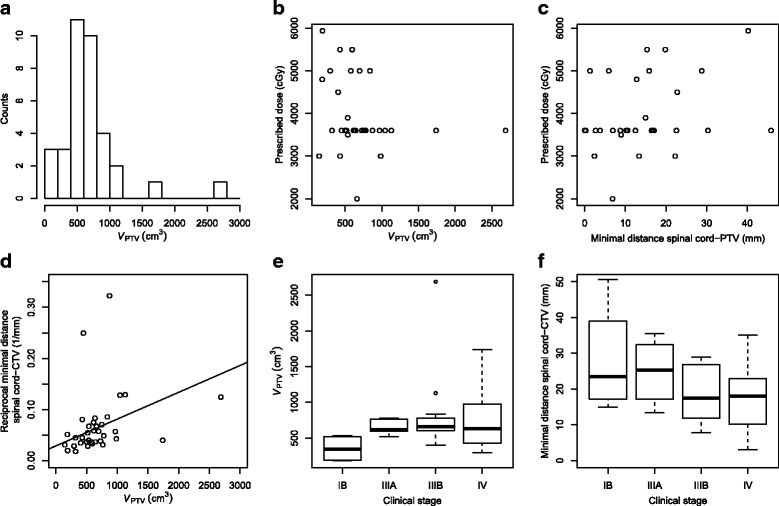
Methods: On a cohort of 35 lung cancer patients, relevant dosimetric parameters were compared in respective DCAT and 3D CRT treatment plans. Radiochromic film dosimetry in an anthropomorphic phantom was used to compare both DCAT and 3D CRT dose distributions against their planned counterparts.

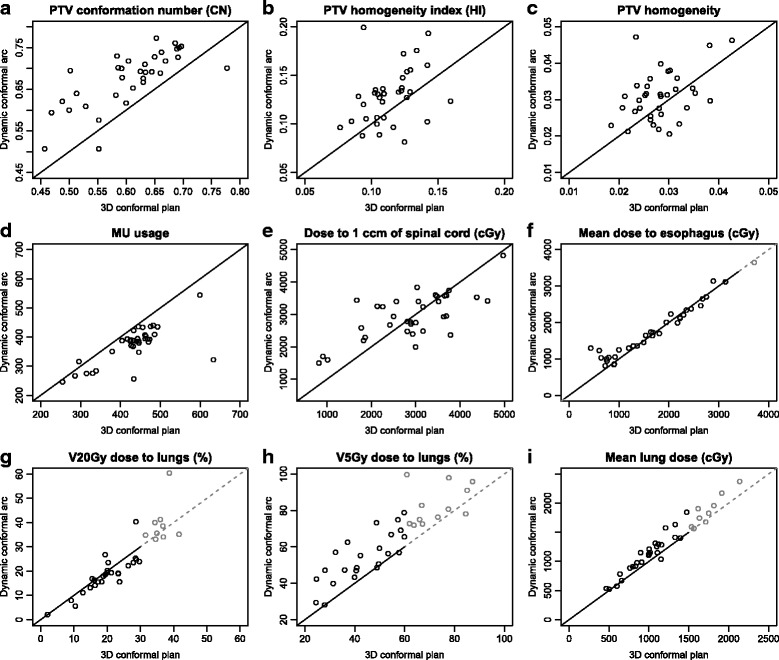
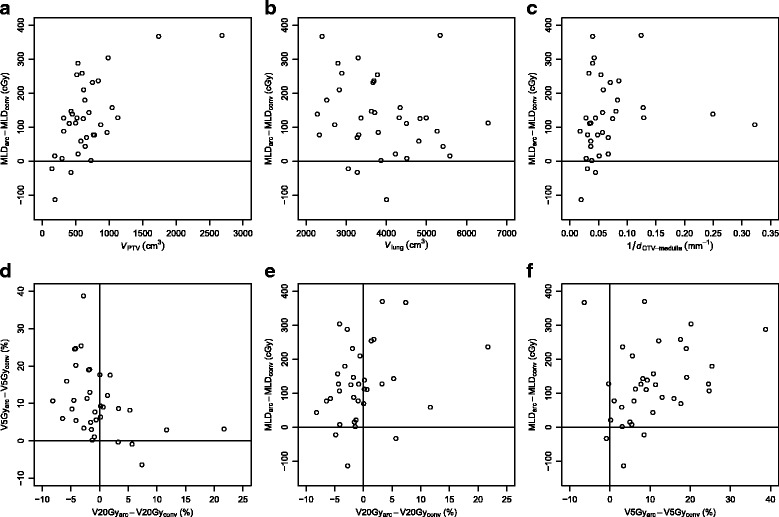
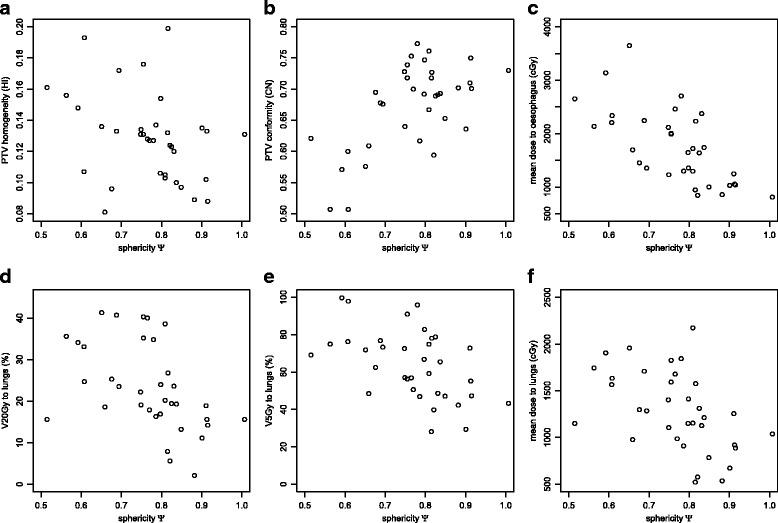
Results: In comparison with their 3D CRT counterparts, DCAT plans equal or exceed the agreement between the calculated dose and the dose measured using film dosimetry. In dosimetric comparison, DCAT performed significantly better than 3D CRT in dose conformity to PTV and the number of monitor units used per plan, and significantly worse in dose homogeneity, mean lung dose and lung volume exposed to 5 Gy or more (V5Gy). No significant difference was found in the V20Gy value to lung, dose to 1 cm3 of spinal cord, and the mean dose to oesophagus. Improvements in V20Gy and V5Gy were found to be negatively correlated. DCAT plans differ from 3D CRT by exhibiting a moderate negative correlation between target volume sphericity and dose homogeneity.

Conclusions: With respect to the agreement between the planned and the irradiated dose distribution, DCAT appears at least as reliable as 3D CRT. In specific conditions concerning the patient anatomy and treatment prescription, DCAT may yield more favourable dosimetric parameters. On average, however, conventional 3D CRT usually obtains better dosimetric parameters. We can thus only recommend DCAT as a complementary technique to the conventional 3D CRT.

Keywords: Dynamic conformal arc therapy; Film dosimetry; Lung cancer.


Figures

Fig. 1
Fig. 1
The metrics characterizing target size, its location with respect to the spinal cord, and its correlation with the clinical stage of the patients. Distribution of PTV by volume (a), the correlation between the PTV volume and the prescribed dose to PTV (b), the correlation between the minimal distance between PTV and the spinal cord and the prescribed dose to PTV (c), the correlation between the PTV volume and the reciprocal value of the distance between CTV and the spinal cord (d), and two boxplots showing the correlation between the clinical stage of the patient and their respective PTV volume (e) and the minimal distance between CTV and the spinal cord (f)
Fig. 2
Fig. 2
A comparison of the gamma index analysis for a 3D CRT (left column) and DCAT treatment plans (right column). Top row: irradiated radiochromic films (a, b), middle row: the corresponding dose planes exported from the treatment planning system (c, d), bottom row: gamma index maps (e, f). Blue-coloured regions correspond to areas with gamma index <1, red-coloured regions correspond to areas with gamma index >1
Fig. 3
Fig. 3
A comparison of the gamma index analysis for assessing the agreement between the measured and the calculated dose distribution. Using global D max, 10% dose threshold, 1 mm positional tolerance, and 2, 3, 4 and 5% dose tolerance, the ratio of points passing the γ<1 criterion was computed for conventional 3D CRT treatment plans (a) and DCAT treatment plans (b)
Fig. 4
Fig. 4
A comparison of several dosimetric parameters (PTV conformity (a), PTV homogeneity (b, c), MU usage (d), dose to the spinal cord (e), oesophagus (f) and lungs, g-i) in both types of treatment plan. An individual patient case is represented as a point in the diagram; its x-coordinate represents the parameter value in the conventional 3D CRT plan, and its y-coordinate represents the parameter value in the DCAT plan. The points shown in gray correspond to cases in which neither treatment plan meets the planning restrictions
Fig. 5
Fig. 5
The dependence of the difference of the mean lung dose obtained by DCAT (MLDDCAT) and by the conventional 3D CRT treatment plan (MLD3DCRT) on the volume of the PTV (a), total lung volume (b), and the minimal distance between CTV and the spinal cord (c). The correlation between the differences in V5Gy and V20Gy (d), MLD and V20Gy (e), and MLD and V5Gy (f). An individual patient case is represented as a point in the diagram; its x- and y-coordinates represent its relevant parameter values
Fig. 6
Fig. 6
The dependence of the PTV dose homogeneity expressed as HI (a), PTV dose conformity CN (b), mean dose to the oesophagus (c), V20Gy and V5Gy values for lungs (d, e), and mean dose to the lungs (f) on the target volume sphericity Ψ. All dosimetric parameters were calculated using DCAT treatment plans. An individual patient case is represented as a point in the diagram; its x- and y-coordinates represent its relevant parameter values
Fig. 7
Fig. 7
The dependence of the PTV dose homogeneity expressed as HI (a, b) and PTV dose conformity CN (c, d) on either the isocentre displacement from the patient origin in the transversal plane and the minimal distance between CTV and external contour. All dosimetric parameters were calculated using DCAT treatment plans. An individual patient case is represented as a point in the diagram; its x- and y-coordinates represent its relevant parameter values

References

    1. Torre LA, Bray F, Siegel RL, Ferlay J, Lortet-Tieulent J, Jemal A. Global cancer statistics, 2012. CA Cancer J Clin. 2015;65(2):87–108. doi: 10.3322/caac.21262. - DOI - PubMed
    1. Cancer Registry of Slovenia . Cancer in Slovenia 2012. Ljubljana: Institute of Oncology Ljubljana; 2015.
    1. Bortfeld T, Jokivarsi K, Goitein M, Kung J, Jiang SB. Effects of intra-fraction motion on IMRT dose delivery: statistical analysis and simulation. Phys Med Biol. 2002;47(13):2203–20. doi: 10.1088/0031-9155/47/13/302. - DOI - PubMed
    1. Jiang SB, Pope C, Al Jarrah KM, Kung JH, Bortfeld T, Chen GT. An experimental investigation on intra-fractional organ motion effects in lung IMRT treatments. Phys Med Biol. 2003;48(12):1773–84. doi: 10.1088/0031-9155/48/12/307. - DOI - PubMed
    1. Berbeco RI, Pope CJ, Jiang SB. Measurement of the interplay effect in lung IMRT treatment using EDR2 films. J Appl Clin Med Phys. 2006;7(4):33–42. doi: 10.1120/jacmp.v7i4.2222. - DOI - PMC - PubMed