

Statistically Derived Subtypes and Associations with Cerebrospinal Fluid and Genetic Biomarkers in Mild Cognitive Impairment: A Latent Profile Analysis
- PMID: 28578726
- PMCID: PMC5551901
- DOI: 10.1017/S135561771700039X
Statistically Derived Subtypes and Associations with Cerebrospinal Fluid and Genetic Biomarkers in Mild Cognitive Impairment: A Latent Profile Analysis
Abstract
Objectives: Research demonstrates heterogeneous neuropsychological profiles among individuals with mild cognitive impairment (MCI). However, few studies have included visuoconstructional ability or used latent mixture modeling to statistically identify MCI subtypes. Therefore, we examined whether unique neuropsychological MCI profiles could be ascertained using latent profile analysis (LPA), and subsequently investigated cerebrospinal fluid (CSF) biomarkers, genotype, and longitudinal clinical outcomes between the empirically derived classes.
Methods: A total of 806 participants diagnosed by means of the Alzheimer's Disease Neuroimaging Initiative (ADNI) MCI criteria received a comprehensive neuropsychological battery assessing visuoconstructional ability, language, attention/executive function, and episodic memory. Test scores were adjusted for demographic characteristics using standardized regression coefficients based on "robust" normal control performance (n=260). Calculated Z-scores were subsequently used in the LPA, and CSF-derived biomarkers, genotype, and longitudinal clinical outcome were evaluated between the LPA-derived MCI classes.
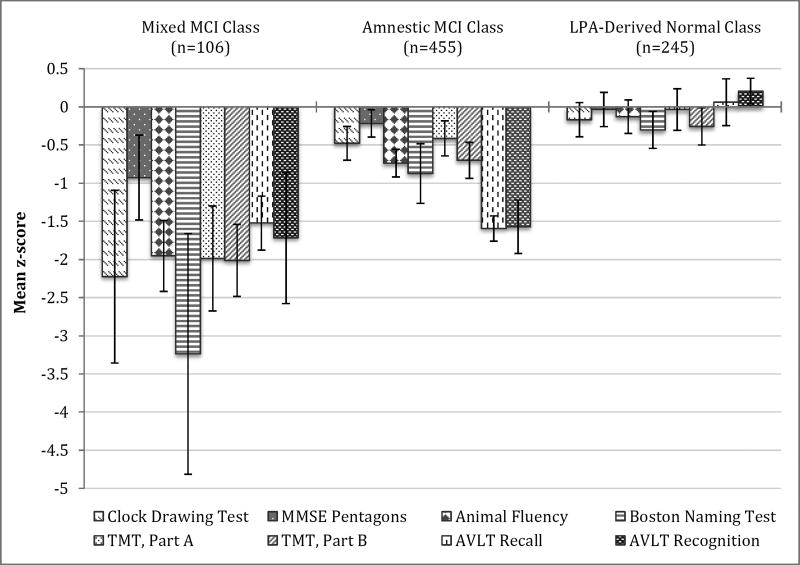
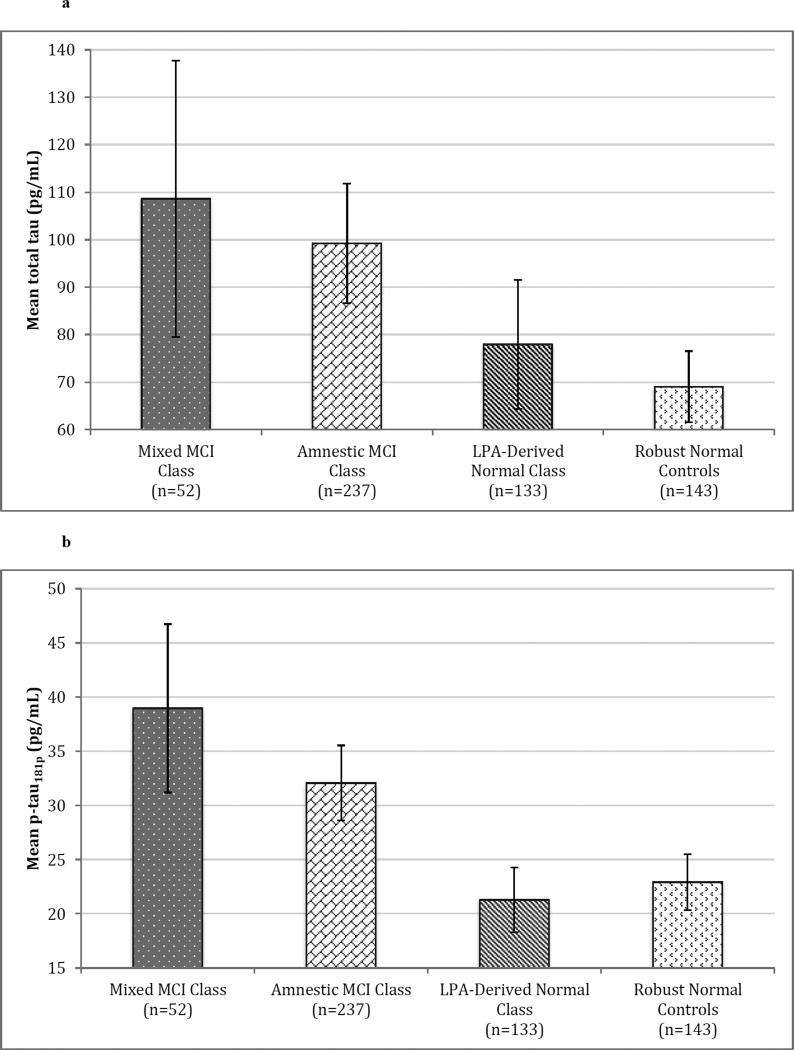
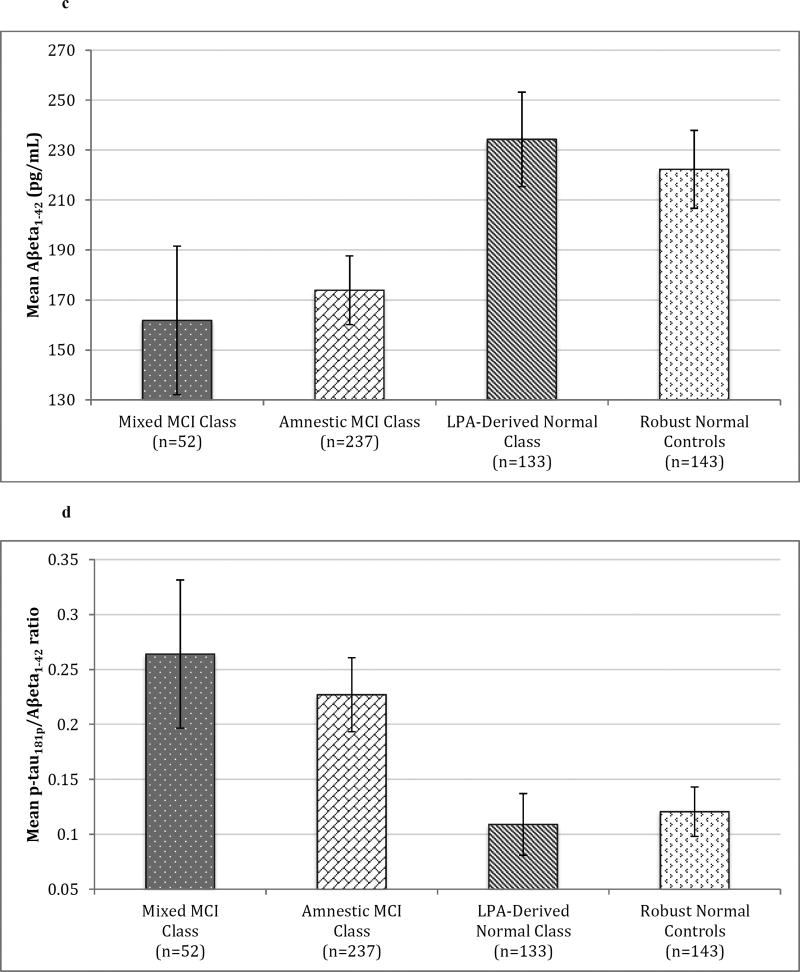
Results: Statistical fit indices suggested a 3-class model was the optimal LPA solution. The three-class LPA consisted of a mixed impairment MCI class (n=106), an amnestic MCI class (n=455), and an LPA-derived normal class (n=245). Additionally, the amnestic and mixed classes were more likely to be apolipoprotein e4+ and have worse Alzheimer's disease CSF biomarkers than LPA-derived normal subjects.
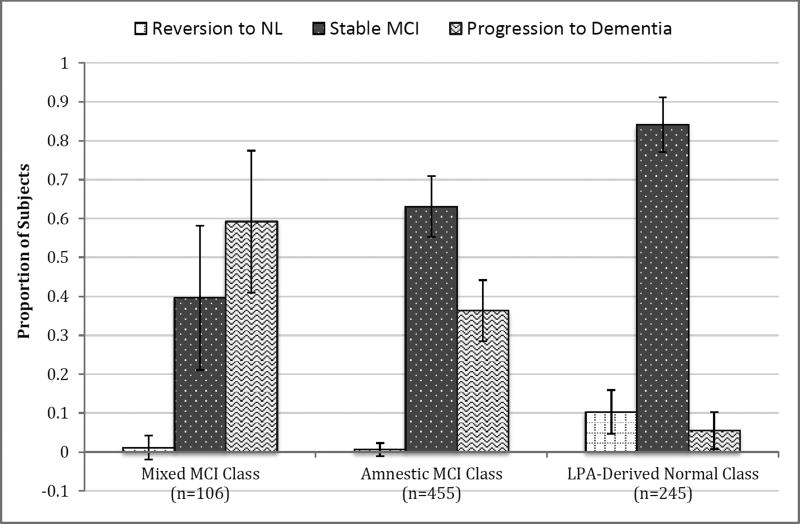
Conclusions: Our study supports significant heterogeneity in MCI neuropsychological profiles using LPA and extends prior work (Edmonds et al., 2015) by demonstrating a lower rate of progression in the approximately one-third of ADNI MCI individuals who may represent "false-positive" diagnoses. Our results underscore the importance of using sensitive, actuarial methods for diagnosing MCI, as current diagnostic methods may be over-inclusive. (JINS, 2017, 23, 564-576).
Keywords: Alzheimer’s disease; Assessment of cognitive disorders/dementia; Biomarkers; Latent profile analysis; Mild cognitive impairment (MCI); Multivariate mixture modeling; Neuropsychological profiles.
Figures
References
-
- Alzheimer’s Disease Neuroimaging Initiative. ADNI 2 Procedures Manual. 2008 http://adni.loni.usc.edu/wp-content/uploads/2008/07/adni2-procedures-man....
-
- Asparouhouv T, Muthén B. Online technical appendix. Los Angeles, CA: Muthén & Muthén; 2007. Wald test of mean equality for potential latent class predictors in mixture modeling. Available for download at https://www.statmodel.com/download/MeanTest1.pdf.
-
- Asparouhov T, Muthén B. Auxiliary variables in mixture modeling: Three-step approaches using Mplus. Structural Equation Modeling: A Multidisciplinary Journal. 2014;21(3):329–341. doi: 10.1080/10705511.2014.915181. - DOI
Publication types
MeSH terms
Substances
Grants and funding
LinkOut - more resources
Full Text Sources
Other Literature Sources
Medical
Miscellaneous
