. 2017 Jun 19;27(12):1768-1775.e3.
doi: 10.1016/j.cub.2017.04.059. Epub 2017 Jun 1.

Meal Timing Regulates the Human Circadian System

Affiliations

Meal Timing Regulates the Human Circadian System

Sophie M T Wehrens et al. Curr Biol. .

Abstract

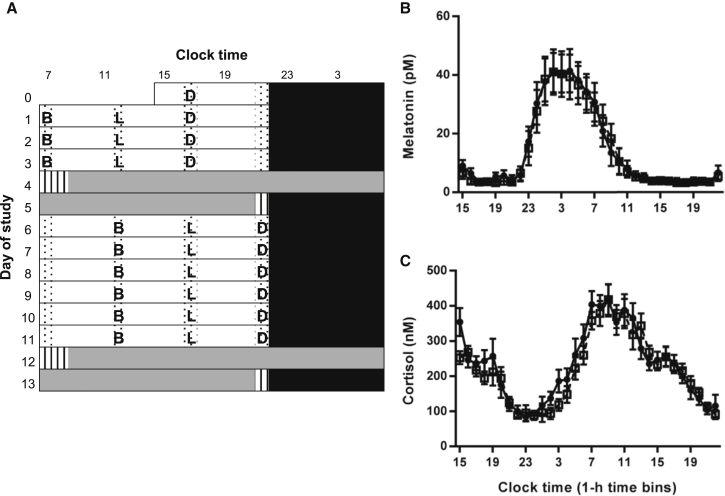
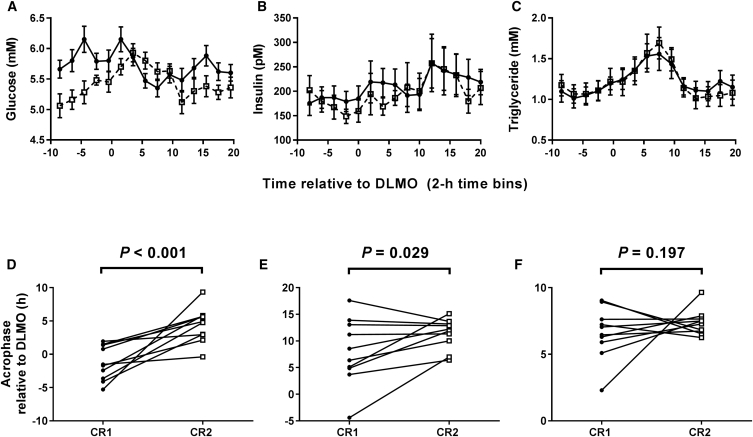
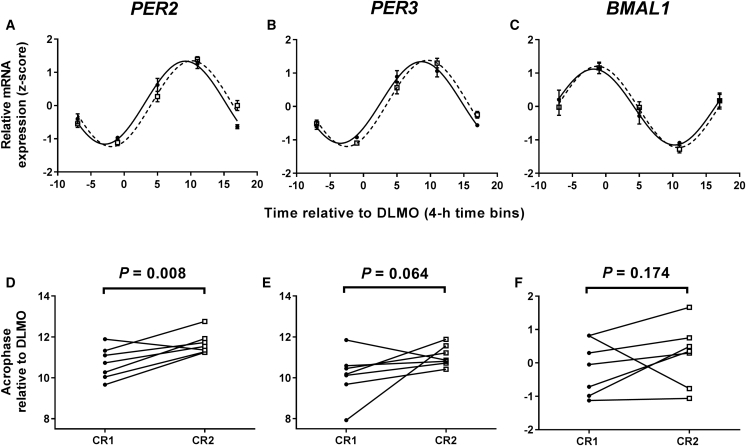
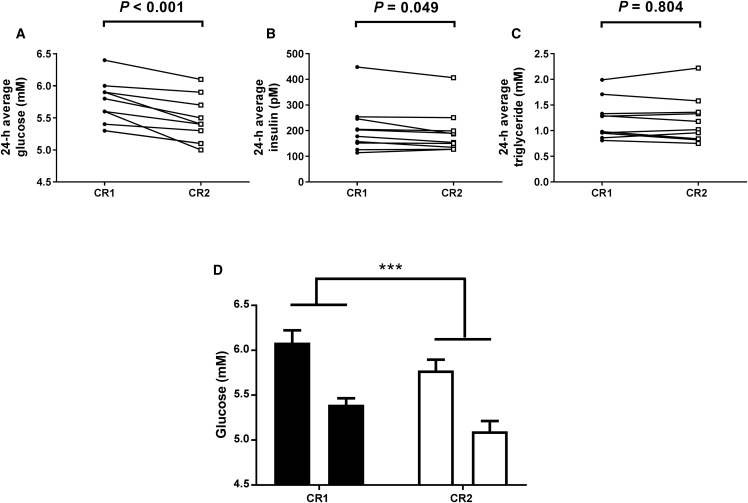
Circadian rhythms, metabolism, and nutrition are intimately linked [1, 2], although effects of meal timing on the human circadian system are poorly understood. We investigated the effect of a 5-hr delay in meals on markers of the human master clock and multiple peripheral circadian rhythms. Ten healthy young men undertook a 13-day laboratory protocol. Three meals (breakfast, lunch, dinner) were given at 5-hr intervals, beginning either 0.5 (early) or 5.5 (late) hr after wake. Participants were acclimated to early meals and then switched to late meals for 6 days. After each meal schedule, participants' circadian rhythms were measured in a 37-hr constant routine that removes sleep and environmental rhythms while replacing meals with hourly isocaloric snacks. Meal timing did not alter actigraphic sleep parameters before circadian rhythm measurement. In constant routines, meal timing did not affect rhythms of subjective hunger and sleepiness, master clock markers (plasma melatonin and cortisol), plasma triglycerides, or clock gene expression in whole blood. Following late meals, however, plasma glucose rhythms were delayed by 5.69 ± 1.29 hr (p < 0.001), and average glucose concentration decreased by 0.27 ± 0.05 mM (p < 0.001). In adipose tissue, PER2 mRNA rhythms were delayed by 0.97 ± 0.29 hr (p < 0.01), indicating that human molecular clocks may be regulated by feeding time and could underpin plasma glucose changes. Timed meals therefore play a role in synchronizing peripheral circadian rhythms in humans and may have particular relevance for patients with circadian rhythm disorders, shift workers, and transmeridian travelers.

Keywords: actigraphy; chrononutrition; clock gene; food timing; glucose homeostasis; jet lag; meal timing; peripheral clocks; shift work; white adipose tissue.


Figures

Figure 1
Figure 1
Study Protocol and Phase of SCN-Driven Hormone Rhythms (A) In order to maximize circadian entrainment prior to beginning the study protocol, participants maintained a self-selected pre-laboratory light-dark and sleep-wake pattern based on their habitual routine for 10 days. During the last week of the pre-laboratory period they ate breakfast (B) 30 min after wake, lunch (L) 5.5 hr after wake, and dinner (D) 10.5 hr after wake. Participants then entered the laboratory on day 0. During days 0–3, participants remained on their self-selected sleep-wake cycle. They slept in individual bedrooms in darkness (0 lux; black bars) and were awake in bright room light (∼500 lux in direction of gaze) during the day. Waking time was spent in communal areas (white bars) and in individual rooms (dotted bars). Isocaloric meals (B, L, D) were given 0.5, 5.5, and 10.5 hr after waking up, matching the week of pre-laboratory meal timing. On day 4, participants began a 37-hr constant routine in individual rooms (<8 lux; gray bars). Participants had a standard night’s sleep on day 5, before 6 more days of the sleep-wake and light-dark cycles (days 6–11). Conditions were equal to days 1–3 except for a 5-hr delay in all meal times. A second constant routine then commenced on day 12. Immediately before and after each constant routine, participants were kept in a constant routine-like environment but allowed to move within their rooms (hatched bars). (B and C) Concentration of melatonin (B) and cortisol (C) in hourly plasma samples collected in constant routine conditions. Black circles with solid lines represent data following early meals (0.5, 5.5, and 10.5 hr after waking up). White squares with dashed lines represent data following a 5-hr delay in each meal. Two-way repeated-measures ANOVA revealed a significant effect of time (melatonin: F(31, 279) = 19.00, p < 0.001; cortisol: F(31, 279) = 20.31, p < 0.001), but no significant effect of meals (melatonin: F(1, 9) = 2.97, p = 0.119; cortisol: F(1, 9) = 2.27, p = 0.166) or meal × time interaction (melatonin: F(31, 279) = 0.13, p = 0.124; cortisol: F(31, 279) = 1.39, p = 0.090). Data are mean ± SEM, n = 10. Statistical significance is defined as p < 0.01 (following Bonferroni correction for analysis of a total of five rhythmic plasma markers). See also Figures S1 and S2.
Figure 2
Figure 2
A 5-hr Delay in Meal Times Delays the Plasma Glucose Circadian Rhythm (A–C) Concentration of glucose (A), insulin (B), and triglyceride (C) in 2-hourly plasma samples collected in constant routine conditions. Data are plotted as mean ± SEM. Black circles with solid lines represent data following early meals (0.5, 5.5, and 10.5 hr after waking up). White squares with dashed lines represent data following a 5-hr delay in each meal. (A) There were significant effects of time (F(14,126) = 3.71, p < 0.001), meals (F(1, 9) = 29.84, p < 0.001), and meal × time interaction (F(14,126) = 5.10, p < 0.001) on glucose concentration. (B) There was a significant effect of time (F(14,126) = 2.79, p = 0.001), but no significant effect of meals (F(1, 9) = 4.69, p = 0.059) or meal × time interaction (F(14,126) = 1.16, p = 0.312) on plasma insulin concentration. (C) There was a significant effect of time (F(14,126) = 18.44, p < 0.001), but no significant effect of meals (F(1, 9) = 0.01, p = 0.913) or meal × time interaction (F(14,126) = 1.19, p = 0.294) on plasma triglyceride concentration. (D–F) Acrophase of glucose (D), insulin (E), and triglyceride (F) rhythms in individuals following early meals (constant routine 1, CR1; black circles) and following a 5-hr delay in meal time (constant routine 2, CR2; white squares). Using a paired t test, there was a significant effect of meal timing on glucose phase (delay of 5.59 ± 1.29 hr; t(9) = 4.415, p < 0.001), but not on the phase of insulin (t(9) = 2.179, p = 0.029; note Bonferroni-corrected critical p value below) or triglyceride (t(9) = 0.896, p = 0.197). (A–F) Data are from n = 10 participants, calculated relative to each individual’s dim light melatonin onset (DLMO). Statistical significance is defined as p < 0.01 (following Bonferroni correction for analysis of a total of five rhythmic plasma markers).
Figure 3
Figure 3
A 5-hr Delay in Meal Times Delays Clock Gene Rhythms in White Adipose Tissue (A–C) Temporal expression profiles of PER2 (A), PER3 (B), and BMAL1(C) in 6-hourly white adipose tissue biopsies collected in constant routine conditions. Data are plotted as mean ± SEM. Black circles with solid lines represent data following early meals (0.5, 5.5, and 10.5 hr after waking up). White squares with dashed lines represent data following a 5-hr delay in each meal. Two-way repeated-measures ANOVA revealed a significant effect of time for PER2 (F(4,24) = 56.81, p < 0.001), PER3 (F(4,24) = 65.67, p < 0.001), and BMAL1 (F(4,24) = 21.44, p < 0.001). There was no overall effect of meal for any gene: PER2 (F(1,6) = 1.00, p = 0.356), PER3 (F(1,6) = 1.07, p = 0.340), and BMAL1 (F(1,6) = 1.08, p = 0.339). There was a significant meal × time interaction for PER2 (F(4,24) = 7.31, p < 0.001), but not for PER3 (F(4,24) = 2.44, p = 0.075) or BMAL1 (F(4,24) = 0.58, p = 0.680). (D–F) Acrophase of PER2 (D), PER3 (E), and BMAL1 (F) rhythms in individuals following early meals (CR1; black circles) and following a 5-hr delay in meal time (CR2; white squares). Using a paired t test, there was a significant effect of meal timing on PER2 phase (delay of 0.97 ± 0.29 hr; t(6) = 3.35, p = 0.008), but not on the phase of PER3 (t(6) = 1.77, p = 0.064) or BMAL1 (t(6) = 1.02, p = 0.174). (A–F) Data are from n = 7 participants, calculated relative to each individual’s DLMO. Statistical significance is defined as p < 0.017 (following Bonferroni correction for analysis of a total of three rhythmic adipose markers). See also Figure S3.
Figure 4
Figure 4
The Average Plasma Glucose Concentration in Constant Routine Conditions Is Reduced Following a 5-hr Delay in Meal Times (A–C) 24-hr average concentration of glucose (A), insulin (B), and triglyceride (C) in plasma samples collected in constant routine conditions following early meals (CR1; black circles) and following a 5-hr delay in meal time (CR2; white squares). There was a significant decrease in the mean glucose concentration following late meals (5.45 ± 0.11 mmol/L) compared to early meals (5.72 ± 0.11 mmol/L, t(9) = 5.22, p < 0.001, paired t test). Following Bonferroni correction of the critical p value, there was no significant decrease in the mean concentration of plasma insulin following late meals (208.2 ± 30.46 versus 192.6 ± 26.75 pmol/L, early versus late, respectively; t(9) = 2.27, p = 0.049, paired t test). There was no significant difference in mean triglyceride concentration (1.22 ± 0.12 versus 1.21 ± 0.14 mmol/L, early versus late meals, respectively; t(9) = 0.26, p = 0.804, paired t test). (D) Peak and trough concentration of glucose in plasma samples collected in constant routine conditions following early meals (black bars) and a 5-hr delay in meal time (white bars). Using two-way repeated-measures ANOVA, there was an overall significant effect of meals (F(1, 9) = 22.98, p = 0.001), a significant difference between peak and trough values (F(1, 9) = 177.6, p < 0.001), but no significant interaction between the two factors (F(1, 9) = 0.01, p = 0.914). ∗∗∗p < 0.001 (early meals/CR1 versus late meals/CR2). Data are plotted as mean ± SEM. (A–D) Statistical significance is defined as p < 0.01 (following Bonferroni correction for analysis of plasma concentration in five markers). Data are from n = 10 participants.

Comment in

References

    1. Bass J. Circadian topology of metabolism. Nature. 2012;491:348–356. - PubMed
    1. Johnston J.D., Ordovás J.M., Scheer F.A., Turek F.W. Circadian rhythms, metabolism, and chrononutrition in rodents and humans. Adv. Nutr. 2016;7:399–406. - PMC - PubMed
    1. Schibler U., Gotic I., Saini C., Gos P., Curie T., Emmenegger Y., Sinturel F., Gosselin P., Gerber A., Fleury-Olela F. Clock-talk: interactions between central and peripheral circadian oscillators in mammals. Cold Spring Harb. Symp. Quant. Biol. 2015;80:223–232. - PubMed
    1. Roenneberg T., Merrow M. The circadian clock and human health. Curr. Biol. 2016;26:R432–R443. - PubMed
    1. Potter G.D., Skene D.J., Arendt J., Cade J.E., Grant P.J., Hardie L.J. Circadian rhythm and sleep disruption: causes, metabolic consequences, and countermeasures. Endocr. Rev. 2016;37:584–608. - PMC - PubMed