

The enduring impact of historical and structural racism on urban violence in Philadelphia
- PMID: 28579093
- PMCID: PMC7437144
- DOI: 10.1016/j.socscimed.2017.05.038
The enduring impact of historical and structural racism on urban violence in Philadelphia
Abstract
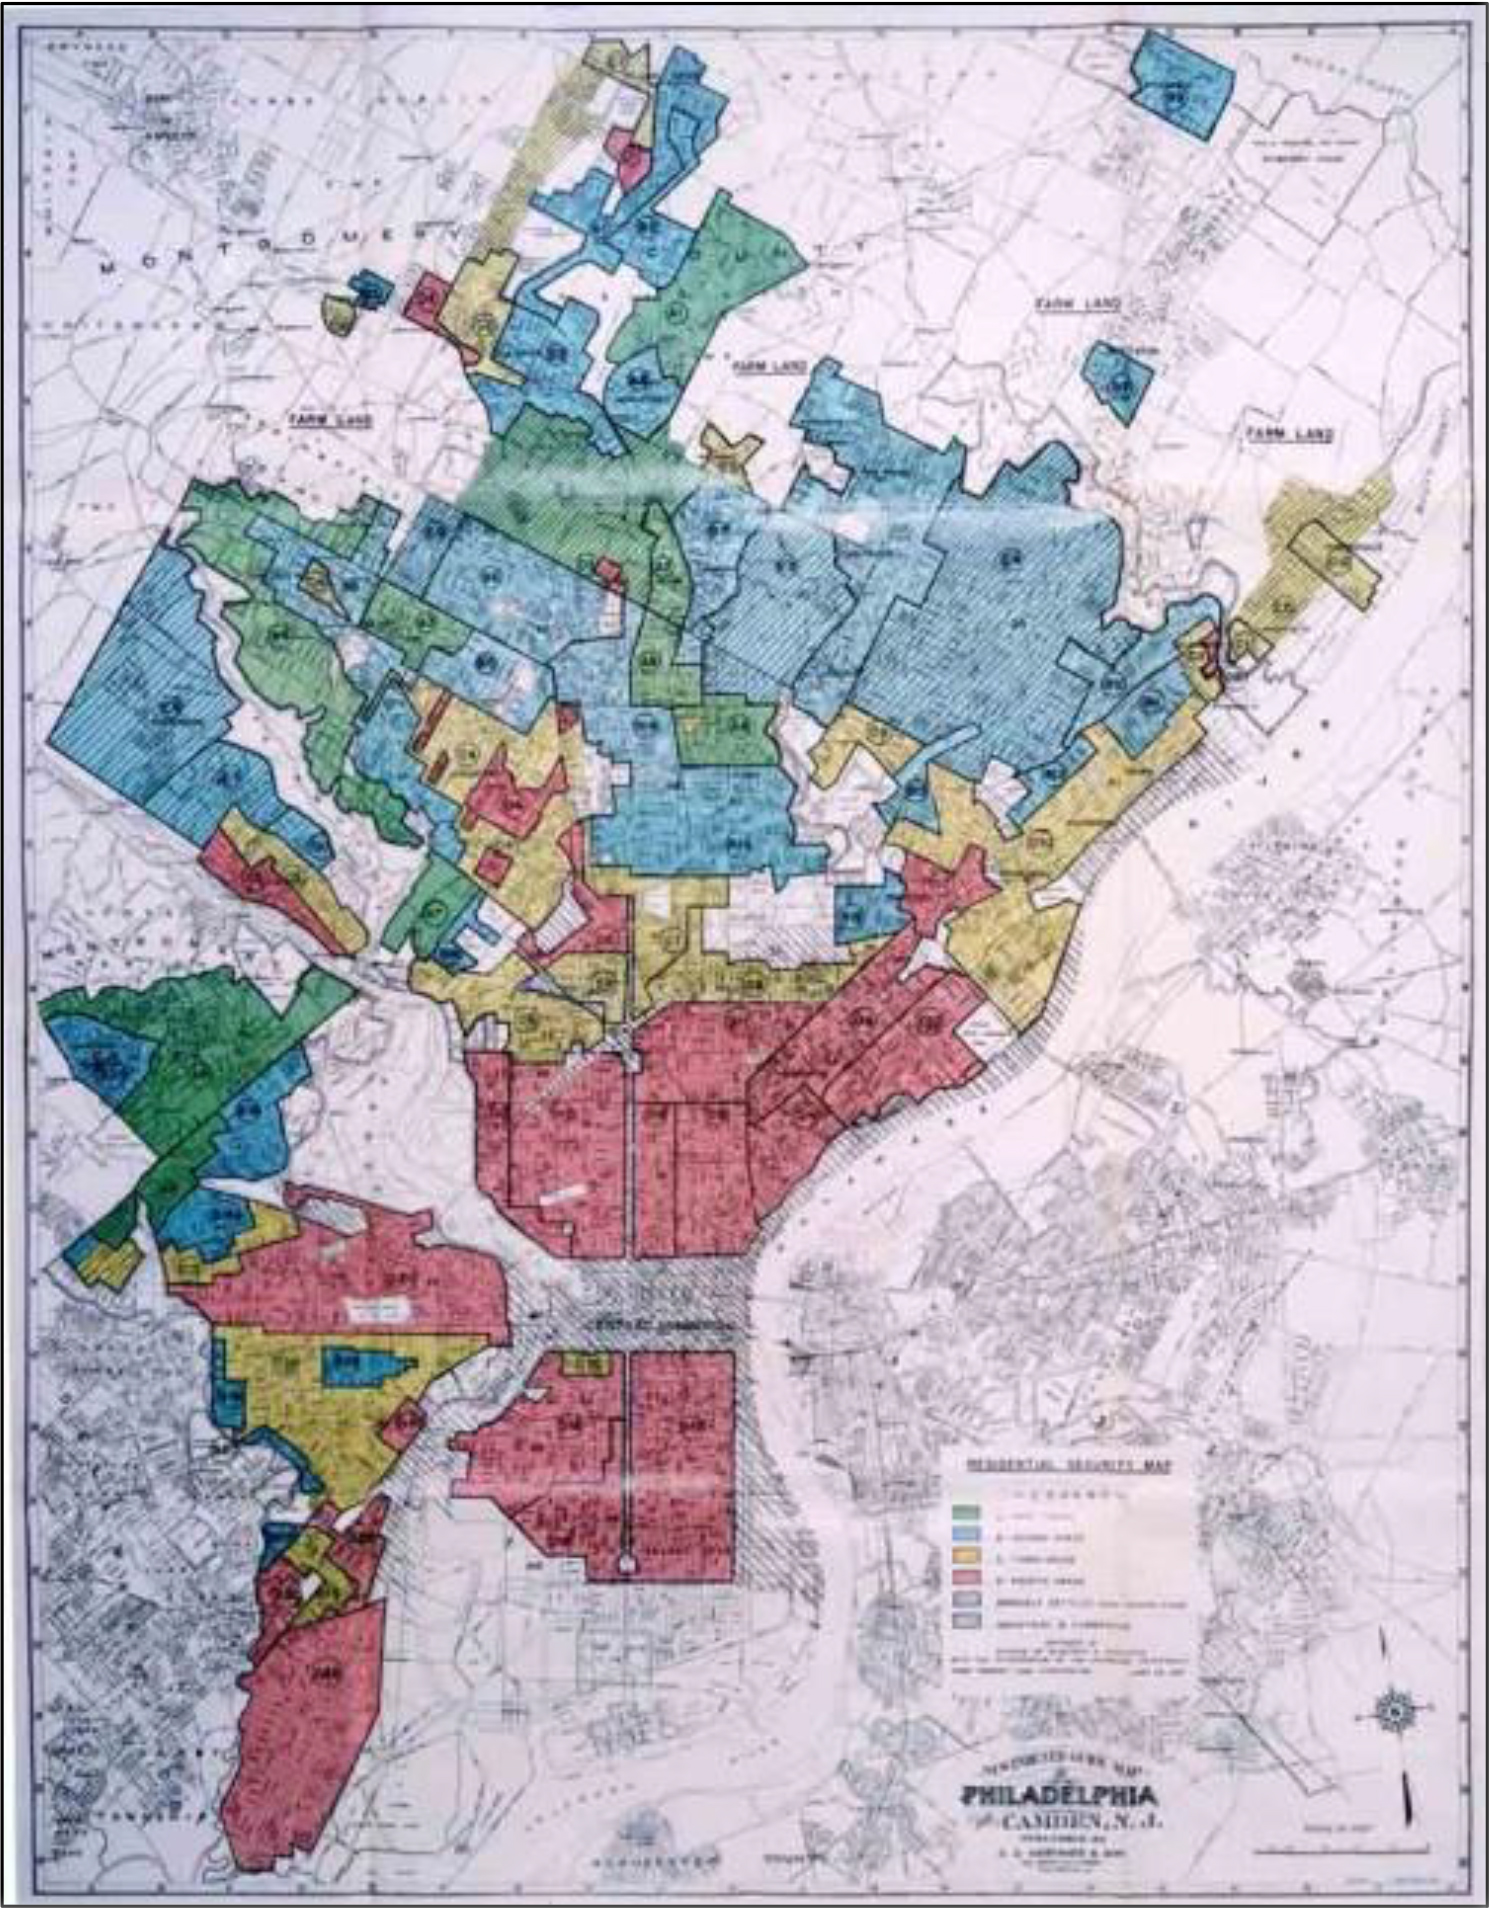
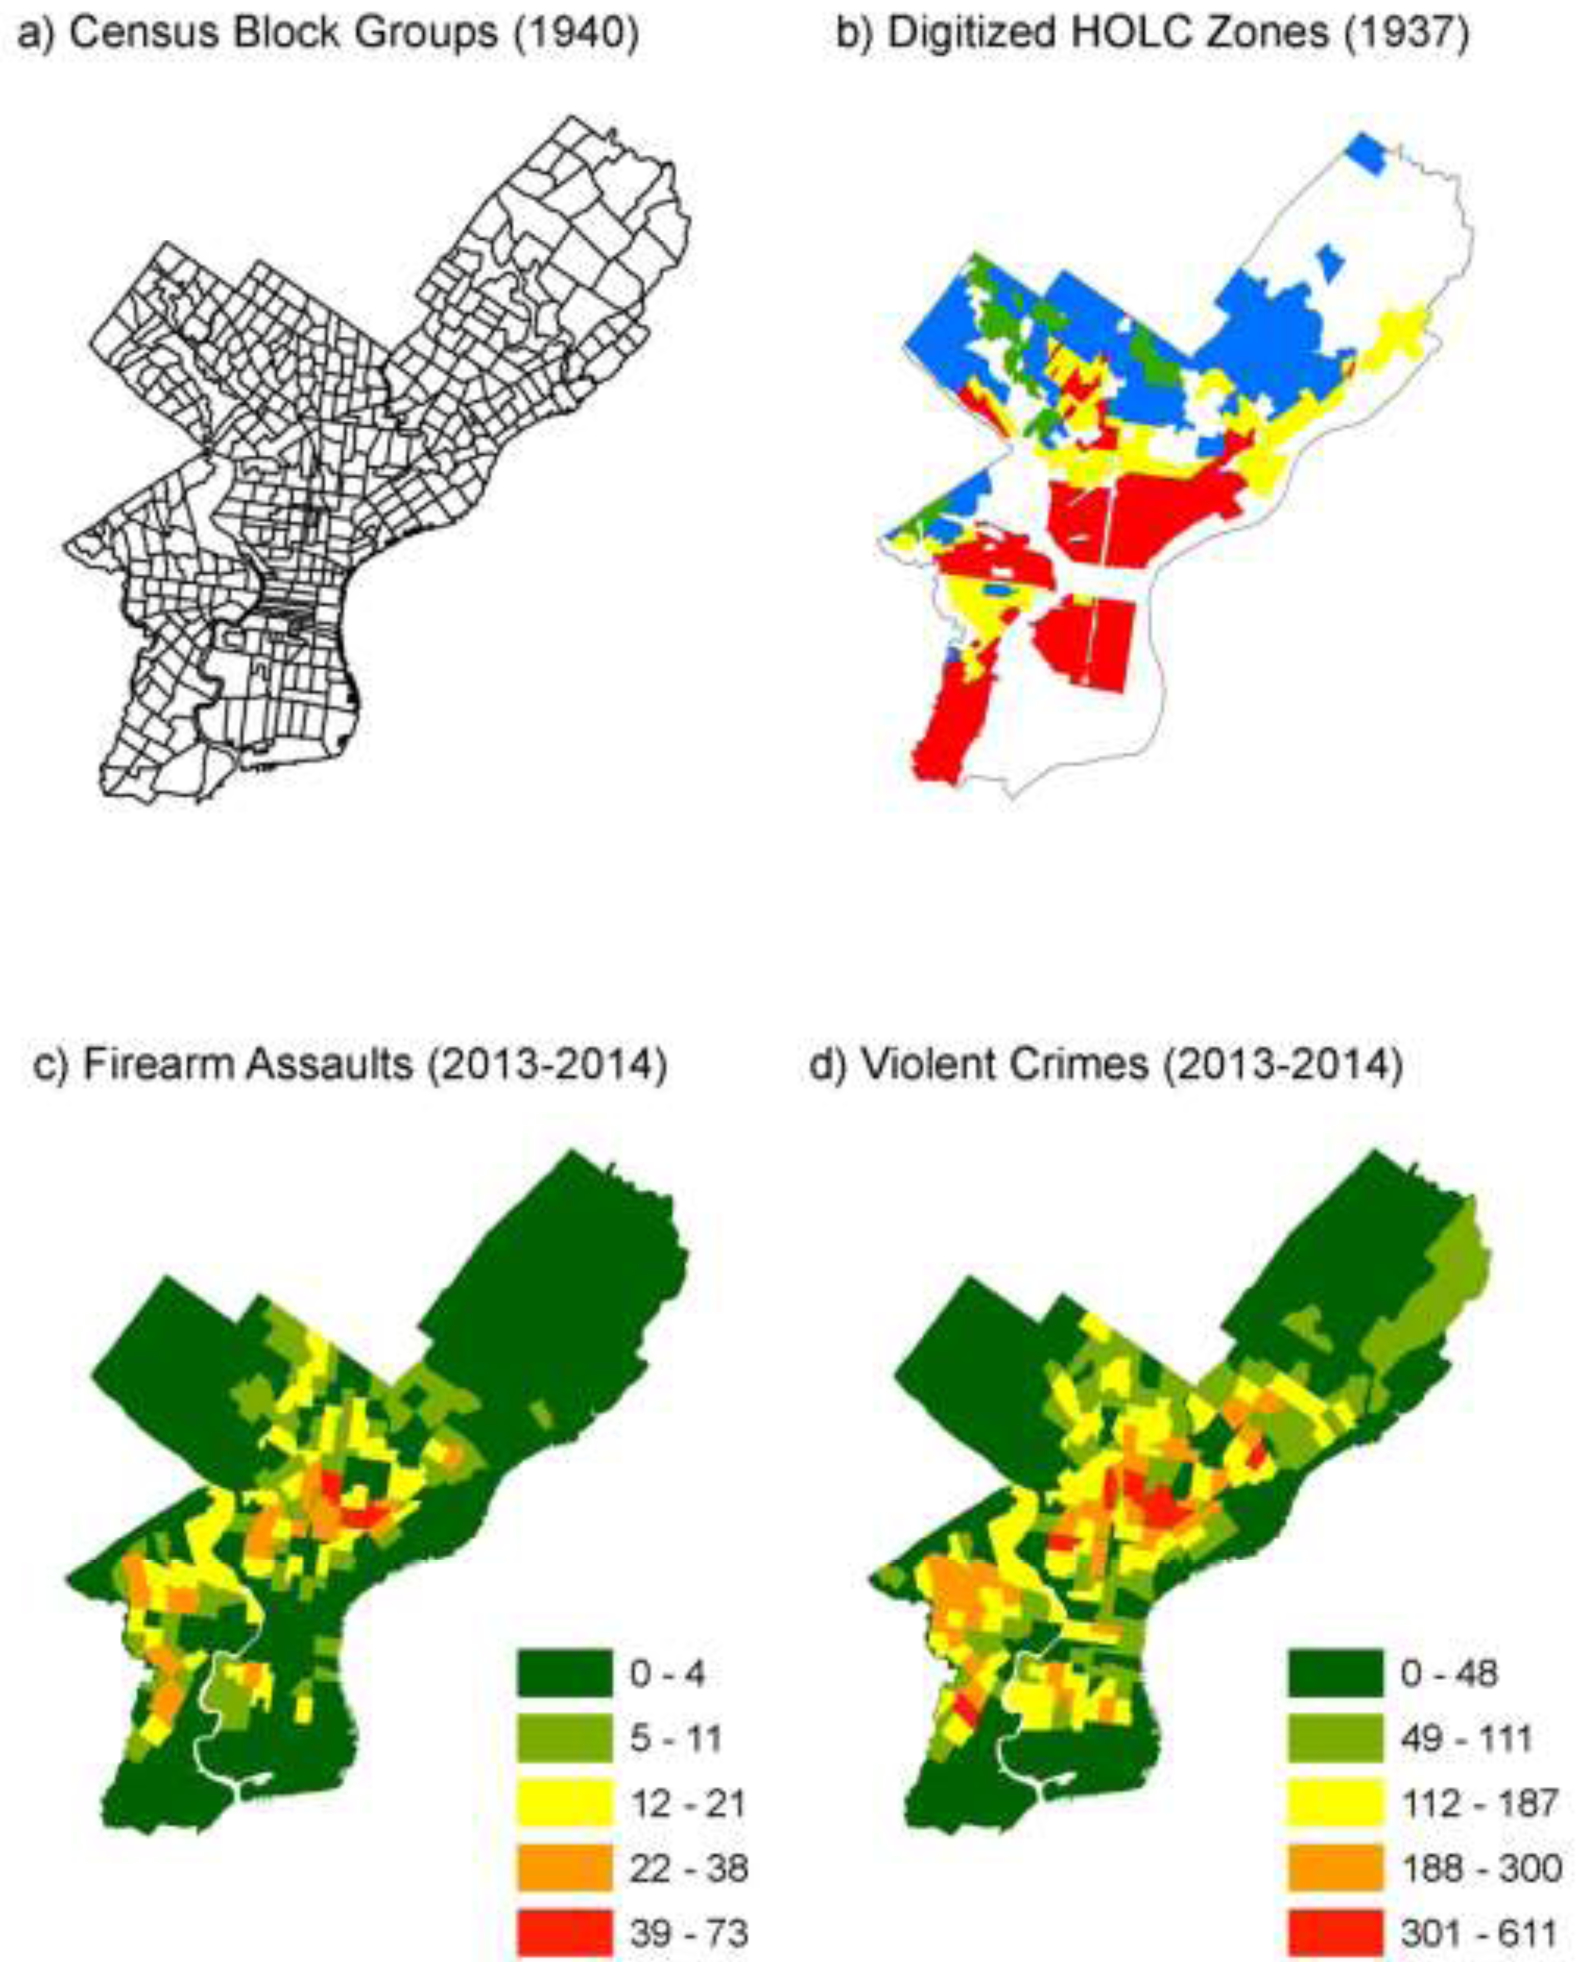
Public health approaches to crime and injury prevention are increasingly focused on the physical places and environments where violence is concentrated. In this study, our aim is to explore the association between historic place-based racial discrimination captured in the 1937 Home Owners Loan Corporation (HOLC) map of Philadelphia and present-day violent crime and firearm injuries. The creators of the 1937 HOLC map zoned Philadelphia based in a hierarchical system wherein first-grade and green color zones were used to indicate areas desirable for government-backed mortgage lending and economic development, a second-grade or blue zone for areas that were already developed and stable, a third-grade or yellow zone for areas with evidence of decline and influx of a "low grade population," and fourth-grade or red zone for areas with dilapidated or informal housing and an "undesirable population" of predominately Black residents. We conducted an empirical spatial analysis of the concentration of firearm assaults and violent crimes in 2013 through 2014 relative to zoning in the 1937 HOLC map. After adjusting for socio-demographic factors at the time the map was created from the 1940 Census, firearm injury rates are highest in historically red-zoned areas of Philadelphia. The relationship between HOLC map zones and general violent crime is not supported after adjusting for historical Census data. This analysis extends historic perspective to the relationship between emplaced structural racism and violence, and situates the socio-ecological context in which people live at the forefront of this association.
Keywords: Discrimination; Firearm injuries; Historic maps; Philadelphia; Racial health disparities; Redlining; Spatial analysis; United States; Violence.
Copyright © 2017 Elsevier Ltd. All rights reserved.
Figures
References
-
- AALBERS MB, 2014. Do maps make geography? Part 1: Redlining, planned shrinkage, and the places of decline. ACME: An International E-Journal for Critical Geographies, vol. 13, pp. 525–556.
-
- BEYER KM, ZHOU Y, MATTHEWS K, BEMANIAN A, LAUD PW and NATTINGER AB, 2016. New spatially continuous indices of redlining and racial bias in mortgage lending: links to survival after breast cancer diagnosis and implications for health disparities research. Health & Place, 20160509, May 9, vol. 40, pp. 34–43 DOI S1353-8292(16)30047-. - PubMed
-
- BRAGA AA, PAPACHRISTOS AV and HUREAU DM, 2010. The Concentration and Stability of Gun Violence at Micro Places in Boston, 1980–2008. Journal of Quantitative Criminology, vol. 26, no. 1, pp. 33.
Publication types
MeSH terms
Grants and funding
LinkOut - more resources
Full Text Sources
Other Literature Sources
