. 2017 Jun:20:137-149.
doi: 10.1016/j.ebiom.2017.05.028. Epub 2017 May 26.

SGLT2 Inhibition by Empagliflozin Promotes Fat Utilization and Browning and Attenuates Inflammation and Insulin Resistance by Polarizing M2 Macrophages in Diet-induced Obese Mice

Affiliations

SGLT2 Inhibition by Empagliflozin Promotes Fat Utilization and Browning and Attenuates Inflammation and Insulin Resistance by Polarizing M2 Macrophages in Diet-induced Obese Mice

Liang Xu et al. EBioMedicine. 2017 Jun.

Abstract

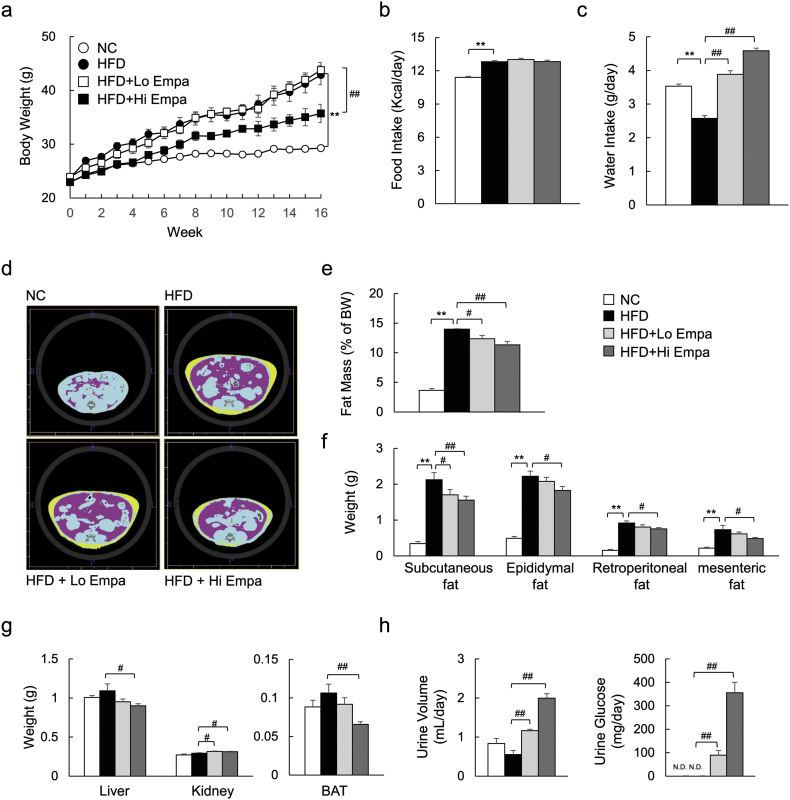
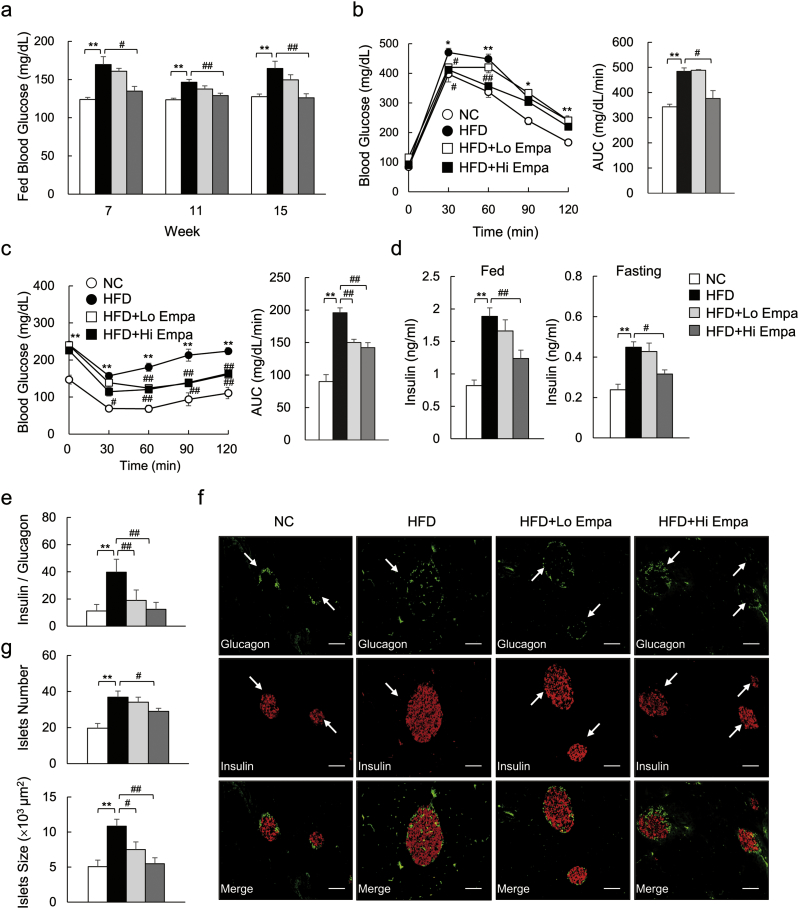
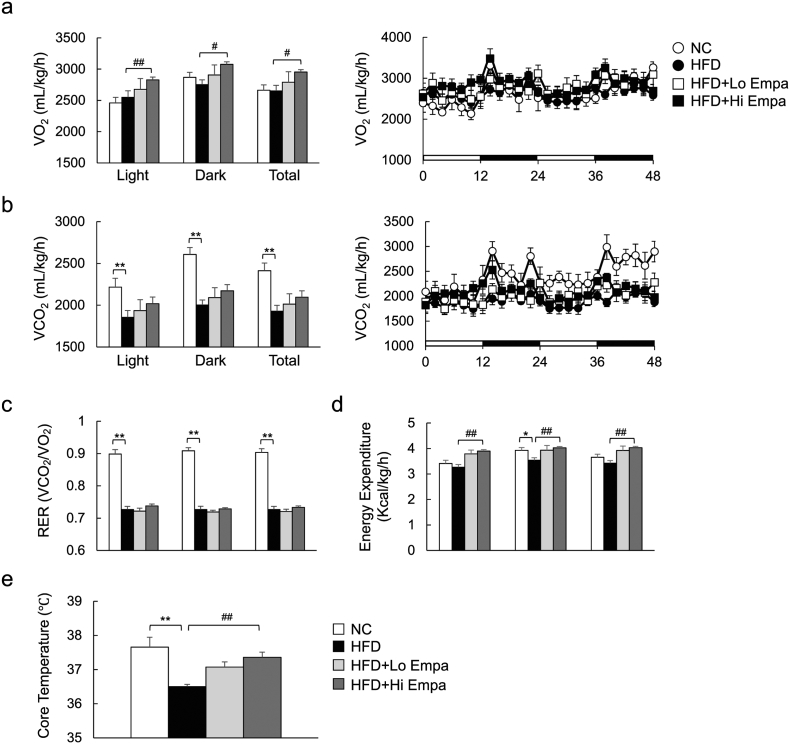
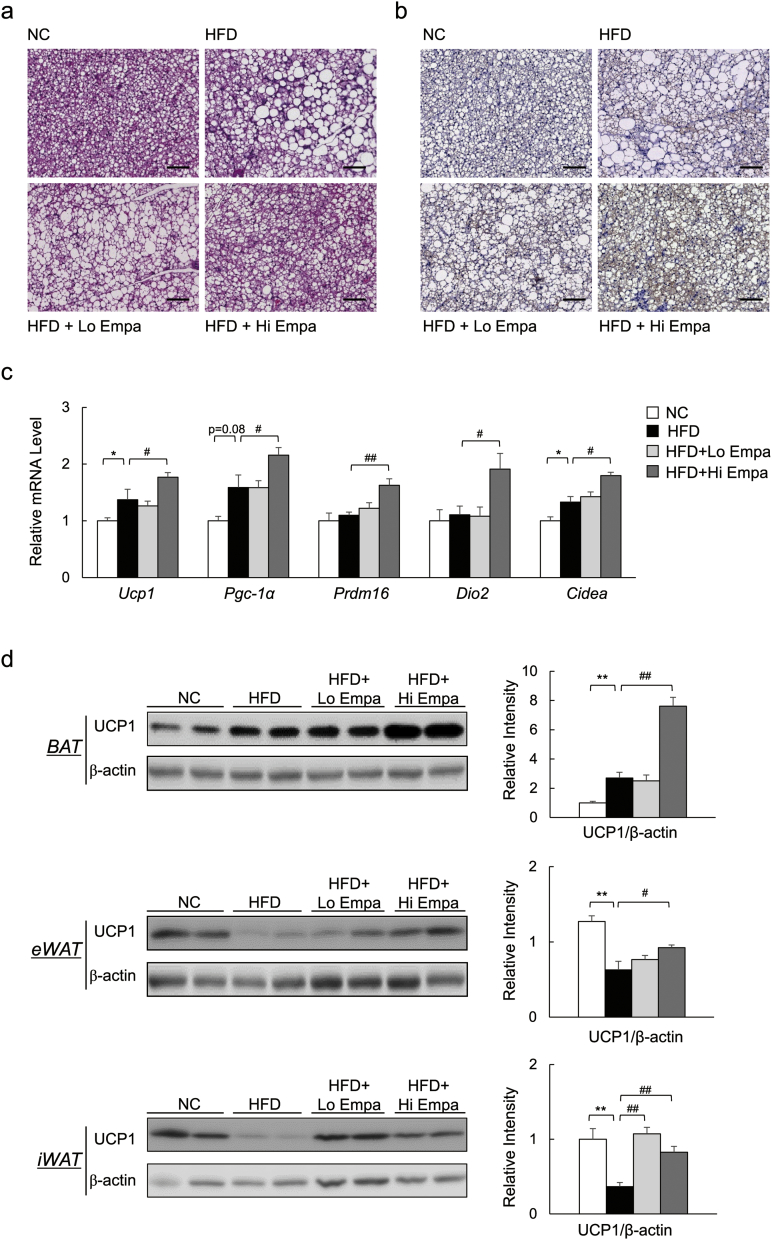
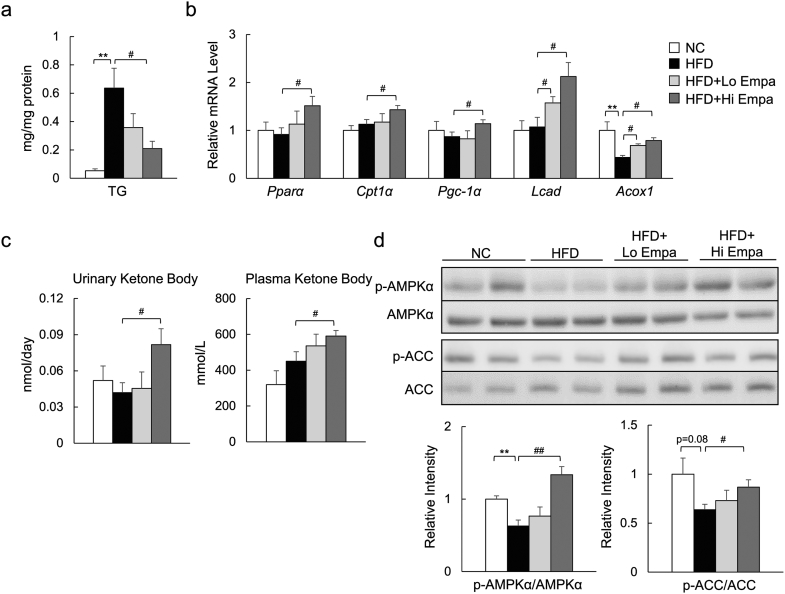
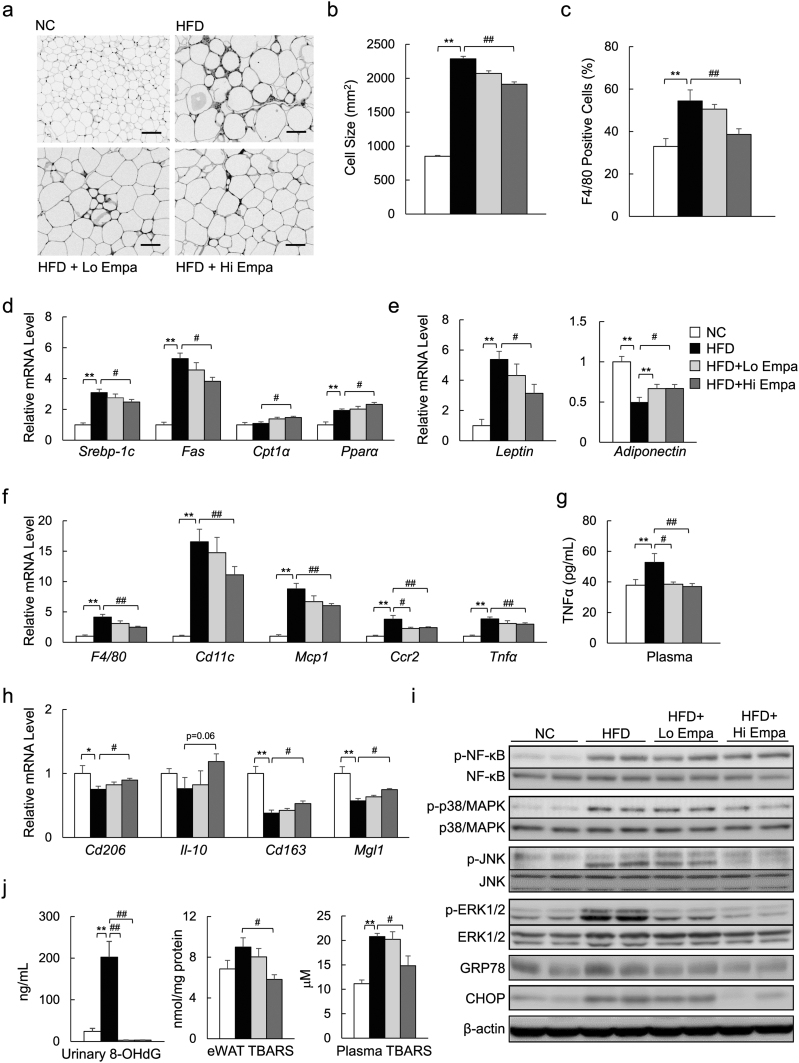
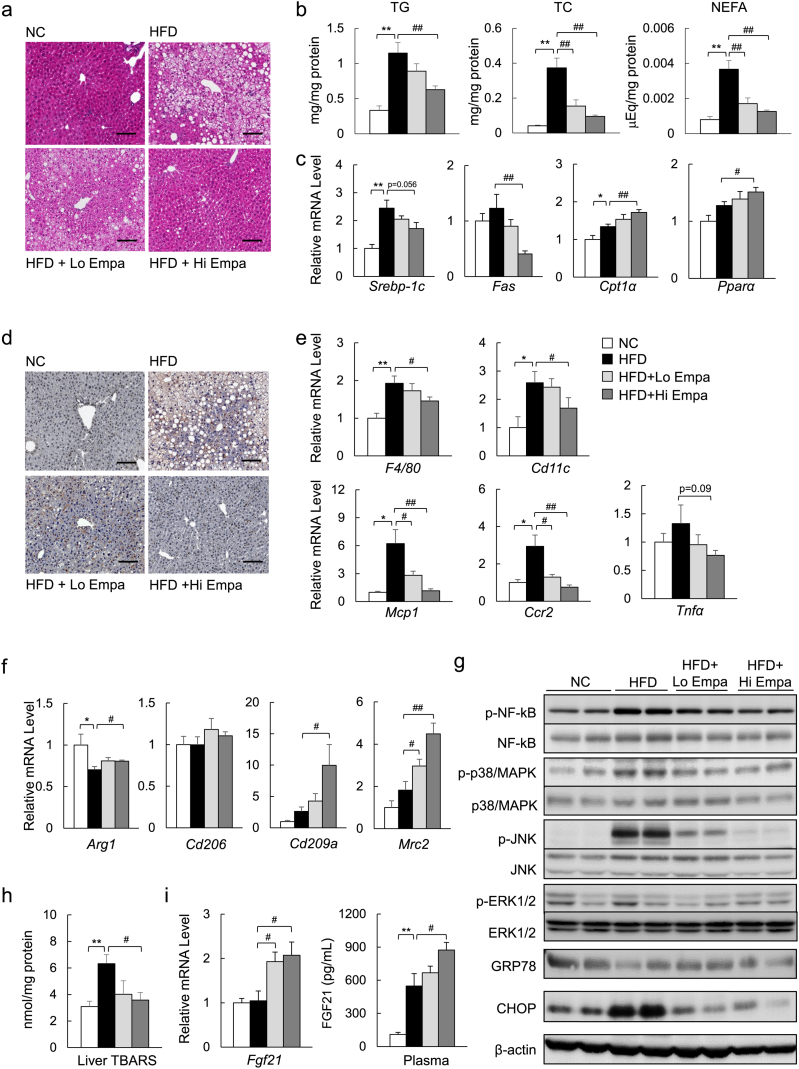
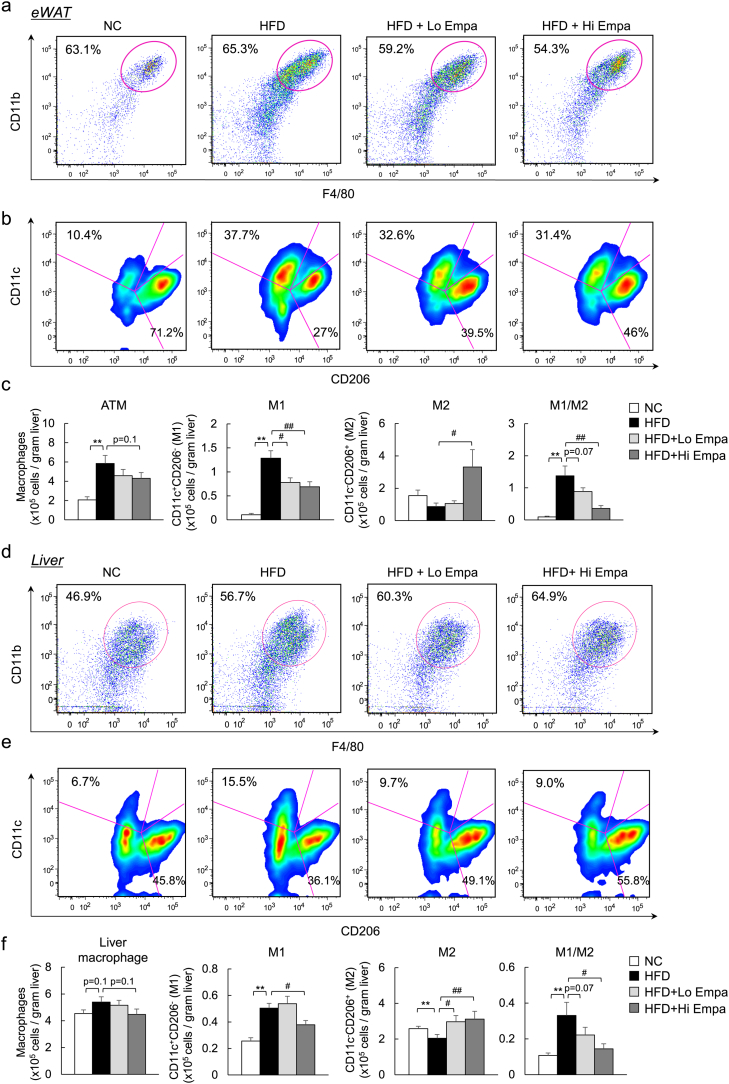
Sodium-glucose cotransporter (SGLT) 2 inhibitors increase urinary glucose excretion (UGE), leading to blood glucose reductions and weight loss. However, the impacts of SGLT2 inhibition on energy homeostasis and obesity-induced insulin resistance are less well known. Here, we show that empagliflozin, a SGLT2 inhibitor, enhanced energy expenditure and attenuated inflammation and insulin resistance in high-fat-diet-induced obese (DIO) mice. C57BL/6J mice were pair-fed a high-fat diet (HFD) or a HFD with empagliflozin for 16weeks. Empagliflozin administration increased UGE in the DIO mice, whereas it suppressed HFD-induced weight gain, insulin resistance, and hepatic steatosis. Moreover, empagliflozin shifted energy metabolism towards fat utilization, elevated AMP-activated protein kinase and acetyl-CoA carbolxylase phosphorylation in skeletal muscle, and increased hepatic and plasma fibroblast growth factor 21 levels. Importantly, empagliflozin increased energy expenditure, heat production, and the expression of uncoupling protein 1 in brown fat and in inguinal and epididymal white adipose tissue (WAT). Furthermore, empagliflozin reduced M1-polarized macrophage accumulation while inducing the anti-inflammatory M2 phenotype of macrophages within WAT and liver, lowering plasma TNFα levels and attenuating obesity-related chronic inflammation. Thus, empagliflozin suppressed weight gain by enhancing fat utilization and browning and attenuated obesity-induced inflammation and insulin resistance by polarizing M2 macrophages in WAT and liver.

Keywords: Brown adipose tissue; Energy metabolism; Inflammation; Macrophage; Obesity; Sodium glucose cotransporter-2 inhibitor.


Figures

Fig. 1
Fig. 1
Empagliflozin reduces weight gain in DIO mice. (a) Body weights. (b, c) Food and water intake. (d) Representative CT images. (e) Fat mass calculated from CT scans. (f, g) Fat depot and tissue weights. (h) Urine volume and urinary glucose. Data are presented as means ± SEM, n = 7–9. *P < 0.05, **P < 0.01 vs. NC; #P < 0.05, ##P < 0.01 vs. HFD.
Fig. 2
Fig. 2
Empagliflozin ameliorates diet-induced insulin resistance. (a) Fed blood glucose levels. (b, c) GTT and ITT. (d) Plasma insulin levels. (e) Ratio of plasma insulin to glucagon levels. (f) Representative insulin and glucagon-stained pancreas sections. Scale bars = 100 μm. (g) Islet numbers and sizes. Data are presented as means ± SEM, n = 7–9. *P < 0.05, **P < 0.01 vs. NC; #P < 0.05, ##P < 0.01 vs. HFD.
Fig. 3
Fig. 3
Empagliflozin increases energy expenditure in DIO mice. (a) Oxygen consumption (VO2). (b) Carbon dioxide production (VCO2). (c) Respiratory exchange ratio (RER). (d) Energy expenditure. (e) Rectal temperature. Data are presented as means ± SEM, n = 7–9. *P < 0.05, **P < 0.01 vs. NC; #P < 0.05, ##P < 0.01 vs. HFD.
Fig. 4
Fig. 4
Empagliflozin increases UCP1 levels in BAT and beige fat. (a) H&E-stained BAT sections. Scale bars = 100 μm. (b) UCP1-stained BAT sections. Scale bars = 100 μm. (c) mRNA expression of brown fat-related genes. (d) Immunobloting and quantitation of UCP1 in BAT, eWAT and iWAT. Data are presented as means ± SEM, n = 7–9. *P < 0.05, **P < 0.01 vs. NC; #P < 0.05, ##P < 0.01 vs. HFD.
Fig. 5
Fig. 5
Empagliflozin enhances fat utilization in skeletal muscle. (a) Muscle TG content. (b) mRNA expression of fatty acid oxidation-related genes. (c) Urinary ketone body and fasting plasma ketone body concentrations. (d) Immunoblotting of skeletal muscle lysates. Data are presented as means ± SEM, n = 7–9. *P < 0.05, **P < 0.01 vs. NC; #P < 0.05, ##P < 0.01 vs. HFD.
Fig. 6
Fig. 6
Empagliflozin attenuates adipose tissue inflammation. (a) F4/80 immunostaining in eWAT. Scale bars = 100 μm. (b) Adipocyte sizes. (c) The F4/80+-cell ratio. (d) mRNA expression of lipometabolic-related genes. (e) mRNA expression of adipocytokine genes. (f) mRNA expression of F4/80 and inflammatory cytokines and chemokines. (g) Plasma levels of TNFα. (h) mRNA expression of M2 marker genes. (i) Immunoblotting of eWAT lysates. (j) Urinary 8-OHdG levels and TBARS content in eWAT and plasma. Data are presented as means ± SEM, n = 7–9. *P < 0.05, **P < 0.01 vs. NC; #P < 0.05, ##P < 0.01 vs. HFD.
Fig. 7
Fig. 7
Empagliflozin ameliorates hepatic steatosis and inflammation. (a) H&E-stained liver sections. Scale bars = 100 μm. (b) Hepatic lipid content. (c) mRNA levels of lipogenic regulator genes. (d) F4/80 immunostaining. Scale bars = 100 μm. (e) mRNA expression of F4/80 and inflammatory cytokines and chemokines. (f) mRNA expression of M2 marker genes. (g) Immunoblotting of liver lysates. (h) TBARS content. (i) mRNA expression of FGF21 in the liver and plasma levels of FGF21. Data are presented as means ± SEM, n = 7–9. *P < 0.05, **P < 0.01 vs. NC; #P < 0.05, ##P < 0.01 vs. HFD.
Fig. 8
Fig. 8
Empagliflozin treatment leads to a predominance of M2 macrophage populations over M1 in the WAT and liver. (a) Representative plots of total ATMs in eWAT. (b) M1 and M2 macrophages in eWAT. (c) Quantitation of total counts of ATMs, M1 ATMs, and M2 ATMs and M1/M2 ratios. (d) Representative plots of total LMs. (e) M1 and M2 macrophages in the liver. (f) Quantitation of total counts of LMs, M1 LMs, and M2 LMs and M1/M2 ratios. Data are presented as means ± SEM, n = 7–9. *P < 0.05, **P < 0.01 vs. NC; #P < 0.05, ##P < 0.01 vs. HFD.

References

    1. Badman M.K., Pissios P., Kennedy A.R., Koukos G., Flier J.S., Maratos-Flier E. Hepatic fibroblast growth factor 21 is regulated by PPARalpha and is a key mediator of hepatic lipid metabolism in ketotic states. Cell Metab. 2007;5(6):426–437. - PubMed
    1. Bonner C., Kerr-Conte J., Gmyr V., Queniat G., Moerman E., Thevenet J., Beaucamps C., Delalleau N., Popescu I., Malaisse W.J. Inhibition of the glucose transporter SGLT2 with dapagliflozin in pancreatic alpha cells triggers glucagon secretion. Nat. Med. 2015;21(5):512–517. - PubMed
    1. Brestoff J.R., Kim B.S., Saenz S.A., Stine R.R., Monticelli L.A., Sonnenberg G.F., Thome J.J., Farber D.L., Lutfy K., Seale P. Group 2 innate lymphoid cells promote beiging of white adipose tissue and limit obesity. Nature. 2015;519(7542):242–246. - PMC - PubMed
    1. Cohen P., Levy J.D., Zhang Y., Frontini A., Kolodin D.P., Svensson K.J., Lo J.C., Zeng X., Ye L., Khandekar M.J. Ablation of PRDM16 and beige adipose causes metabolic dysfunction and a subcutaneous to visceral fat switch. Cell. 2014;156(1–2):304–316. - PMC - PubMed
    1. Devenny J.J., Godonis H.E., Harvey S.J., Rooney S., Cullen M.J., Pelleymounter M.A. Weight loss induced by chronic dapagliflozin treatment is attenuated by compensatory hyperphagia in diet-induced obese (dio) rats. Obesity. 2012;20(8):1645–1652. - PubMed

MeSH terms