

Reference Curve for the Mean Uterine Artery Pulsatility Index in Singleton Pregnancies
- PMID: 28579623
- PMCID: PMC5444533
- DOI: 10.1055/s-0043-108764
Reference Curve for the Mean Uterine Artery Pulsatility Index in Singleton Pregnancies
Abstract
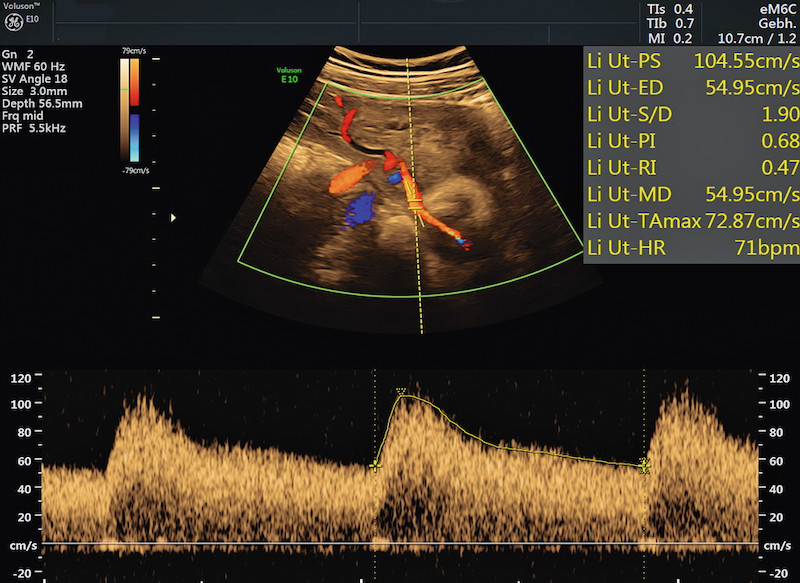
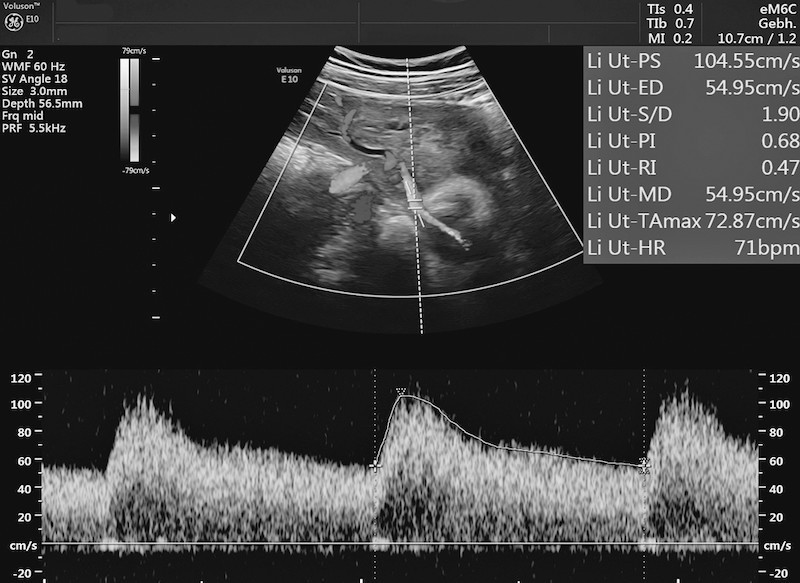
Introduction: Doppler sonography of the uterine artery (UA) is done to monitor pregnancies, because the detected flow patterns are useful to draw inferences about possible disorders of trophoblast invasion. Increased resistance in the UA is associated with an increased risk of preeclampsia and/or intrauterine growth restriction (IUGR) and perinatal mortality. In the absence of standardized figures, the normal ranges of the various available reference curves sometimes differ quite substantially from one another. The causes for this are differences in the flow patterns of the UA depending on the position of the pulsed Doppler gates as well as branching of the UA. Because of the discrepancies between the different reference curves and the practical problems this poses for guideline recommendations, we thought it would be useful to create our own reference curves for Doppler measurements of the UA obtained from a singleton cohort under standardized conditions.
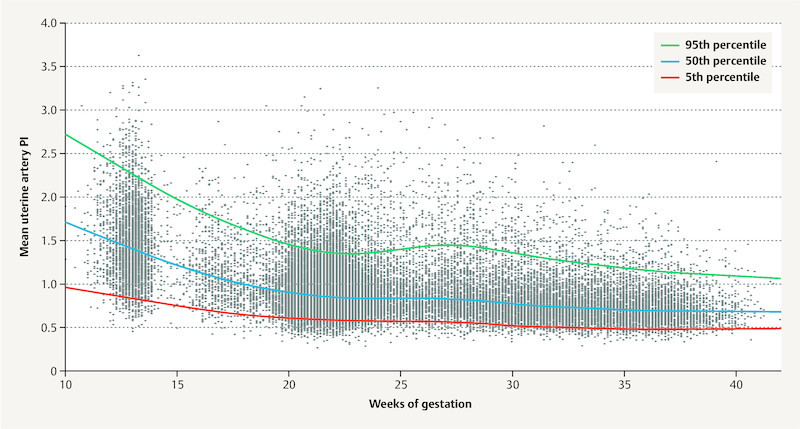
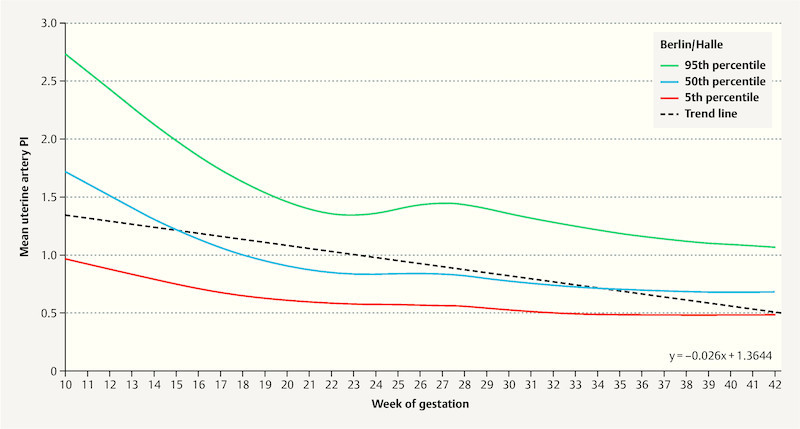
Material and methods: This retrospective cohort study was carried out in the Department of Obstetrics of the Charité - Universitätsmedizin Berlin, the Department for Obstetrics and Prenatal Medicine of the University Hospital Halle (Saale) and the Center for Prenatal Diagnostics and Human Genetics Kurfürstendamm 199. Available datasets from the three study locations were identified and reference curves were generated using the LMS method. Measured values were correlated with age of gestation, and a cubic model and Box-Cox power transformation (L), the median (M) and the coefficient of variation (S) were used to smooth the curves.
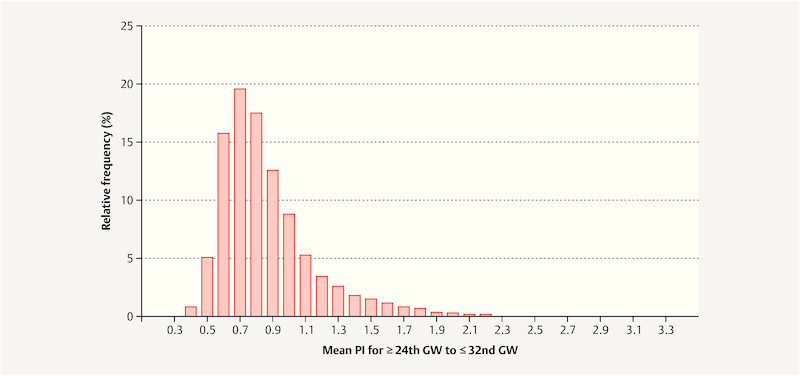
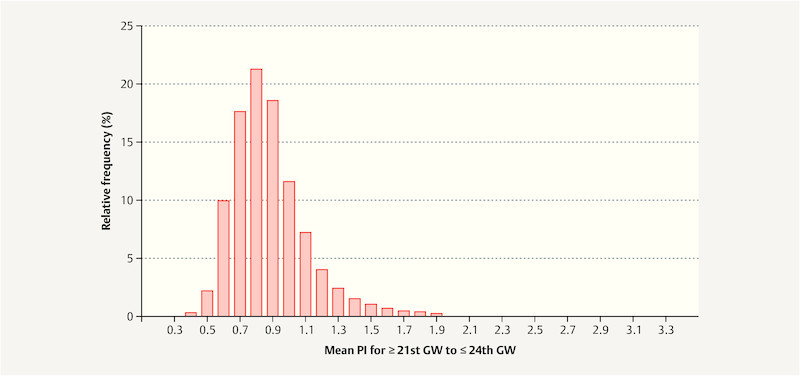
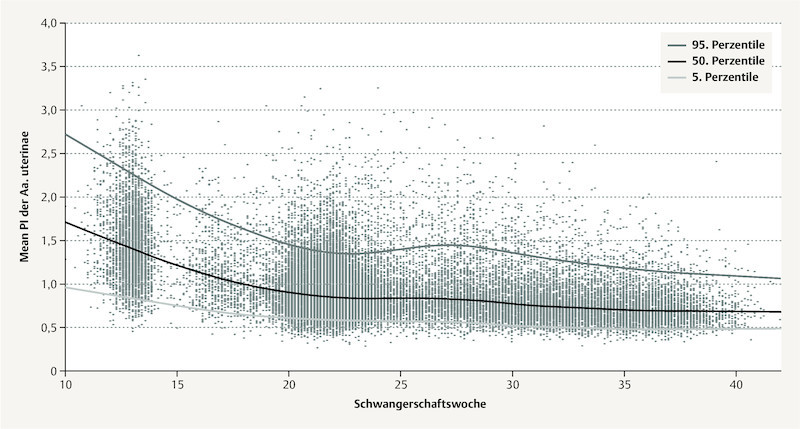
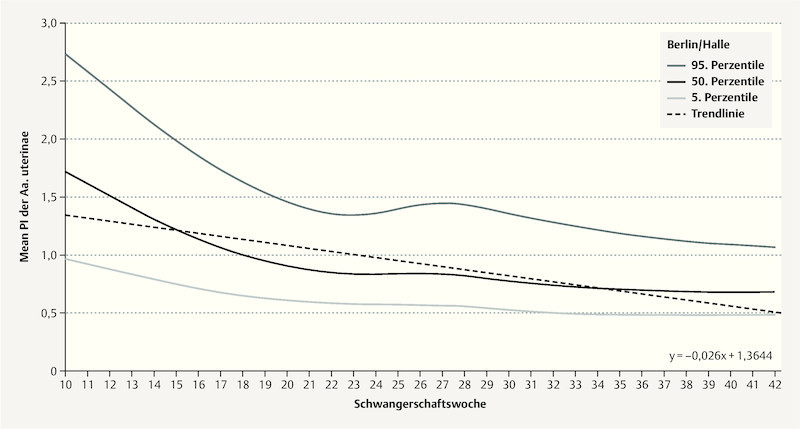
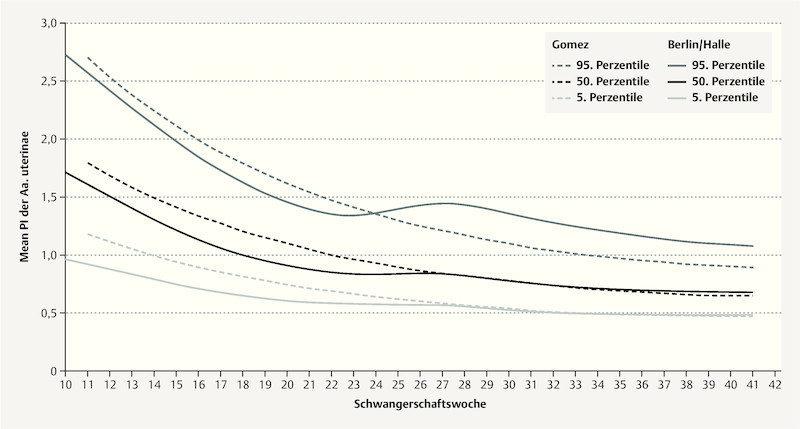
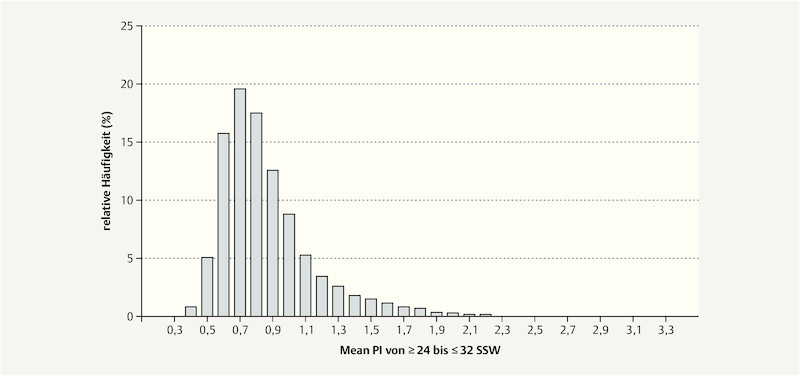
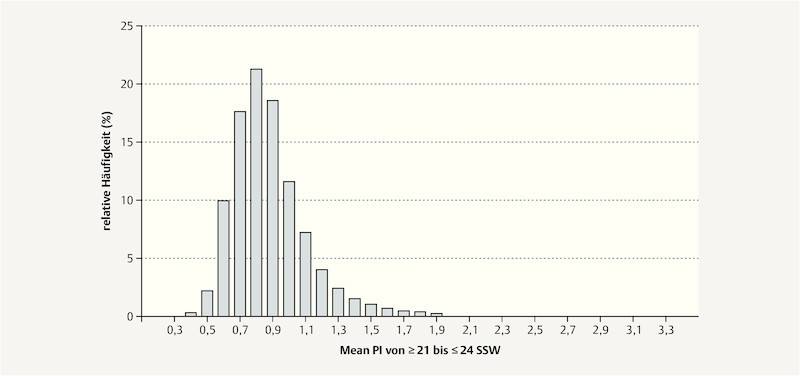
Results: 103 720 Doppler examinations of the UA carried out in singleton pregnancies from the 11th week of gestation (10 + 1 GW) were analyzed. The mean pulsatility index (Mean PI) showed a continuous decline over the course of pregnancy, dropping to a plateau of around 0.84 between the 23rd and 27th GW, after which it decreased again.
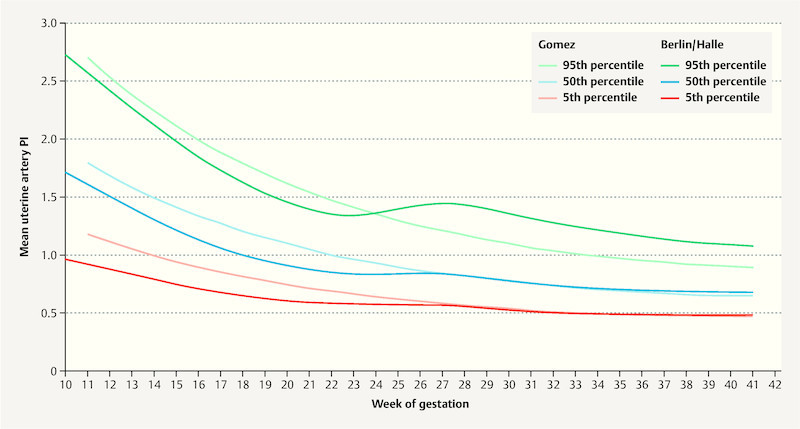
Conclusion: Age of gestation, placental position, position of pulsed Doppler gates and branching of the UA can all change the flow pattern. The mean pulsatility index (Mean PI) showed a continuous decrease over time. There were significant differences between our data and alternative reference curves. A system of classifying Doppler studies and a reference curve adapted to the current technology are urgently required to differentiate better between physiological and pathological findings.
Einleitung Die Doppler-Sonografie der Arteria uterina (AU) wird zur Überwachung von Schwangerschaften eingesetzt, weil durch ihr Flussmuster auf eine gestörte Trophoblasteninvasion geschlossen werden kann. Erhöhte Widerstände in der AU werden mit einem erhöhten Risiko für eine Präeklampsie und/oder intrauterine Wachstumsverzögerung (intrauterine growth restriction, IUGR) sowie perinatalem Tod assoziiert. Mangels Standardisierung weichen die Normbereiche der unterschiedlichen Referenzkurven teils erheblich voneinander ab. Ursächlich hierfür sind Unterschiede im Flussmuster der AU in Abhängigkeit der Position des Pulsed-Doppler-Gates sowie mögliche Verzweigungen der AU. Aufgrund der Diskrepanzen der unterschiedlichen Referenzkurven und der praktischen Probleme der Leitlinienempfehlungen schien es uns sinnvoll, eigene Referenzkurven für die Doppler-Messung der AU an einem Einlingskollektiv unter standardisierten Bedingungen zu erstellen. Material und Methoden Die vorliegende retrospektive Kohortenstudie erfolgte in der Klinik für Geburtsmedizin der Charité – Universitätsmedizin Berlin, der Klinik für Geburtshilfe und Pränatalmedizin des Universitätsklinikums Halle (Saale) und dem Zentrum für Pränataldiagnostik und Humangenetik Kurfürstendamm 199. Verfügbare Datensätze der Studienstandorte wurden identifiziert und Referenzkurven mittels LMS-Methode erstellt, bei welcher die Messwerte entsprechend dem Gestationsalter in einem kubischen Modell durch Box-Cox-Power-Transformation (L), den Median (M) und den Variationskoeffizienten (S) geglättet wurden. Ergebnisse 103 720 Doppler-Untersuchungen der AU bei Einlingsschwangerschaften ab der 11. Schwangerschaftswoche (10 + 1 SSW) wurden analysiert. Der Median des mittleren Pulsatilitätsindex (Mean PI) zeigte im Verlauf des Schwangerschaftsalters einen kontinuierlichen Abfall auf ein Plateau, wobei dieser zwischen ca. 23 und 27 SSW bei etwa 0,84 lag, um im folgenden Verlauf weiter abzufallen. Schlussfolgerung Durch Gestationsalter, Plazentalage, die Position des Pulse-Doppler-Gates und mögliche Aufzweigungen der AU ändert sich auch das Flussmuster. Der Median des mittleren Pulsatilitätsindex (Mean PI) zeigt einen kontinuierlichen Abfall. Im Vergleich zu alternativen Referenzkurven ergeben sich deutliche Unterschiede. Eine Systematik für Doppler-Studien und eine der Technik angepasste Referenzkurve ist zwingend erforderlich, um besser zwischen physiologischen und pathologischen Befunden differenzieren zu können.
Keywords: Doppler; growth retardation; placenta; preeclampsia; ultrasound; uterine artery.
Conflict of interest statement
Die Autoren geben an, dass kein Interessenkonflikt besteht.
Figures
Similar articles
-
Use of placental growth factor and uterine artery doppler pulsatility index in pregnancies involving intrauterine fetal growth restriction or preeclampsia to predict perinatal outcomes.Gynecol Obstet Invest. 2015;80(2):99-105. doi: 10.1159/000370332. Epub 2015 Apr 22. Gynecol Obstet Invest. 2015. PMID: 25924544
-
Color Doppler ultrasound of spiral artery blood flow for prediction of hypertensive disorders and intra uterine growth restriction: a longitudinal study.Prenat Diagn. 2007 Nov;27(11):1011-6. doi: 10.1002/pd.1822. Prenat Diagn. 2007. PMID: 17721908 Clinical Trial.
-
Umbilical and fetal middle cerebral artery Doppler reference ranges in a twin population followed longitudinally from 24 to 38 weeks' gestation.Ultrasound Obstet Gynecol. 2014 Oct;44(4):461-7. doi: 10.1002/uog.13302. Epub 2014 Sep 5. Ultrasound Obstet Gynecol. 2014. PMID: 24407772
-
Sequential changes in uterine artery blood flow pattern between the first and second trimesters of gestation in relation to pregnancy outcome.Ultrasound Obstet Gynecol. 2006 Nov;28(6):802-8. doi: 10.1002/uog.2814. Ultrasound Obstet Gynecol. 2006. PMID: 17063456 Review.
-
Obstetrical complications associated with abnormal maternal serum markers analytes.J Obstet Gynaecol Can. 2008 Oct;30(10):918-932. doi: 10.1016/S1701-2163(16)32973-5. J Obstet Gynaecol Can. 2008. PMID: 19038077 Review. English, French.
Cited by
-
Anxiety and Uterine Artery Doppler Flow in A Population of Pregnant Women of High Risk Down Syndrome Fetus: A Prospective Cohort Study.Int J Fertil Steril. 2023 Jan 1;17(1):52-56. doi: 10.22074/ijfs.2022.534209.1159. Int J Fertil Steril. 2023. PMID: 36617203 Free PMC article.
-
Doppler Indices of the Uterine, Umbilical and Fetal Middle Cerebral Artery in Diabetic versus Non-Diabetic Pregnancy: Systematic Review and Meta-Analysis.Medicina (Kaunas). 2023 Aug 21;59(8):1502. doi: 10.3390/medicina59081502. Medicina (Kaunas). 2023. PMID: 37629792 Free PMC article.
-
Cross-modality and in-vivo validation of 4D flow MRI evaluation of uterine artery blood flow in human pregnancy.Ultrasound Obstet Gynecol. 2021 Nov;58(5):722-731. doi: 10.1002/uog.23112. Epub 2021 Oct 7. Ultrasound Obstet Gynecol. 2021. PMID: 32898295 Free PMC article.
-
Maternal plasma fetuin-A levels in fetal growth restriction: A case-control study.Int J Reprod Biomed. 2019 Jul 31;17(7):487-492. doi: 10.18502/ijrm.v17i7.4860. eCollection 2019 Jul. Int J Reprod Biomed. 2019. PMID: 31508574 Free PMC article.
References
-
- Robertson W B, Brosens I, Dixon G. Uteroplacental vascular pathology. Eur J Obstet Gynecol Reprod Biol. 1975;5:47–65. - PubMed
-
- Lin S, Shimizu I, Suehara N. Uterine artery Doppler velocimetry in relation to trophoblast migration into the myometrium of the placental bed. Obstet Gynecol. 1995;85:760–765. - PubMed
-
- Khong T Y, De Wolf F, Robertson W B. Inadequate maternal vascular response to placentation in pregnancies complicated by pre-eclampsia and by small-for-gestational age infants. Br J Obstet Gynaecol. 1986;93:1049–1059. - PubMed
-
- Papageorghiou A T, Yu C K, Nicolaides K H. The role of uterine artery Doppler in predicting adverse pregnancy outcome. Best Pract Res Clin Obstet Gynaecol. 2004;18:383–396. - PubMed
-
- Poon L C, Volpe N, Muto B. Second-trimester uterine artery Doppler in the prediction of stillbirths. Fetal Diagn Ther. 2013;33:28–35. - PubMed
LinkOut - more resources
Full Text Sources
Other Literature Sources
Research Materials
Miscellaneous