. 2017 May 24:9:365-373.
doi: 10.2147/BCTT.S131334. eCollection 2017.

The regulation of steroid receptors by epigallocatechin-3-gallate in breast cancer cells

Affiliations

The regulation of steroid receptors by epigallocatechin-3-gallate in breast cancer cells

Kelly Hallman et al. Breast Cancer (Dove Med Press). .

Abstract

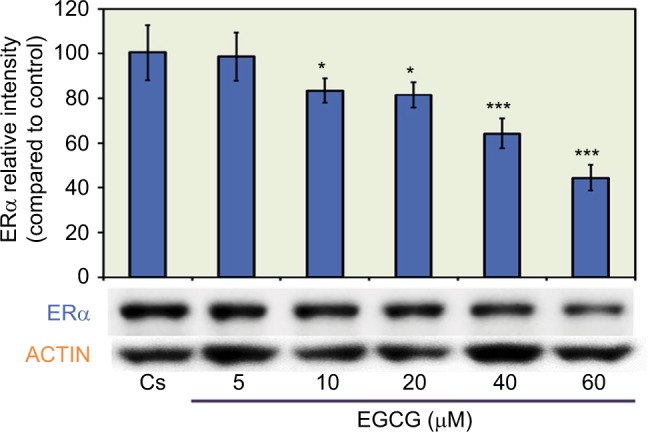
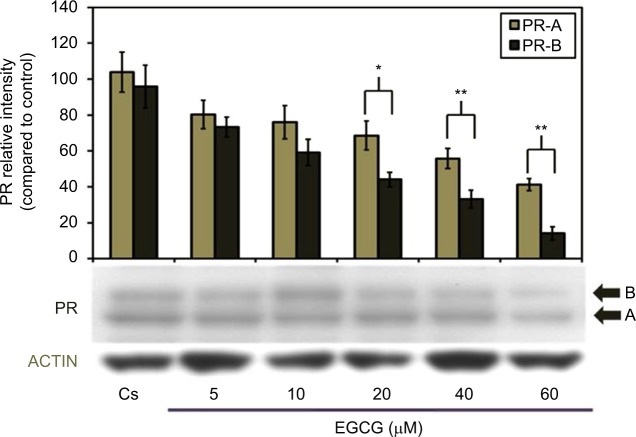
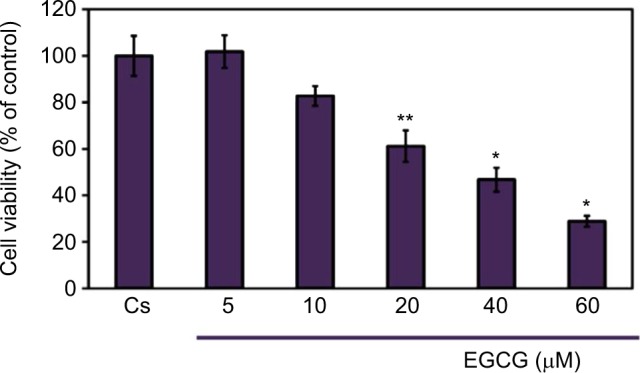
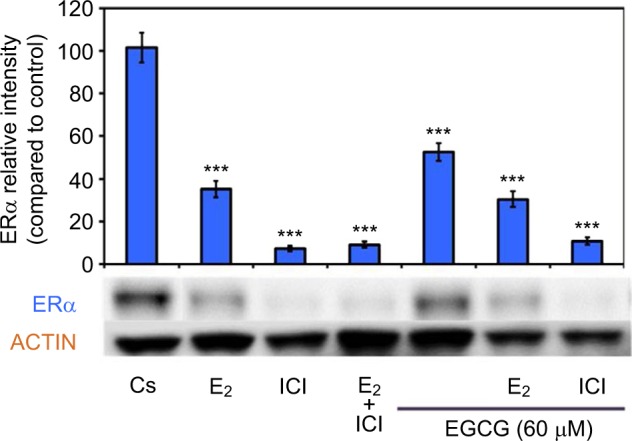
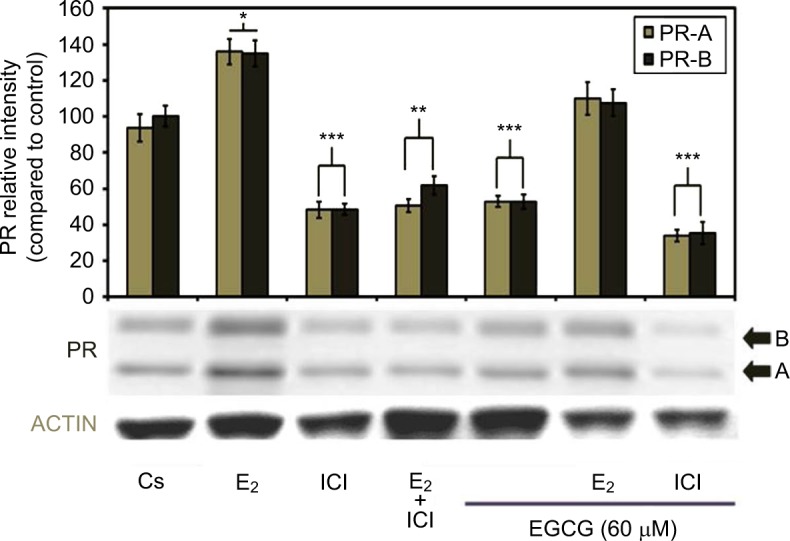
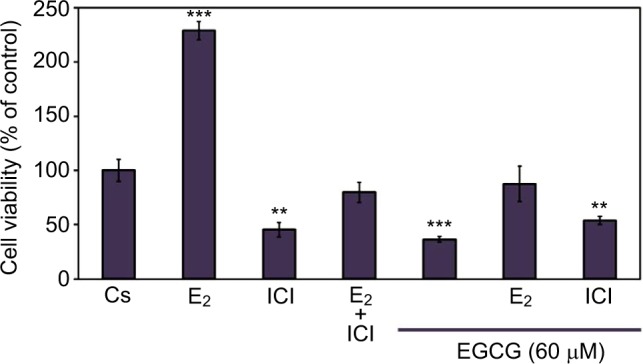
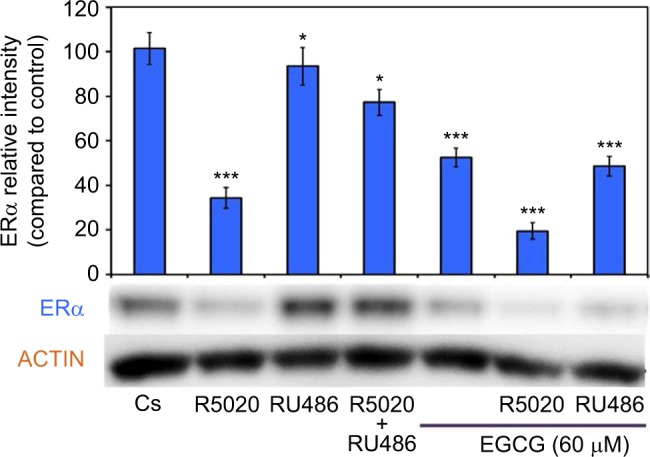
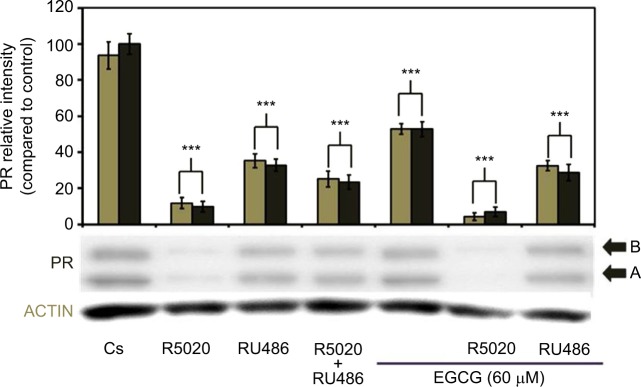
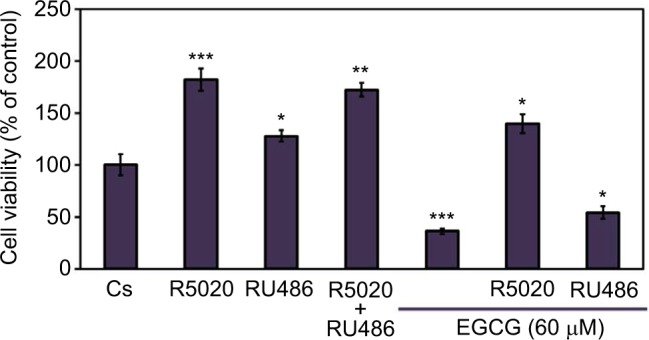
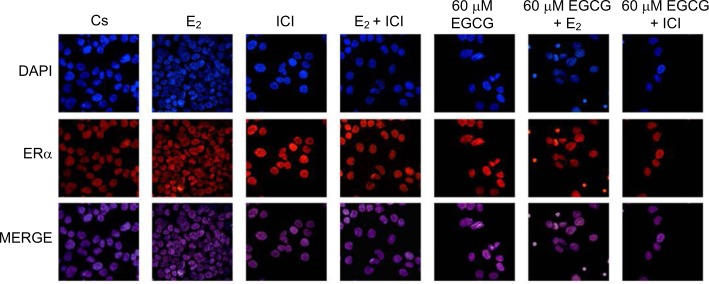
It has been reported that phytoestrogen epigallocatechin gallate (EGCG) suppresses cancer cell proliferation and may have antitumor properties. In this study, we analyzed the effects of EGCG on estrogen receptor α (ERα) and progesterone receptor in hormone-dependent T-47D breast cancer cells. Western blot analysis revealed EGCG induced a concentration-dependent decrease in ERα protein levels, with a 56% reduction occurring with 60 µM EGCG when compared to controls. Downregulation of ERα protein levels was observed after 24-hour co-treatment of T-47D cells with 60 µM EGCG and 10 nM 17β-estradiol (E2). The proliferative effect of E2 on cell viability was reversed when treated in combination with EGCG. In contrast, the combination of EGCG with the pure ER antagonist, ICI 182, 780, showed no further reduction in cell number as only 5% of the cells were viable after 6 days of treatment. These studies may provide further understanding of the interactions among flavonoids and steroid receptors in breast cancer cells.

Keywords: ER; PR; T-47D; antiestrogens; phytoestrogen.


Conflict of interest statement

Disclosure The authors report no conflicts of interest in this work.

Figures

Figure 1
Figure 1
Concentration-dependent effects of EGCG on ERα protein expression levels in T-47D cells. Notes: Following 24-hour treatment with 5–60 μM EGCG, T-47D cells were subjected to SDS-PAGE and Western blot analysis. The control lane, labeled Cs, represents cells grown in a medium containing 5% DCC-FBS in the absence of ligands. The relative intensity of ERα protein, compared to Cs, is displayed as the mean ± SEM. *Indicates a significant difference from the control at p<0.05, while ***indicates a significant difference at p<0.001 (Kruskal–Wallis Test followed by post hoc analysis using Mann–Whitney U-test). Three independent experiments are displayed in the representative blots. Abbreviations: EGCG, epigallocatechin gallate; ERα, estrogen receptor α; DCC-FBS, dextran-coated charcoal-treated fetal bovine serum; SEM, standard error of mean.
Figure 2
Figure 2
Concentration-dependent effects of EGCG on PR-A/B protein expression levels in T-47D cells. Notes: T-47D cells were treated for 24 hours with 5–60 μM EGCG and then subjected to SDS-PAGE and Western blot analysis. The control lane, labeled Cs, represents cells grown in a medium containing 5% DCC-FBS in the absence of ligands. Relative intensities of PR-A/B protein, compared to Cs, are portrayed as the mean ± SEM. *Indicates a significant difference, compared to the control, at p<0.05 and **at p<0.01 (Kruskal–Wallis test followed by post hoc analysis using Mann–Whitney U-test). Three independent experiments are portrayed in the representative blots. Abbreviations: DCC-FBS, dextran-coated charcoal-treated fetal bovine serum; EGCG, epigallocatechin gallate; PR, progesterone receptor; SDS-PAGE, sodium dodecyl sulfate-polyacrylamide gel electrophoresis; SEM, standard error of mean.
Figure 3
Figure 3
Concentration-dependent effects of EGCG on T-47D cellular viability. Notes: T-47D cells were grown in 12-well plates containing approximately 30,000 cells per well. For 2 days, cells were provided 10% FBS media containing growth factors for growth. For the remaining 6 days, growth factor media was replaced with DCC-FBS media and ligands at 2-day intervals. The 6-day ligand treatments consisted of 5–60 μM EGCG, and was followed by a cell viability assay utilizing propidium iodide staining and image cytometry via the Nexcelom Cellometer Vision on the seventh day. *Denotes a significant difference, as compared to the control, at p<0.05, and **at p<0.01 (Kruskal–Wallis test followed by post hoc analysis using Mann–Whitney U-test). Three independent experiments are represented in the data. Abbreviations: DCC-FBS, dextran-coated charcoal-treated fetal bovine serum; EGCG, epigallocatechin gallate.
Figure 4
Figure 4
Effects of estrogens and antiestrogens in combination with EGCG on ERα protein expression levels in T-47D cells. Notes: T-47D cells were treated for 24 hours, either alone or in combination, with 60 μM EGCG, 10 nM E2, and 1 μM ICI. Following treatment, SDS-PAGE and Western blot analysis of ERα protein expression levels were conducted. Relative intensities of ERα protein bands, as compared to the control, are portrayed as the mean ± SEM. ***Indicates a significant difference, in relation to the control, at p<0.001 (Kruskal–Wallis test followed by post hoc analysis using Mann–Whitney U-test). Representative blots are shown for three independent experiments. Abbreviations: DCC-FBS, dextran-coated charcoal-treated fetal bovine serum; EGCG, epigallocatechin gallate; ERα, estrogen receptor α; SDS-PAGE, sodium dodecyl sulfate-polyacrylamide gel electrophoresis; SEM, standard error of mean; E2, 17β-estradiol; ICI, ICI 182,780.
Figure 5
Figure 5
Effects of estrogens and antiestrogens in combination with EGCG on PR-A/B protein expression levels in T-47D cells. Notes: T-47D cells were treated for 24 hours, either alone or in combination, with 60 μM EGCG, 10 nM E2, and 1 μM ICI. Following treatment, SDS-PAGE and Western blot analysis of PR-A/B protein expression levels were conducted. Protein band relative intensities, as compared to the control, are displayed as the mean ± SEM. ***Indicates a significant difference at p<0.001, **at p<0.01, *at p<0.05, in relation to the control (Kruskal–Wallis test followed by post hoc analysis using Mann–Whitney U-test). Representative blots are shown for three independent experiments. Abbreviations: DCC-FBS, dextran-coated charcoal-treated fetal bovine serum; EGCG, epigallocatechin gallate; PR, progesterone receptor; SDS-PAGE, sodium dodecyl sulfate-polyacrylamide gel electrophoresis; SEM, standard error of mean; E2, 17β-estradiol; ICI, ICI 182,780.
Figure 6
Figure 6
Effects of estrogens and antiestrogens in combination with EGCG on T-47D cellular viability. Notes: Twelve-well plates were utilized to grow approximately 30,000 T-47D cells per well. Cells were nourished for 2 days with 10% FBS media containing growth factors, followed by 2-day intervals of DCC-FBS media and ligand treatments for the remaining 6 days. Ligand treatments included 10 nM E2, 1 μM ICI, and 60 μM EGCG, alone or in combination. Propidium iodide staining and image cytometry via Nexcelom Cellometer Vision was implemented on the seventh day to determine cell viability. **Indicates a significant difference compared to Cs at p<0.01, and ***indicates a significant difference at p<0.001 (Kruskal–Wallis test followed by post hoc analysis using Mann–Whitney U-test). The representative data are displayed from results of three independent experiments. Abbreviations: DCC-FBS, dextran-coated charcoal-treated fetal bovine serum; EGCG, epigallocatechin gallate; E2, 17β-estradiol; ICI, ICI 182,780.
Figure 7
Figure 7
Effects of progestins and antiprogestins in combination with EGCG on ERα protein expression levels in T-47D cells. Notes: Treatment of 10 nM R5020, 10 nM RU486, and 60 μM EGCG, alone or in combination, was instilled on T-47D cells for 24 hours. SDS-PAGE and Western blot analysis were performed to determine ERα protein expression levels. ERα protein band intensity, as compared to the control, are portrayed as the mean ± SEM. *Indicates a significant difference, compared to Cs, at p<0.05. ***Indicates a significant difference, in relation to the control, at p<0.001 (Kruskal–Wallis test followed by post hoc analysis using Mann–Whitney U-test). Three independent experiments are displayed in the representative blots. Abbreviations: DCC-FBS, dextran-coated charcoal-treated fetal bovine serum; EGCG, epigallocatechin gallate; ERα, estrogen receptor α; SDS-PAGE, sodium dodecyl sulfate-polyacrylamide gel electrophoresis; SEM, standard error of mean.
Figure 8
Figure 8
Effects of progestins and antiprogestins in combination with EGCG on PR-A/B protein expression levels in T-47D cells. Notes: Twenty-four-hour treatment, either alone or in combination, with 10 nM R5020, 10 nM RU486, and 60 μM EGCG was implemented on T-47D cells. PR-A/B protein expression was determined utilizing SDS-PAGE and Western blot analysis. Relative band intensities of PR-A/B, compared to Cs, are displayed as the mean ± SEM. ***Indicates a significant difference at p<0.001, compared to the control (Kruskal–Wallis test followed by post hoc analysis using Mann–Whitney U-test). Representative blots from three independent experiments are portrayed. Abbreviations: DCC-FBS, dextran-coated charcoal-treated fetal bovine serum; EGCG, epigallocatechin gallate; PR, progesterone receptor; SDS-PAGE, sodium dodecyl sulfate-polyacrylamide gel electrophoresis; SEM, standard error of mean.
Figure 9
Figure 9
Effects of progestins and antiprogestins in combination with EGCG on T-47D cellular viability. Notes: Cells were cultured with 10% FBS media containing growth factors for 2 days in 12-well plates housing approximately 30,000 T-47D cells per well. For the remaining 6 days, cells were treated at 2-day intervals with DCC-FBS media and ligands, alone or in combination, with 10 nM R5020, 10 nM RU486, and 60 μM EGCG. On the seventh day, cell viability assays were performed using propidium iodide staining and image cytometry with the Nexcelom Cellometer Vision. *Indicates a significant difference, in relation to the control, at p<0.05, while **indicates a significant difference compared to Cs at p<0.01, and ***indicates at p<0.001 (Kruskal–Wallis test followed by post hoc analysis using Mann–Whitney U-test). Three independent experiments are represented in the data results. Abbreviations: DCC-FBS, dextran-coated charcoal-treated fetal bovine serum; EGCG, epigallocatechin gallate.
Figure 10
Figure 10
Effects of EGCG on the immunolocalization of ERα in T-47D cells. Notes: Cytolocalization of cellular ERα was determined utilizing confocal microscopy involving immunofluorescence. Treatments, either alone or in combination, with 60 μM EGCG, 10 nM E2, and 1 μM ICI were implemented on T-47D cells. DAPI images, stained to display the cell nuclei, were merged with images stained for ERα localization to further demonstrate the nuclear localization of the protein ERα. Abbreviations: DAPI, diamidino-2-phenylindole; EGCG, epigallocatechin gallate; ERα, estrogen receptor α; E2, 17β-estradiol; ICI, ICI 182,780.

References

    1. Wiechmann L, Kuerer HM. The molecular journey from ductal carcinoma in situ to invasive breast cancer. Cancer. 2008;112(10):2130–2142. - PubMed
    1. Vaidya Y, Vaidya P, Vaidya T. Ductal carcinoma in situ of the breast. Indian J Surg. 2015;77(2):141–146. - PMC - PubMed
    1. Cowell CF, Weigelt B, Sakr RA, et al. Progression from ductal carcinoma in situ to invasive breast cancer: revisited. Mol Oncol. 2013;7(5):859–869. - PMC - PubMed
    1. Siebert AE, Sanchez AL, Dinda S, Moudgil VK. Effects of estrogen metabolite 2-methoxyestradiol on tumor suppressor protein p53 and proliferation of breast cancer cells. Syst Biol Reprod Med. 2011;57(6):279–287. - PubMed
    1. De Angelis M, Stossi F, Waibel M, Katzenellenbogen BS, Katzenellenbogen JA. Isocoumarins as estrogen receptor beta selective ligands: isomers of isoflavone phytoestrogens and their metabolites. Bioorg Med Chem. 2005;13(23):6529–6542. - PubMed