. 2017 May 1;8(5):3789-3798.
doi: 10.1039/c6sc05632f. Epub 2017 Mar 8.

Electronic properties of the boroxine-gold interface: evidence of ultra-fast charge delocalization

Affiliations

Electronic properties of the boroxine-gold interface: evidence of ultra-fast charge delocalization

Daniele Toffoli et al. Chem Sci. .

Abstract

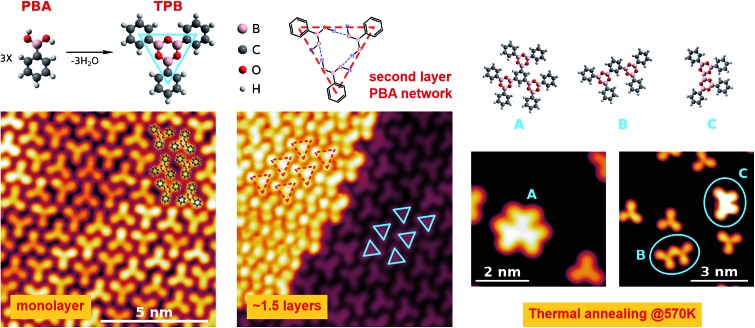
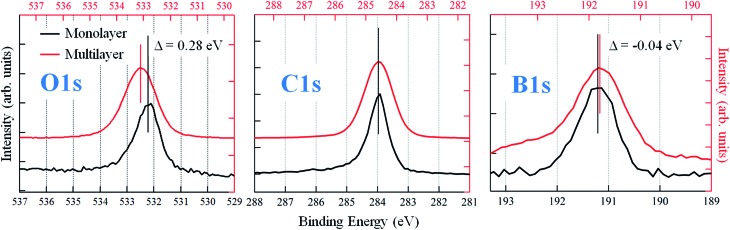
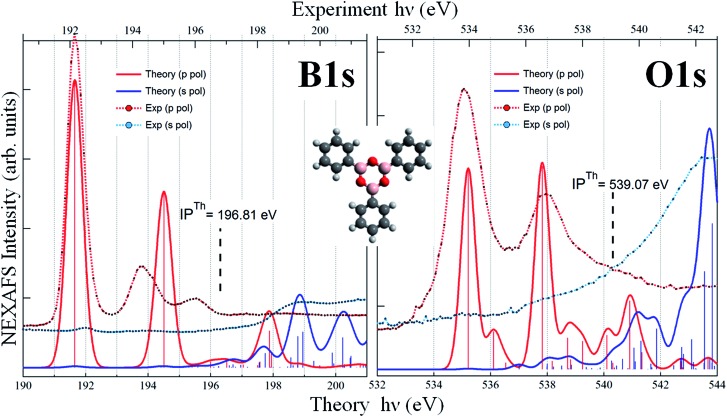
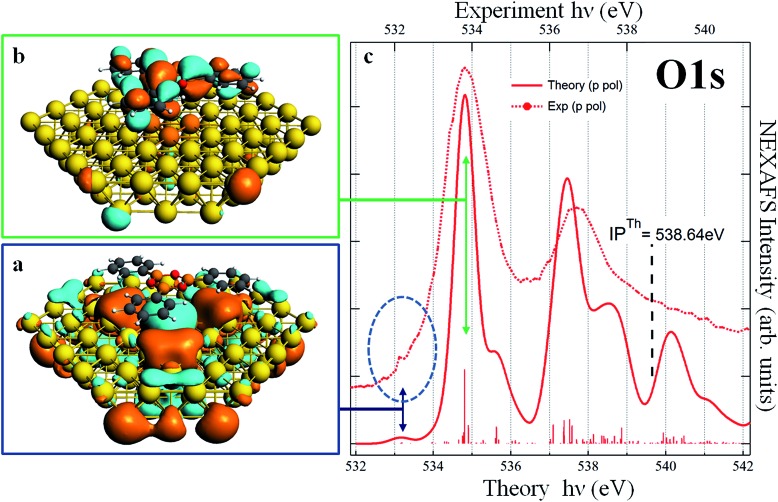
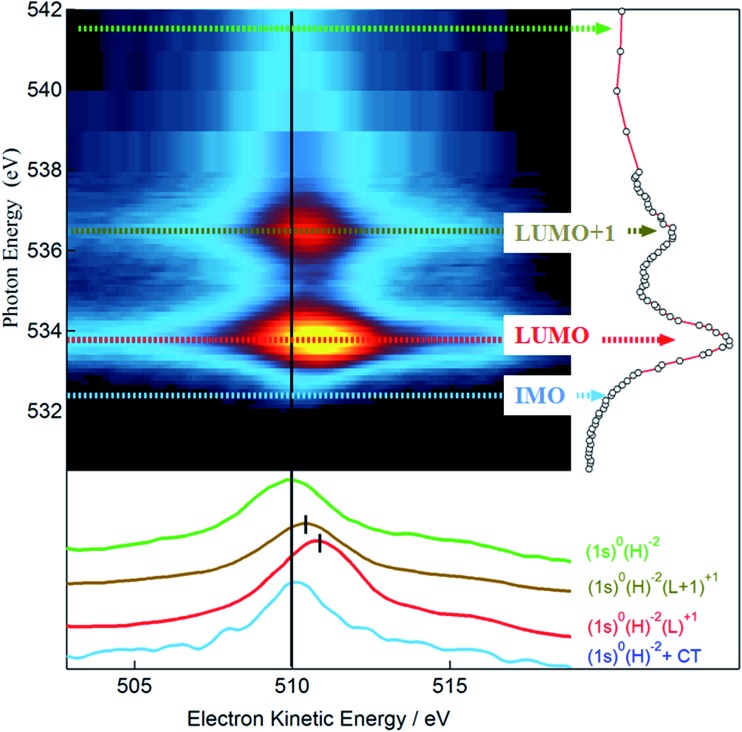
We performed a combined experimental and theoretical study of the assembly of phenylboronic acid on the Au(111) surface, which is found to lead to the formation of triphenylboroxines by spontaneous condensation of trimers of molecules. The interface between the boroxine group and the gold surface has been characterized in terms of its electronic properties, revealing the existence of an ultra-fast charge delocalization channel in the proximity of the oxygen atoms of the heterocyclic group. More specifically, the DFT calculations show the presence of an unoccupied electronic state localized on both the oxygen atoms of the adsorbed triphenylboroxine and the gold atoms of the topmost layer. By means of resonant Auger electron spectroscopy, we demonstrate that this interface state represents an ultra-fast charge delocalization channel. Boroxine groups are among the most widely adopted building blocks in the synthesis of covalent organic frameworks on surfaces. Our findings indicate that such systems, typically employed as templates for the growth of organic films, can also act as active interlayers that provide an efficient electronic transport channel bridging the inorganic substrate and organic overlayer.


Figures

Fig. 1
Fig. 1. Top panel: Schematic representation of the PBA and TPB molecules (left) and of the suggested hydrogen bonding network of PBA trimers forming the second molecular layer (center). Models on the right (A–C) represent possible configurations for the polymerized structures obtained upon thermal annealing at 570 K. Bottom panels: STM images of the monolayer (left), of the 1.5 layer (center) and of the sub-monolayer obtained upon thermal annealing at 570 K (right). Blue and red triangles indicate the size and shape of the TPB molecule and PBA trimers forming the first and second layer, respectively. STM images parameters: left, V s = –2.0 V, I t = 0.5 nA, 10 × 10 nm2; center, V s = +0.1 V, I t = 0.1 nA, 10 × 10 nm2; right small images: V s = +0.1 V, I t = 0.5 nA, 5 × 5 nm2, and V s = –2 V, I t = 0.2 nA, 7 × 7 nm2, respectively.
Fig. 2
Fig. 2. O 1s, C 1s and B 1s X-ray photoelectron spectra of the multilayer (estimated thickness: 55 Å) and monolayer phases. The binding energies of the peaks have been obtained by fitting the curves with Gaussian functions. The energy scales (top and bottom axes) have been rigidly shifted by 0.6 eV in order to align the C 1s signal of the two films. Both the different values of the residual shift observed for O 1s and B 1s in the monolayer and a change in the O 1s/B 1s intensity ratio can be explained with the presence of boroxinated molecules at the organo-metallic interface.
Fig. 3
Fig. 3. B 1s (left) and O 1s (right) NEXAFS spectra of the TPB as calculated (free molecule) and measured (monolayer) at the two different polarization angles. Bottom and top axes report the theoretical and experimental photon energy scales respectively.
Fig. 4
Fig. 4. TPB@Au(111). Panels (a) and (b): plot of the calculated DFT-TP final state involved in the O 1s transition at 533.2 eV and 534.8 eV respectively. Panel (c): comparison of the experimental (already shown in Fig. 3, right panel) and calculated p-pol O 1s NEXAFS spectra.
Fig. 5
Fig. 5. Oxygen K-edge RAES map of the TPB monolayer. RAES color intensity is shown as a function of photon energy and electron kinetic energy. The corresponding NEXAFS spectrum is shown alongside. Colored, dotted arrows indicate photon energies where single RAES spectra, displayed in the bottom panel, have been measured. The electronic configuration of the final states is indicated for each resonant scan, with the labels reporting the electronic balance in the core level (1s), valence band (H) and LUMO orbital (L) involved in the transition. The IMO Auger line shows no spectator shift, consistent with ultrafast charge transfer to the Au substrate from this orbital.

Similar articles

Cited by

References

    1. Hall D. G., Boronic Acids. Preparation and Applications in Organic Synthesis and Medicine, Wiley-VCH Verlag GmbH & Co. KGaA, Weinheim, FRG, 2006.
    1. Nishiyabu R., Kubo Y., James T. D., Fossey J. S. Chem. Commun. 2011;47:1124–1150. - PubMed
    1. Kubo Y., Nishiyabu R., James T. D. Chem. Commun. 2014;51:2005–2020. - PubMed
    1. Feng X., Ding X., Jiang D. Chem. Soc. Rev. 2012;41:6010. - PubMed
    1. Waller P. J., Gándara F., Yaghi O. M. Acc. Chem. Res. 2015;48:3053–3063. - PubMed

LinkOut - more resources