

GluA2-Lacking AMPA Receptors and Nitric Oxide Signaling Gate Spike-Timing-Dependent Potentiation of Glutamate Synapses in the Dorsal Raphe Nucleus
- PMID: 28580416
- PMCID: PMC5454404
- DOI: 10.1523/ENEURO.0116-17.2017
GluA2-Lacking AMPA Receptors and Nitric Oxide Signaling Gate Spike-Timing-Dependent Potentiation of Glutamate Synapses in the Dorsal Raphe Nucleus
Abstract
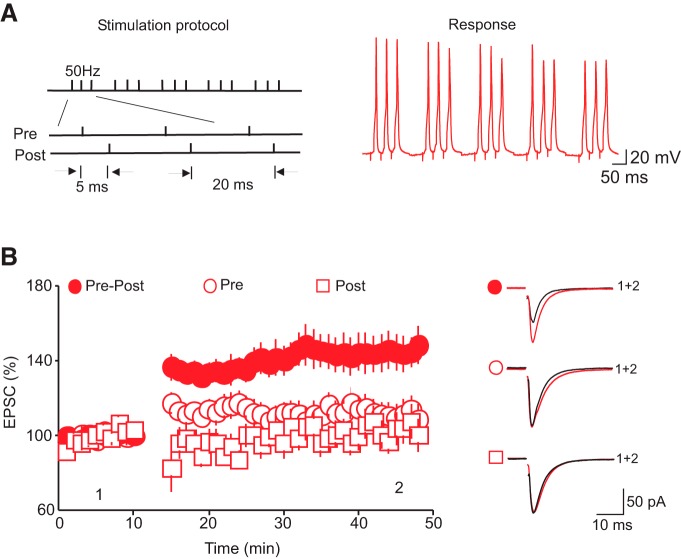
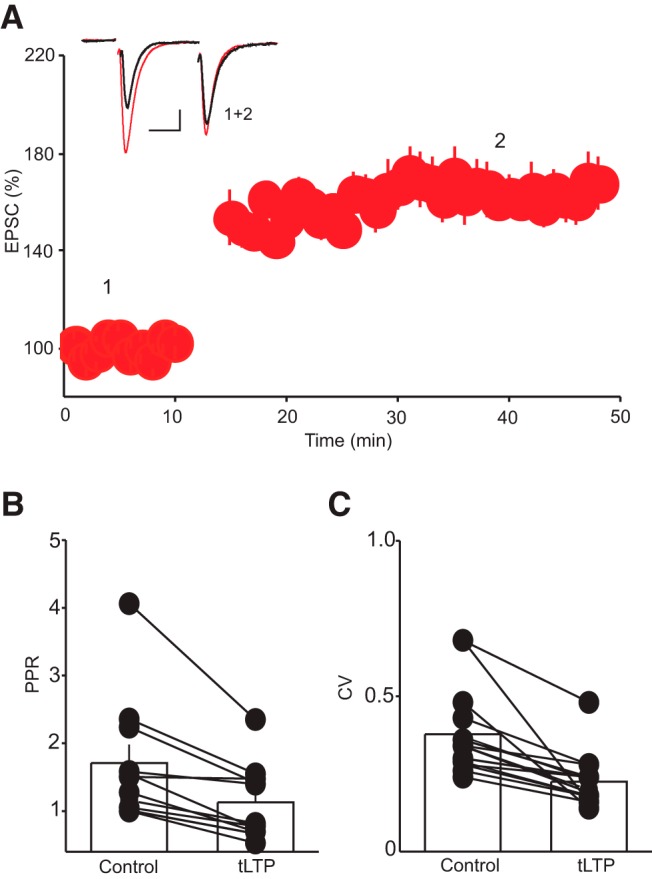
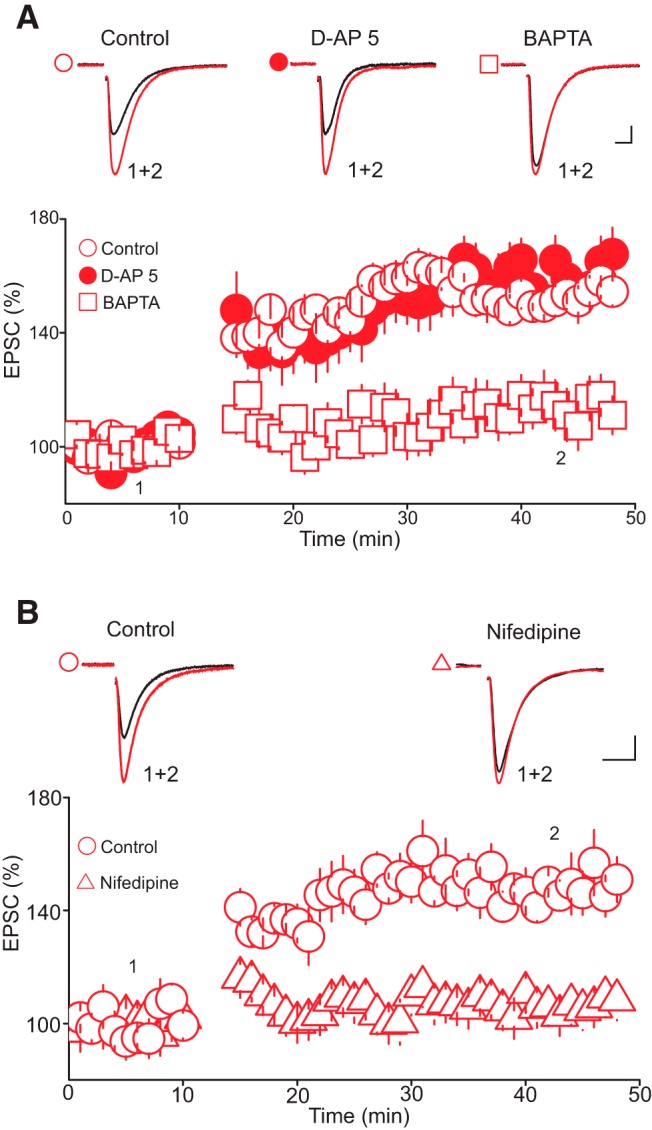
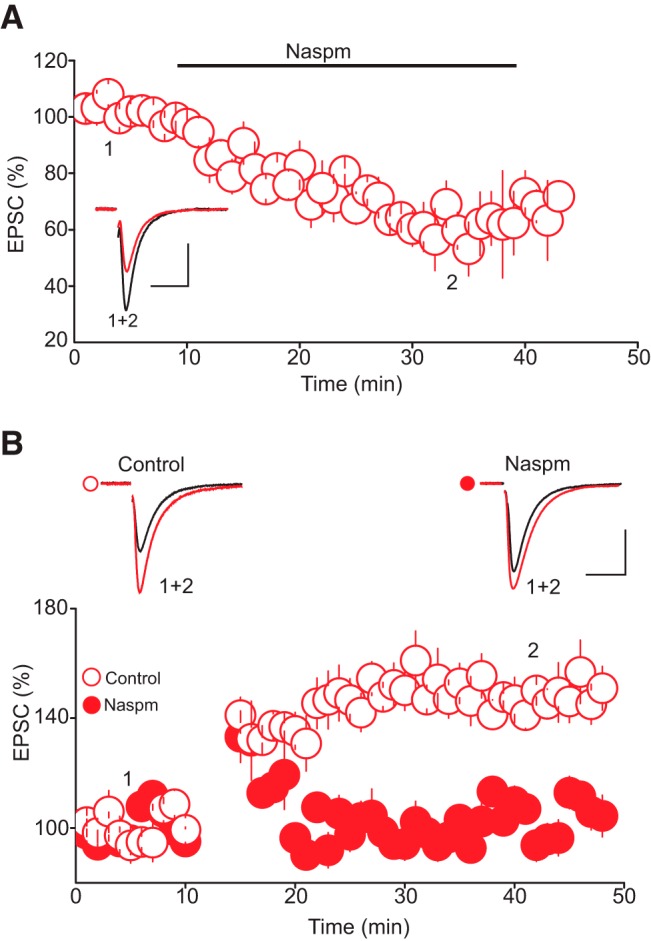
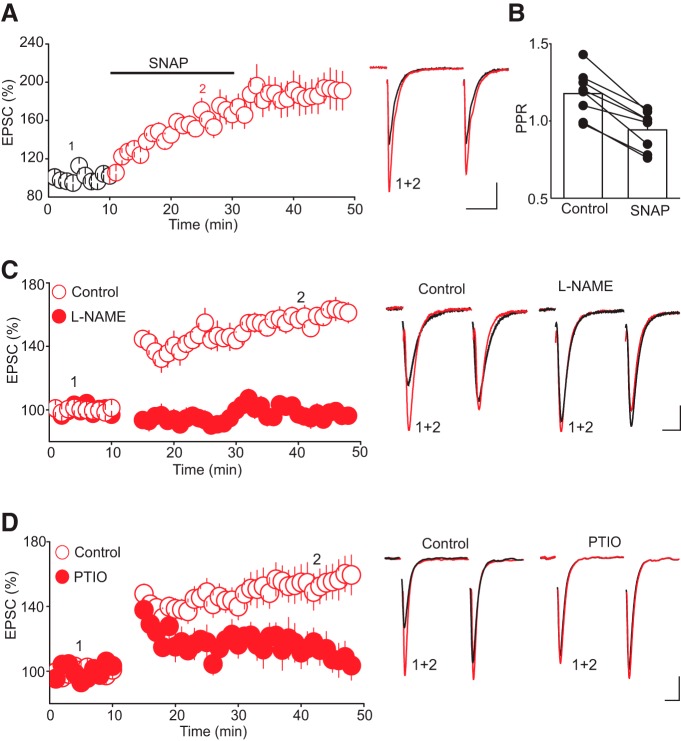
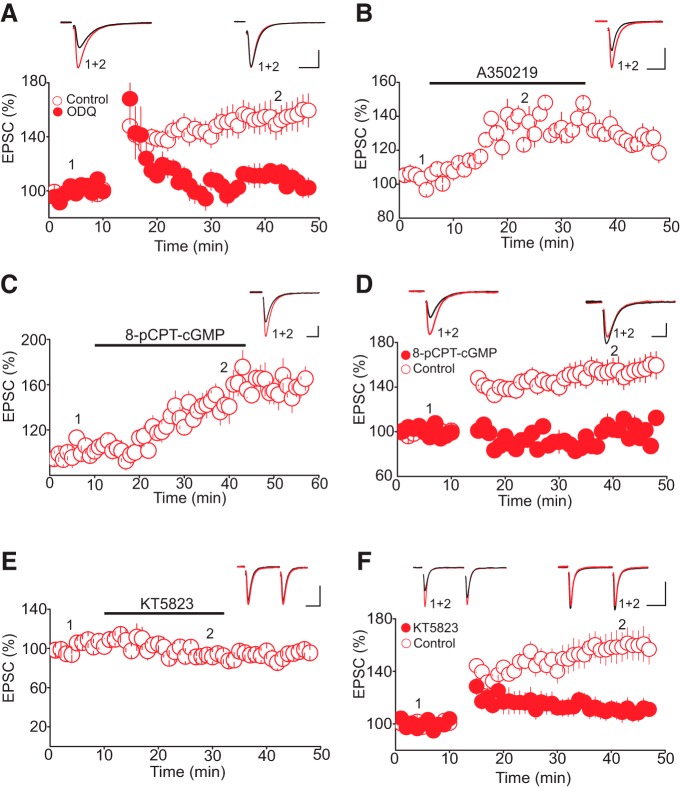
The dorsal raphe nucleus (DRn) receives glutamatergic inputs from numerous brain areas that control the function of DRn serotonin (5-HT) neurons. By integrating these synaptic inputs, 5-HT neurons modulate a plethora of behaviors and physiological functions. However, it remains unknown whether the excitatory inputs onto DRn 5-HT neurons can undergo activity-dependent change of strength, as well as the mechanisms that control their plasticity. Here, we describe a novel form of spike-timing-dependent long-term potentiation (tLTP) of glutamate synapses onto rat DRn 5-HT neurons. This form of synaptic plasticity is initiated by an increase in postsynaptic intracellular calcium but is maintained by a persistent increase in the probability of glutamate release. The tLTP of glutamate synapses onto DRn 5-HT is independent of NMDA receptors but requires the activation of calcium-permeable AMPA receptors and voltage-dependent calcium channels. The presynaptic expression of the tLTP is mediated by the retrograde messenger nitric oxide (NO) and activation of cGMP/PKG pathways. Collectively, these results indicate that glutamate synapses in the DRn undergo activity-dependent synaptic plasticity gated by NO signaling and unravel a previously unsuspected role of NO in controlling synaptic function and plasticity in the DRn.
Keywords: AMPA; LTP; NMDA; dorsal raphe; nitric oxide; serotonin.
Conflict of interest statement
Authors report no conflict of interest.
Figures
Similar articles
-
Presynaptic α4β2 nicotinic acetylcholine receptors increase glutamate release and serotonin neuron excitability in the dorsal raphe nucleus.J Neurosci. 2012 Oct 24;32(43):15148-57. doi: 10.1523/JNEUROSCI.0941-12.2012. J Neurosci. 2012. PMID: 23100436 Free PMC article.
-
AMPA and NMDA receptor regulation of firing activity in 5-HT neurons of the dorsal and median raphe nuclei.Eur J Neurosci. 2007 May;25(10):3001-8. doi: 10.1111/j.1460-9568.2007.05577.x. Epub 2007 May 17. Eur J Neurosci. 2007. PMID: 17509083
-
Chronic stress impairs α1-adrenoceptor-induced endocannabinoid-dependent synaptic plasticity in the dorsal raphe nucleus.J Neurosci. 2014 Oct 29;34(44):14560-70. doi: 10.1523/JNEUROSCI.1310-14.2014. J Neurosci. 2014. PMID: 25355210 Free PMC article.
-
Nicotinic modulation of serotonergic activity in the dorsal raphe nucleus.Rev Neurosci. 2013;24(5):455-69. doi: 10.1515/revneuro-2013-0012. Rev Neurosci. 2013. PMID: 24021594 Review.
-
The structure of the dorsal raphe nucleus and its relevance to the regulation of sleep and wakefulness.Sleep Med Rev. 2010 Oct;14(5):307-17. doi: 10.1016/j.smrv.2009.11.004. Epub 2010 Feb 12. Sleep Med Rev. 2010. PMID: 20153669 Review.
Cited by
-
Potentiation of Glutamatergic Synaptic Transmission Onto Dorsal Raphe Serotonergic Neurons in the Valproic Acid Model of Autism.Front Pharmacol. 2018 Oct 16;9:1185. doi: 10.3389/fphar.2018.01185. eCollection 2018. Front Pharmacol. 2018. PMID: 30459605 Free PMC article.
-
Modulation of AMPA Receptors by Nitric Oxide in Nerve Cells.Int J Mol Sci. 2020 Feb 1;21(3):981. doi: 10.3390/ijms21030981. Int J Mol Sci. 2020. PMID: 32024149 Free PMC article. Review.
-
Chemogenetic inhibition of prefrontal cortex inputs to dorsal raphe reduces anxiety behaviors in male rat model of fetal alcohol spectrum disorder.Sci Rep. 2025 Apr 24;15(1):14397. doi: 10.1038/s41598-025-99181-8. Sci Rep. 2025. PMID: 40275074 Free PMC article.
-
Selective vulnerability of dorsal raphe-medial prefrontal cortex projection neurons to corticosterone-induced hypofunction.Eur J Neurosci. 2019 Jul;50(1):1712-1726. doi: 10.1111/ejn.14355. Epub 2019 Feb 15. Eur J Neurosci. 2019. PMID: 30687960 Free PMC article.
-
Modulation of Spike-Timing Dependent Plasticity: Towards the Inclusion of a Third Factor in Computational Models.Front Comput Neurosci. 2018 Jul 3;12:49. doi: 10.3389/fncom.2018.00049. eCollection 2018. Front Comput Neurosci. 2018. PMID: 30018546 Free PMC article. Review.
References
-
- Boulton CL, Southam E, Garthwaite J (1995) Nitric oxide-dependent long-term potentiation is blocked by a specific inhibitor of soluble guanylyl cyclase. Neuroscience 69:699–703. - PubMed
MeSH terms
Substances
Grants and funding
LinkOut - more resources
Full Text Sources
Other Literature Sources