. 2017;1(3):69.
doi: 10.1038/s41559-016-0069. Epub 2017 Feb 17.

The evolution and population diversity of human-specific segmental duplications

Affiliations

The evolution and population diversity of human-specific segmental duplications

Megan Y Dennis et al. Nat Ecol Evol. 2017.

Abstract

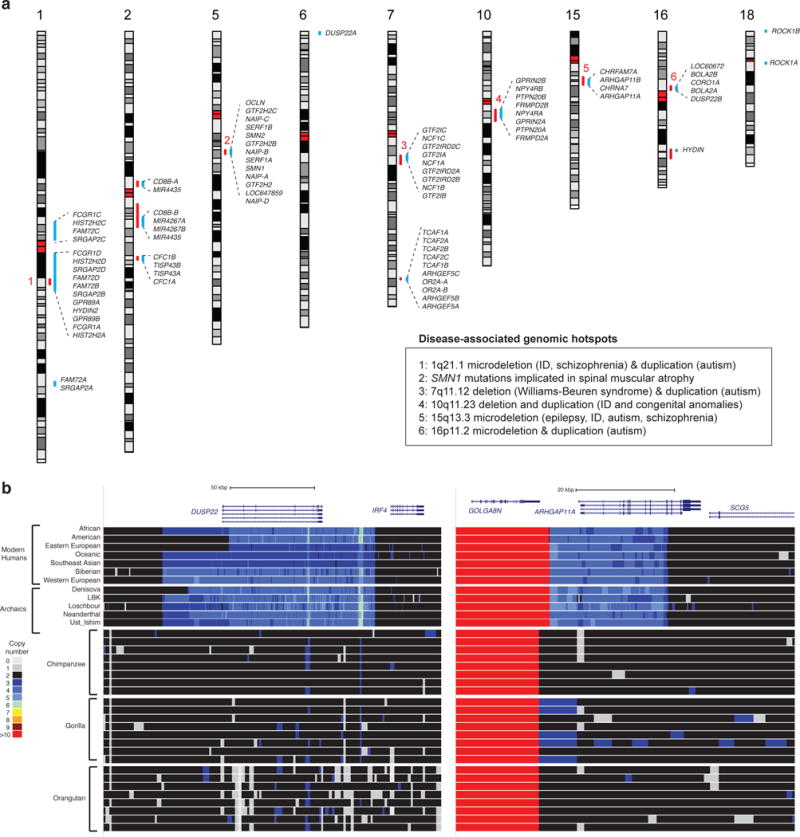
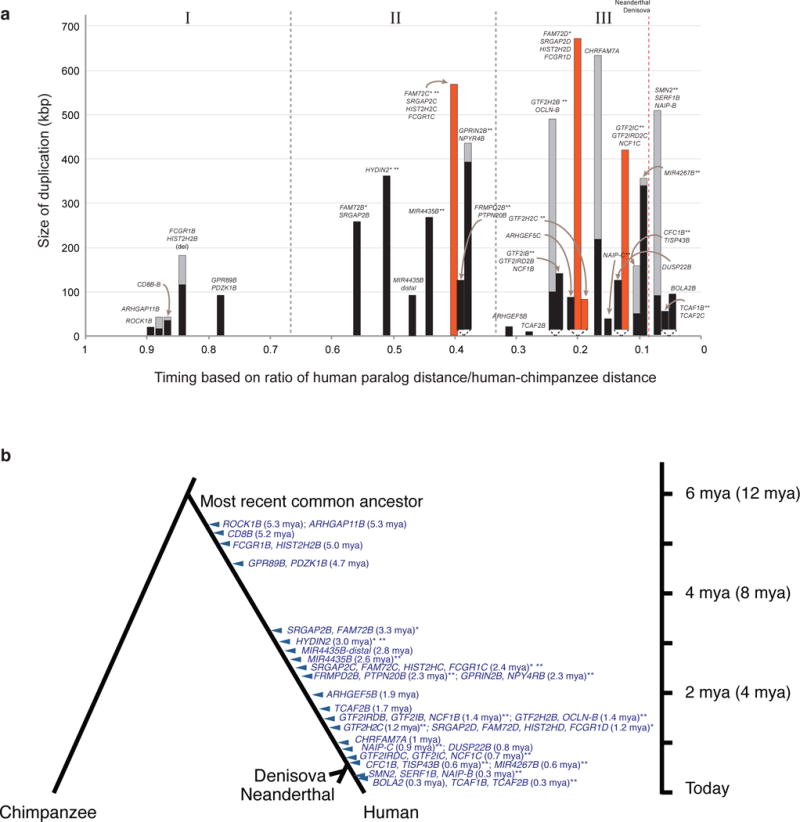
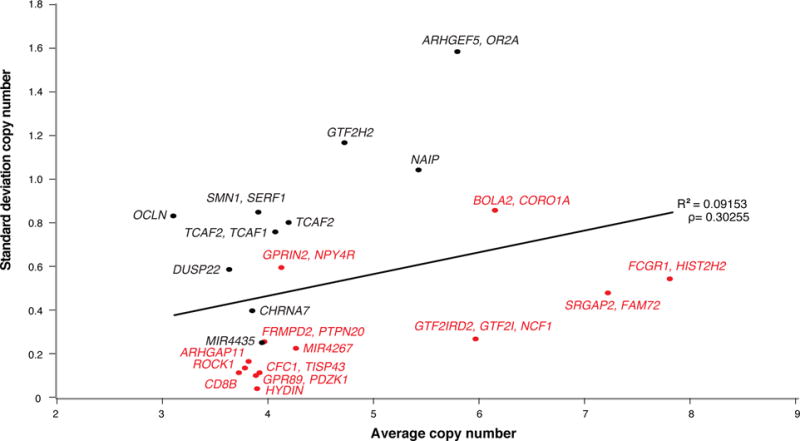
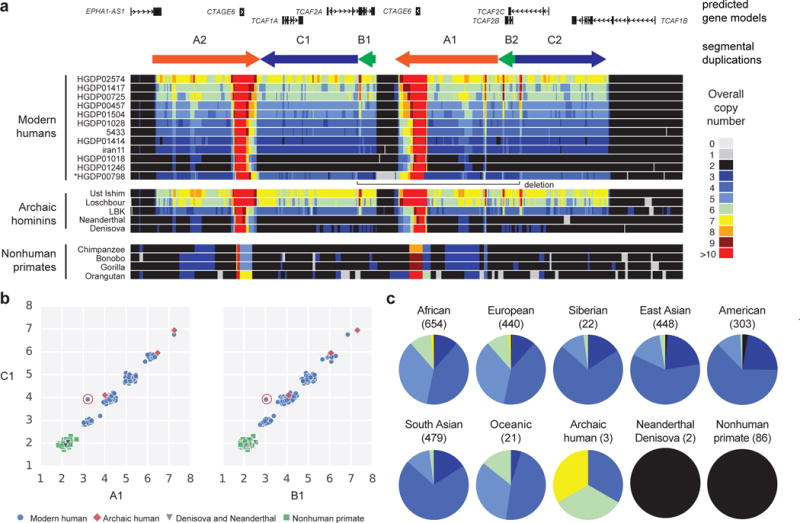
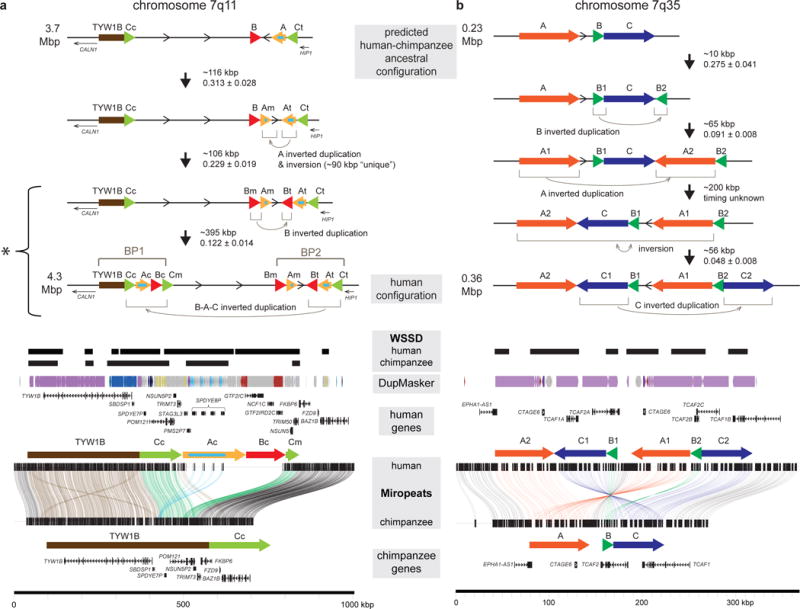
Segmental duplications contribute to human evolution, adaptation and genomic instability but are often poorly characterized. We investigate the evolution, genetic variation and coding potential of human-specific segmental duplications (HSDs). We identify 218 HSDs based on analysis of 322 deeply sequenced archaic and contemporary hominid genomes. We sequence 550 human and nonhuman primate genomic clones to reconstruct the evolution of the largest, most complex regions with protein-coding potential (n=80 genes/33 gene families). We show that HSDs are non-randomly organized, associate preferentially with ancestral ape duplications termed "core duplicons", and evolved primarily in an interspersed inverted orientation. In addition to Homo sapiens-specific gene expansions (e.g., TCAF1/2), we highlight ten gene families (e.g., ARHGAP11B and SRGAP2C) where copy number never returns to the ancestral state, there is evidence of mRNA splicing, and no common gene-disruptive mutations are observed in the general population. Such duplicates are candidates for the evolution of human-specific adaptive traits.


Conflict of interest statement

COMPETING FINANCIAL INTERESTS E.E.E. is on the scientific advisory board (SAB) of DNAnexus, Inc., is a consultant for Kunming University of Science and Technology (KUST) as part of the 1000 China Talent Program, and was an SAB member of Pacific Biosciences, Inc. (2009–2013).

Figures

Figure 1
Figure 1. Identification of human-specific segmental duplications or HSDs
(a) The locations of large, gene-containing HSDs are highlighted (blue lines) with 80 individual gene paralogs from 33 gene families listed across 9 different human autosomes. Included in this set are paralogs of GPR89, which duplicated in other great apes but experienced human-specific expansions. Many of these HSDs overlap known disease-implicated genomic hotspots (red lines) prone to recurrent copy number variation associated with developmental delay. The genomic hotspots labeled with numbers (1 to 6) have significant associations with specific disorders including epilepsy, autism, schizophrenia and intellectual disability (ID). (b) Duplicated regions were detected based on read-depth analysis of Illumina reads mapped to the human reference genome (GRC37). The set included a diversity panel of humans (Human Genome Diversity Project or HGDP (N = 236)) and nonhuman primates or NHPs (gorillas (N = 32), chimpanzees (N = 23), bonobos (N = 14), and orangutans (N = 17)). Overall copy number (CN) was averaged across 500 bp sliding windows and depicted as colored heatmaps (see pictured index). Also pictured are heatmaps for Neanderthal, Denisovan, and archaic human (LBK, Loschbour, and Ust Ishim) individuals. Any genomic region >5 kbp shown to have diploid CN ≥ 3 in 90% of humans tested compared to all NHPs was considered an HSD.
Figure 2
Figure 2. Timing of HSDs
(a) Duplication timing estimates are plotted as a ratio of human–chimpanzee divergence (x-axis). The total estimated size of primary (black) and secondary (orange) duplications is shown for each event. Uncertainty in the size of each event is due to breakpoints mapping in high-identity flanking duplications (gray). (b) Generally accepted phylogeny indicating timing of each event assuming chimpanzee and human lineage divergence of 6 million years ago (mya). Recent estimates based on recalibrated substitution rates suggest an earlier divergence time of 12 mya, with this maximum scale indicated in parentheses. The analysis is based on high-quality sequencing, assembly and alignment of large-insert clones (human N = 224; NHP N = 269). Asterisks indicate adjusted timing estimates because of failed Tajima’s D relative rate (*) and genes with evidence of interlocus gene conversion (**).
Figure 3
Figure 3. Human copy number diversity
Overall average CN was calculated per individual from read depth produced from Illumina mappings across a set region defining each duplication (Supplementary Table 9) in human populations, including the HGDP (N = 236; GRCh38) and 1000 Genomes Project (1KG, N = 2,143; GRCh37) cohorts, NHPs, archaic humans, a Denisovan and a Neanderthal. From these results, the mean, standard deviation (s.d.), Vst, and number of individuals with CN = 2 indicating no duplicate paralogs exist were calculated for average CN of each duplicated gene family (Supplementary Table 11). For each gene family, plots are shown for the CN average vs. s.d. across all HGDP individuals with duplicate gene family names indicated next to each data point. Red data points indicate genes with no homozygous deletions in any human tested. Genes with higher s.d. are considered CN polymorphic and tend to have higher CN (R2 = 0.09; ρ = 0.30, Pearson correlation) and average Vst (R2 = 0.32; ρ = 0.54, Pearson correlation; Supplementary Figure 11).
Figure 4
Figure 4. Copy number polymorphism across diverse populations of TCAF1 and TCAF2 HSDs
(a) Heatmap of overall CN of TCAF1 and TCAF2 HSD region on human chromosome 7 with predicted gene models and segmental duplications (SDs; depicted as colored arrows) pictured above. Representative modern humans are shown for each genotyped CN across the locus with a single person (*HGDP00798) showing deletion of the region, likely due to non-allelic homologous recombination between directly oriented SDs B1 and B2 (Supplementary Note). (b) A scatter plot of TCAF1 and TCAF2 SDs (A1, B1, and C1), overall CN of individuals from modern human (HGDP cohort), archaic humans, a Denisova and a Neanderthal, and NHPs (chimpanzee, bonobo, gorilla, and orangutan) plotted on each axis. The one Western European individual circled in red that deviates from the rest of the individuals’ copy numbers is the deletion carrier pictured in a. (c) CN predictions across modern humans from the 1KG and HGDP (N = 2,379), archaic hominins, and NHPs were made across a representative region (chr7:143,533,137-143,571,789; GRCh37). Overall CNs in the pie charts per population are represented as colors depicted in the legend shown panel a.
Figure 5
Figure 5. Complex models of HSD evolutionary history
BACs tiling across human chromosome (a) 7q11 and (b) 7q35 regions were sequenced and assembled (representing human and additional great apes) and supercontigs were created. Estimates of sizes and evolutionary timing (human–chimpanzee distance; Supplementary Table 8) of events are denoted between each predicted intermediate genomic structure. SD organization is depicted as colored arrows across the 7q11 (SDs annotated with subscripts representing relative positions including centromeric (c), middle (m), and telomeric (t) as previously defined) and 7q35 regions. The orientations of intervening regions are shown with arrows. Models of the predicted evolutionary histories of the HSDs at all loci are depicted starting with the predicted human–chimpanzee common ancestor to the most common haplotype present in modern humans. A Miropeats comparison of the human and chimpanzee contigs shows the pairwise differences between the orthologous regions. Lines connect stretches of homologous regions based on a chosen threshold (s), defined as the number of matching bases minus the number of mismatching bases (s = 500 for a, s = 1000 for b) and match the arrow colors when they connect SD blocks. Additional annotations include whole-genome shotgun sequence detection (WSSD) in human and chimpanzee, indicating duplicated regions identified by sequence read depth, DupMasker, and genes.

References

    1. O’Bleness M, Searles VB, Varki A, Gagneux P, Sikela JM. Evolution of genetic and genomic features unique to the human lineage. Nat Rev Genet. 2012;13:853–866. doi: 10.1038/nrg3336. - DOI - PMC - PubMed
    1. Gallego Romero I, et al. A panel of induced pluripotent stem cells from chimpanzees: a resource for comparative functional genomics. Elife. 2015;4:e07103. doi: 10.7554/eLife.07103. - DOI - PMC - PubMed
    1. Khan Z, et al. Primate transcript and protein expression levels evolve under compensatory selection pressures. Science. 2013;342:1100–1104. doi: 10.1126/science.1242379. - DOI - PMC - PubMed
    1. McLean CY, et al. Human-specific loss of regulatory DNA and the evolution of human-specific traits. Nature. 2011;471:216–219. doi: 10.1038/nature09774. - DOI - PMC - PubMed
    1. Prescott SL, et al. Enhancer divergence and cis-regulatory evolution in the human and chimp neural crest. Cell. 2015;163:68–83. doi: 10.1016/j.cell.2015.08.036. - DOI - PMC - PubMed