. 2016 Sep;1(3):eaai7732.
doi: 10.1126/sciimmunol.aai7732. Epub 2016 Sep 22.

Exploiting a host-commensal interaction to promote intestinal barrier function and enteric pathogen tolerance

Affiliations

Exploiting a host-commensal interaction to promote intestinal barrier function and enteric pathogen tolerance

Virginia A Pedicord et al. Sci Immunol. 2016 Sep.

Abstract

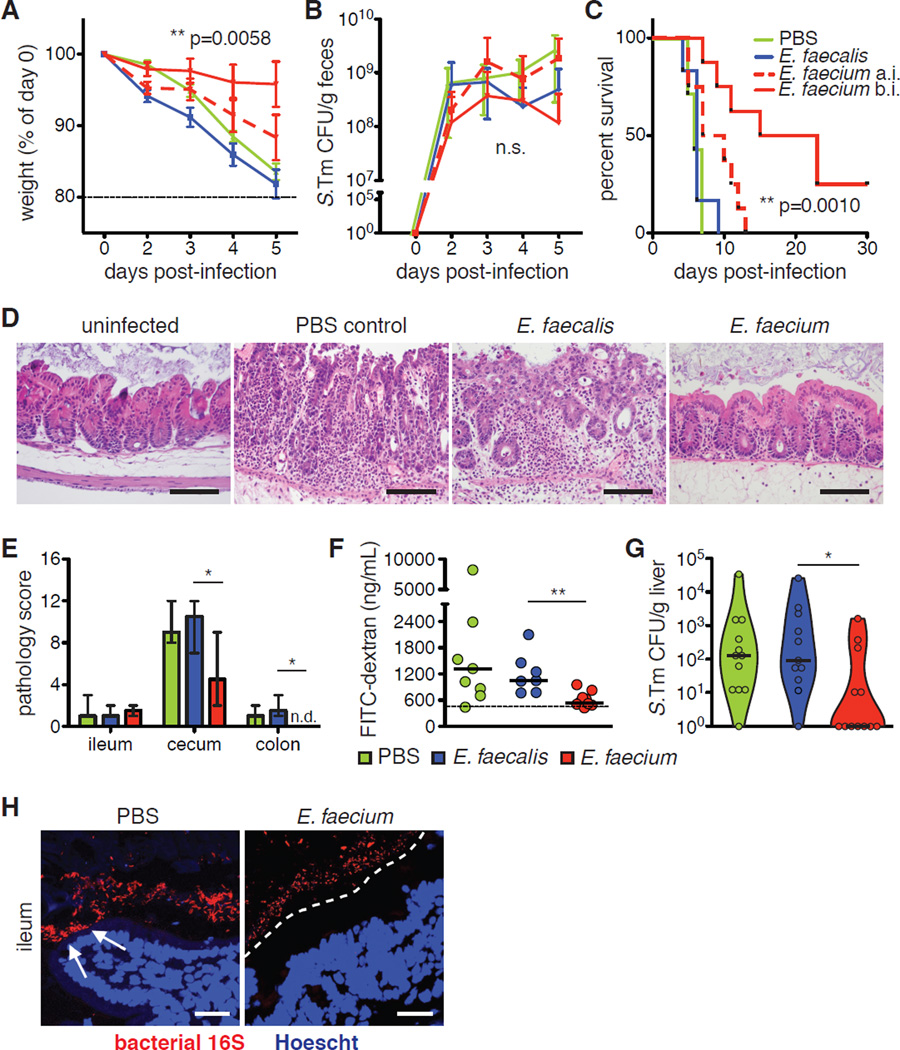
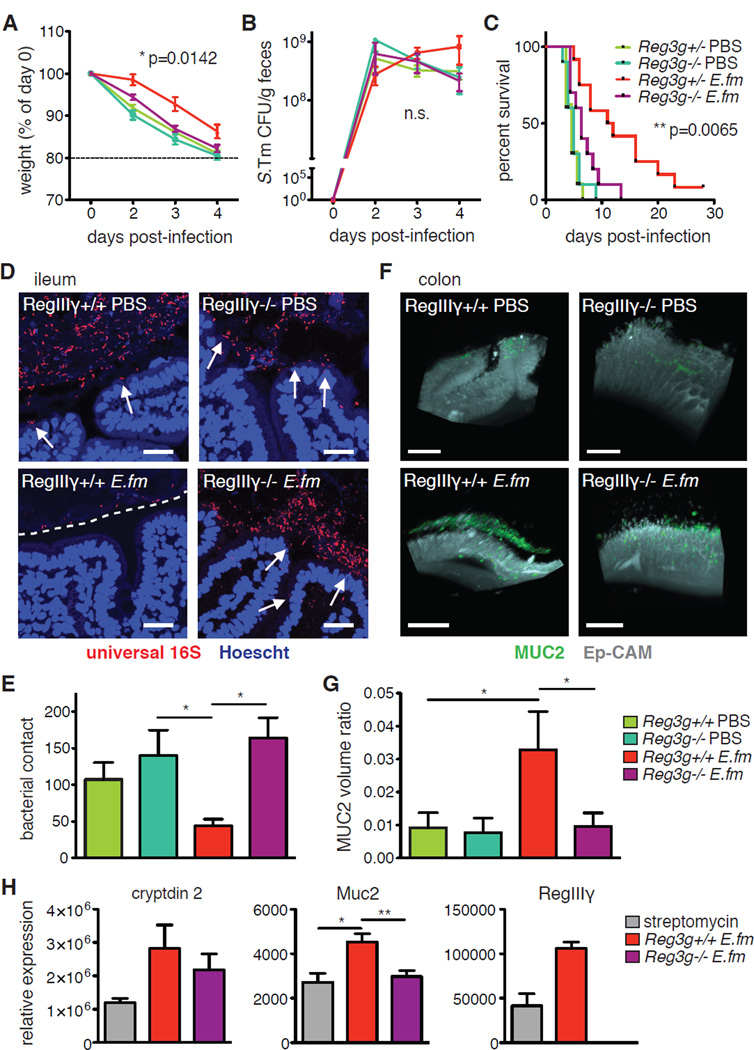
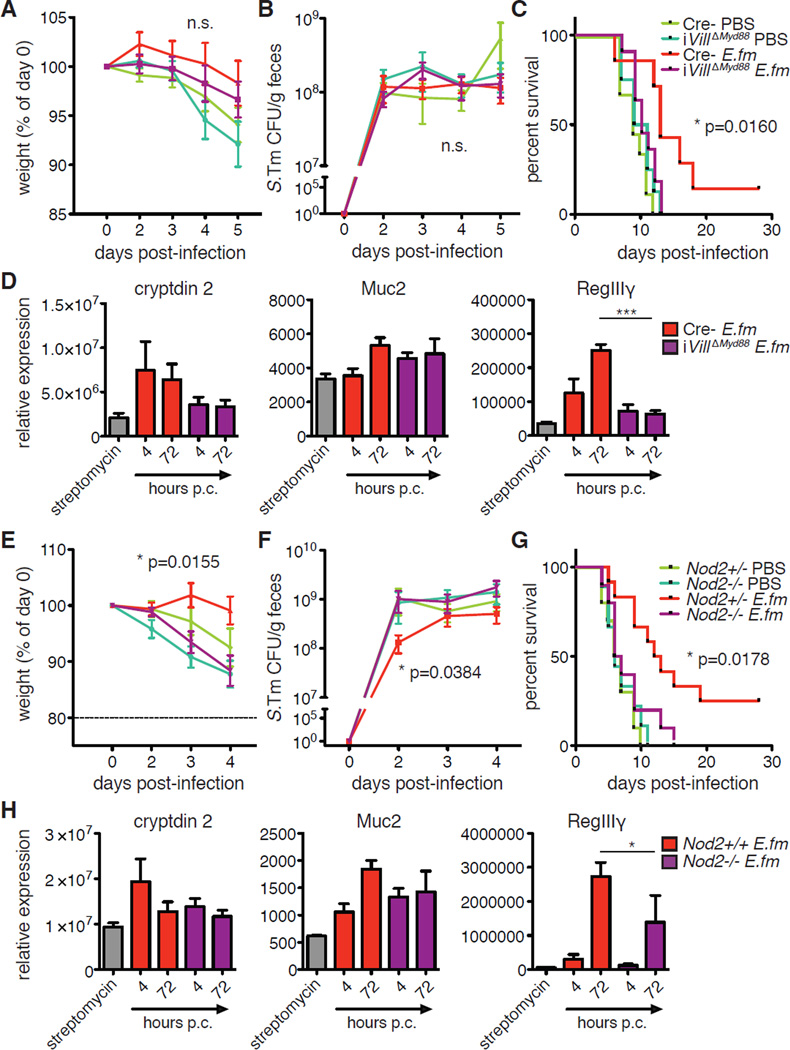
Commensal intestinal bacteria can prevent pathogenic infection; however, limited knowledge of the mechanisms by which individual bacterial species contribute to pathogen resistance has restricted their potential for therapeutic application. Here, we examined how colonization of mice with a human commensal Enterococcus faecium protects against enteric infections. We show that E. faecium improves host intestinal epithelial defense programs to limit Salmonella enterica serotype Typhimurium pathogenesis in vivo in multiple models of susceptibility. E. faecium protection is mediated by a unique peptidoglycan hydrolase, SagA, and requires epithelial expression of pattern recognition receptor components and antimicrobial peptides. Ectopic expression of SagA in non-protective and probiotic bacteria is sufficient to enhance intestinal barrier function and confer resistance against S. Typhimurium and Clostridium difficile pathogenesis. These studies demonstrate that specific factors from commensal bacteria can be used to improve host barrier function and limit the pathogenesis of distinct enteric infections.


Figures

Fig. 1
Fig. 1. E. faecium-mediated Salmonella resistance does not require an adaptive immune response
(A–C) Germ-free (GF) C57BL/6 mice were orally gavaged with 108 CFU E. faecalis or E. faecium 7d before oral infection with 102 CFU S. Tm. (A) Weight loss, (B) S. Tm bacterial burden in feces, and (C) survival are shown. Pooled data from 4 independent experiments, n=12 mice/group. (D–F) C57BL/6 mice were orally gavaged with a broad-spectrum antibiotic cocktail of ampicillin, metronidazole, neomycin, and vancomycin (AMNV) daily for 7d prior to gavage with 108 CFU E. faecalis or E. faecium or PBS, followed by infection with 106 S. Tm. (D) Weight loss, (E) S. Tm bacterial burden in feces, and (F) survival are shown. Pooled data from 4 independent experiments, n=14 mice/group. (G) Mice were gavaged with AMNV daily for 7d prior to gavage with 108 CFU E. faecium (E. fm). 5d post-colonization, intraepithelial lymphocytes were isolated and analyzed by flow cytometry for relative frequency and cytokine expression of shown subpopulations. Pooled data from 2 independent experiments, n=5 mice/group. (H) Rag1−/− mice were gavaged with AMNV antibiotic cocktail daily for 7d prior to gavage with PBS or 108 CFU E. faecalis or E. faecium, followed by infection with 106 S. Tm. Pooled data from 4 independent experiments, n=13–14 mice/group. (A, B, D and E) mean±SEM, 2-way ANOVA, p-value shown comparing E. faecalis to E. faecium. n.s.=not significant. (C, F and H) Log-rank analysis, p-value shown comparing E. faecalis to E. faecium. (G) mean±SEM, Mann-Whitney. *p≤0.05, **p≤0.01, ***p≤0.001 for all analyses. Comparisons with no (*) or bar had p>0.05 and were not considered significant.
Fig. 2
Fig. 2. E. faecium improves epithelial barrier function and bacterial segregation
(A–C) C57BL/6 mice were orally gavaged with streptomycin and given 108 colony-forming units (CFU) E. faecalis or E. faecium 4h before (b.i.) or 24h after (a.i.) oral infection with 106 CFU S. Typhimurium. (A) Weight loss, (B) S. Typhimurium (S. Tm) bacterial burden in feces, and (C) survival are shown. Pooled data from 3 independent experiments, n=6–8 mice/group. (D) Cecum tissue stained with H&E, harvested at 48h post-infection (p.i.) from mice given streptomycin and left uninfected or treated before infection as in (A–C). Representative images, 40X objective, from 1 of 3 independent experiments, n=2–3 mice/group. Scale bar = 100 µm. (E) Ileum, cecum, and colon tissues were harvested and prepared as in (D) and scored for 4 pathology parameters. Pooled combined pathology scores from 3 independent experiments, n=6–7 mice/group. (F) Intestinal permeability measured by FITC-dextran in the serum 48h p.i. from mice treated before infection as in (A–C). Dashed line = background level (uninfected). Pooled data from 3 independent experiments, n=7–9 mice/group. (G) S. Tm bacterial burden 48h p.i. in the livers of mice treated before infection as in (A–C). Pooled data from 4 independent experiments, n=11–12 mice/group. (H) FISH staining for all bacteria (universal 16S probe) and epithelial nuclei (Hoechst) from intestinal tissues 48h p.i. Representative images, 40X objective, from 1 of 3 independent experiments, n=4–6 mice/group. White arrows indicate bacteria in contact with or invading through the epithelium, and white dashed line designates zone of segregation from bacteria. (A and B) mean±SEM, 2-way ANOVA, p-value shown comparing E. faecalis to E. faecium b.i., n.s.=not significant. (C) Log-rank analysis, p-value shown comparing E. faecalis to E. faecium b.i. (E) median±range, Mann-Whitney comparing E. faecalis to E. faecium (Wilcoxon for colon, n.d.=none detected, score of zero). (F and G) bar=median, Mann-Whitney comparing E. faecalis to E. faecium. *p≤0.05, **p≤0.01 for all analyses. Comparisons with no (*) or bar had p>0.05 and were not considered significant.
Fig. 3
Fig. 3. E. faecium colonization increases anti-microbial peptide and mucin expression
(A) C57BL/6 mice were orally gavaged with AMNV daily for 7d prior to gavage with 108 CFU E. faecalis or E. faecium. 4d post-colonization, intestinal epithelial cells (IECs) were isolated and analyzed by RQ-PCR for expression of shown genes vs unmanipulated specific pathogen-free (SPF) mice. Representative data from 1 of 3 independent experiments, n=2–3 mice/group. (B) Mice were given a single gavage of streptomycin followed by gavage with 108 CFU E. faecium 24h later. At indicated time-points post-colonization, IECs were isolated and analyzed by RQ-PCR. Representative data from 1 of 2 independent experiments, n=2 mice/group. (C) Captured images of tissue-cleared, MUC2- and Ep-CAM-stained colon from mice treated as in (J). Corresponding videos are Movies S1 and S2. Scale bar = 200 µm. (A and B) mean±SEM, 1-way ANOVA with Dunnett’s post-test comparing each to antibiotic-only controls. *p≤0.05, **p≤0.01, ***p≤0.001 for all analyses. Comparisons with no (*) or bar had p>0.05 and were not considered significant.
Fig. 4
Fig. 4. E. faecium-induced expression of Reg3g is required for protection against S. Typhimurium
(A–C) Reg3g−/− mice or +/− littermate controls were given AMNV for 7d and colonized with 108 E. faecium (E. fm) prior to oral infection with 106 S. Tm. (A) Weight loss, (B) S. Tm bacterial burden in feces, and (C) survival are shown. Pooled data from 4 independent experiments, n=10–12 mice/group. (D–G) Reg3g−/− mice or +/+ controls were given streptomycin 24h before gavage with 108 E. fm prior to oral infection with 106 S. Tm. (D) FISH staining for all bacteria (universal 16S probe) and epithelial nuclei (Hoechst) from intestinal tissues 48h p.i. Representative images, 40X objective, from 1 of 3 independent experiments, n=4–6 mice/group. White arrows indicate bacteria in contact with or invading through the epithelium, and white dashed line designates zone of segregation from bacteria. (E) Quantitation of bacterial contact from 4 images per mouse from (F). (F) Captured images of tissue-cleared, MUC2- and Ep-CAM-stained colon from mice treated as in (F). Corresponding videos are Movies S3–6. Scale bar = 200 µm. (G) Quantitation of MUC2 volume as a ratio to volume of Ep-CAM from 4 sections per mouse from (H). (H) Reg3g−/− mice or +/+ controls were gavaged with streptomycin 24h before gavage with 108 E. fm. IECs were harvested 4h later and analyzed by RQ-PCR for expression of shown genes. Pooled data from 2 independent experiments, n=3–6 mice/group. (A and B) mean±SEM, 2-way ANOVA, p-value shown comparing Reg3g−/− E. fm to Reg3g+/− E. fm, n.s.=not significant. (C) Log-rank analysis, p-value shown comparing Reg3g−/− E. fm to Reg3g+/− E. fm. (E and G) Kruskal-Wallis with Dunn’s post-test comparing all groups to Reg3g+/+ E. fm. (H) 1-way ANOVA with a Bonferroni post-test comparing all groups to each other. RegIIIγ expression shown as a control, all groups significant compared to knock-out but not depicted on the graph. *p≤0.05, **p≤0.01, ***p≤0.001 for all analyses. Comparisons with no (*) or bar had p>0.05 and were not considered significant.
Fig. 5
Fig. 5. MyD88 and NOD2 are required for AMP induction and E. faecium-mediated protection
(A–C) iVillΔMyd88 or Cre (MyD88f/f) littermate control mice were injected with tamoxifen 7 days prior to oral gavage with streptomycin. After 24h, mice were gavaged with 108 CFU E. fm followed 4h later by oral infection with 106 CFU S. Tm. (A) Weight loss, (B) S. Tm bacterial burden in feces, and (C) survival are shown. Pooled data from 3 independent experiments, n=7–11 mice/group. (D) Mice were treated and colonized as in (A–C). At 4 and 72h post-colonization (p.c.), IECs were isolated and analyzed by RQ-PCR for expression of shown genes. Pooled data from 2 independent experiments, n=2–4 mice/group. (E–G) Nod2−/− mice or +/− littermate controls were gavaged with streptomycin 24h prior to gavage with 108 CFU E. fm followed 4h later by oral infection with 106 CFU S. Tm. (E) Weight loss, (F) S. Tm bacterial burden in feces, and (G) survival are shown. Pooled data from 4 independent experiments, n=9–12 mice/group. (H) Mice were treated and colonized as in (E–G). At 4 and 72h post-colonization (p.c.), IECs were isolated and analyzed by RQ-PCR for expression of shown genes. Pooled data from 2 independent experiments, n=2–4 mice/group. (A, B, E, and F) mean±SEM, 2-way ANOVA, p-value shown comparing E. fm-colonized deficient to sufficient controls, n.s.=not significant. (C and G) Log-rank analysis, p-value shown comparing E. fm-colonized deficient to sufficient controls. (D and H) mean±SEM, 1-way ANOVA with Dunnett’s post-test comparing deficient to sufficient controls at the same time-point. *p≤0.05 and ***p≤0.001 for all analyses. Comparisons with no (*) or bar had p>0.05 and were not considered significant.
Fig. 6
Fig. 6. The E. faecium protein SagA is sufficient to improve host intestinal barrier function and resistance to C. difficile
Mice were given a single gavage of streptomycin followed 24h later by gavage with 108 CFU E. fm, E. fs, or E. fs-sagA. (A) At 72h postcolonization, IECs were isolated and analyzed by RQ-PCR. Pooled data from 2 independent experiments, n=2–4 mice/group. (B–E) Intestinal tissues 48h p.i. from mice colonized 4h prior to infection with 106 S. Tm. (B) Cecum tissue stained with H&E. Representative images, 40X objective, from 1 of 2 independent experiments, n=7 mice/group. (C) Ileum, cecum, and colon tissues were prepared as in (B) and scored for 4 pathology parameters. Pooled combined pathology scores from 2 independent experiments, n=7 mice/group. (D) FISH staining for all bacteria (universal 16S probe) and epithelial nuclei (Hoechst) from Representative images, 40X objective, from 1 of 2 independent experiments, n=7 mice/group. White arrows indicate bacteria in contact with or invading through the epithelium, and white dashed line designates zone of segregation from bacteria. (E) S. Tm bacterial burden in the livers of mice 48h p.i. Pooled data from 3 independent experiments, n=9–11 mice/group. (F–H) Mice were given AMNV for 7d and colonized with 108 CFU of indicated bacteria 2d prior to oral infection with 106 C. difficile. (F) Weight loss, (G) C. difficile bacterial burden in feces at day 1 p.i., and (H) survival are shown. Pooled data from 3 independent experiments, n=6–9 mice/group. (A) mean±SEM, 1-way ANOVA with Dunnett’s post-test comparing all to streptomycin-only controls. (C and E) Mann-Whitney. (F) mean±SEM, 2-way ANOVA, p-value shown comparing E. fm or sagA-expressing E. fs or L. pl to WT or vector controls, respectively. (G) 1-way ANOVA comparing all groups. n.s.=not significant. (H) Log-rank analysis, p-value shown comparing E. fm or sagA-expressing E. fs or L. pl to WT or vector controls, respectively. *p≤0.05, **p≤0.01, ***p≤0.001 for all analyses. Comparisons with no (*) or bar had p>0.05 and were not considered significant.

Similar articles

Cited by

References

    1. Sender R, Fuchs S, Milo R. Revised estimates for the number of human and bacteria cells in the body. bioRxiv. 2016 - PMC - PubMed
    1. Gregor MF, Hotamisligil GS. Inflammatory mechanisms in obesity. Annu Rev Immunol. 2011;29:415. - PubMed
    1. Winer DA, Luck H, Tsai S, Winer S. The Intestinal Immune System in Obesity and Insulin Resistance. Cell metabolism. 2016 Mar 8;23:413. - PubMed
    1. Clemente JC, Ursell LK, Parfrey LW, Knight R. The impact of the gut microbiota on human health: an integrative view. Cell. 2012 Mar 16;148:1258. - PMC - PubMed
    1. Hsiao EY, et al. Microbiota modulate behavioral and physiological abnormalities associated with neurodevelopmental disorders. Cell. 2013 Dec 19;155:1451. - PMC - PubMed