. 2017 Nov;23(21-22):1283-1294.
doi: 10.1089/ten.TEA.2017.0102. Epub 2017 Jun 30.

Matrix-Bound Nanovesicles Recapitulate Extracellular Matrix Effects on Macrophage Phenotype

Affiliations

Matrix-Bound Nanovesicles Recapitulate Extracellular Matrix Effects on Macrophage Phenotype

Luai Huleihel et al. Tissue Eng Part A. 2017 Nov.

Abstract

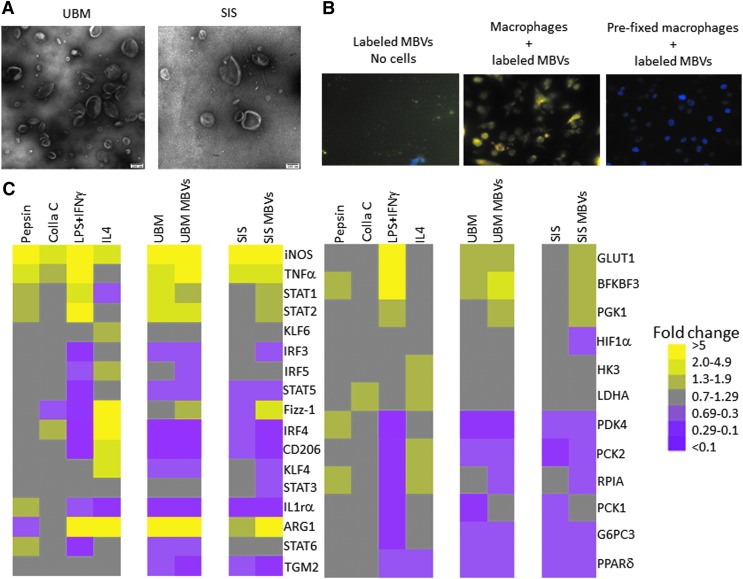
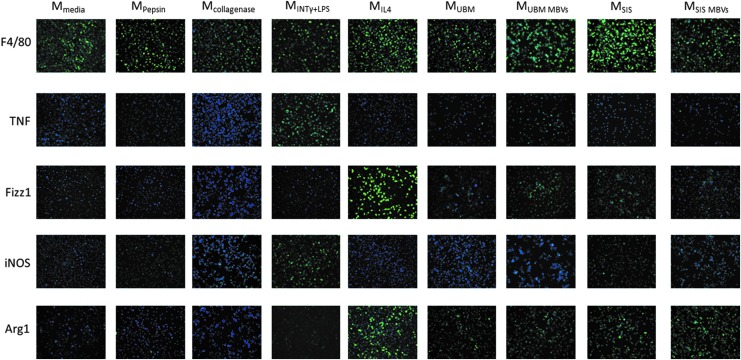
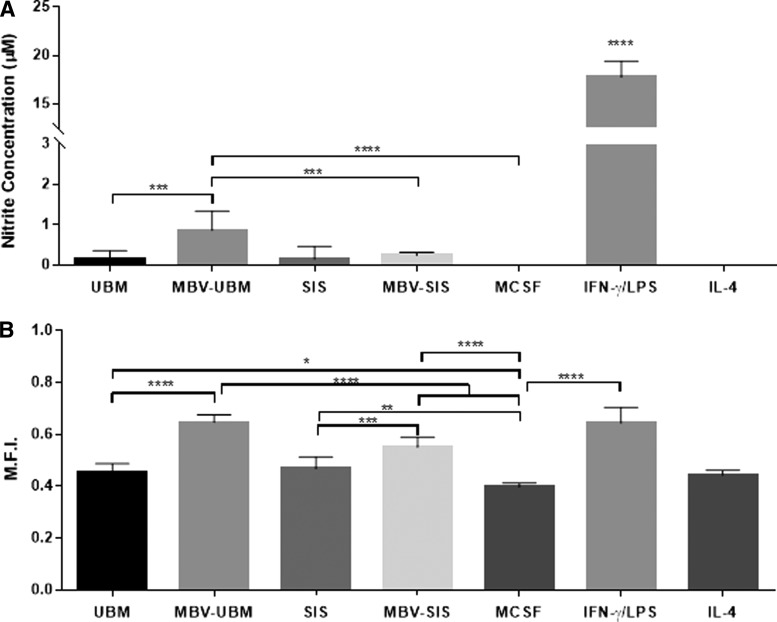
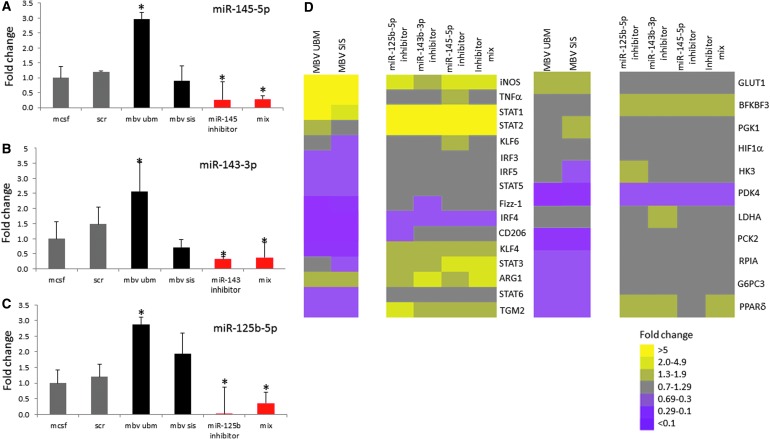
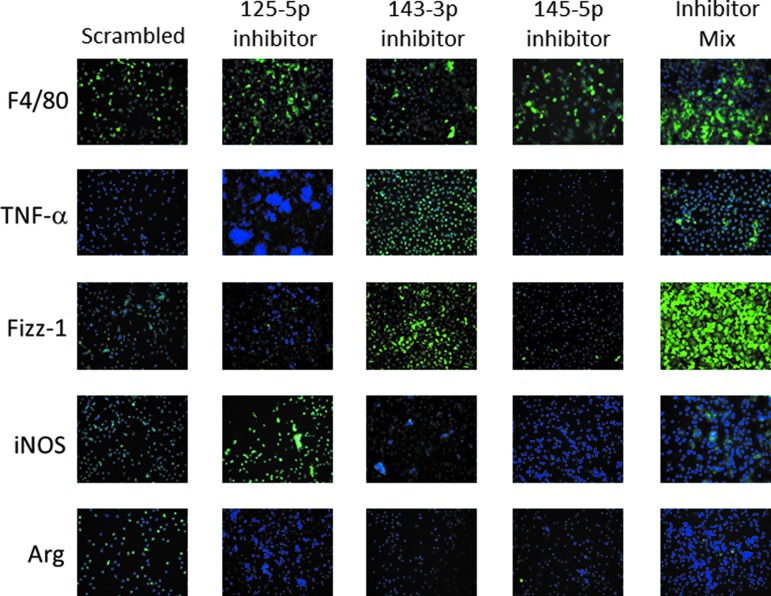
The early macrophage response to biomaterials has been shown to be a critical and predictive determinant of downstream outcomes. When properly prepared, bioscaffolds composed of mammalian extracellular matrix (ECM) have been shown to promote a transition in macrophage behavior from a proinflammatory to a regulatory/anti-inflammatory phenotype, which in turn has been associated with constructive and functional tissue repair. The mechanism by which ECM bioscaffolds promote this phenotypic transition, however, is poorly understood. The present study shows that matrix-bound nanovesicles (MBV), a component of ECM bioscaffolds, are capable of recapitulating the macrophage activation effects of the ECM bioscaffold from which they are derived. MBV isolated from two different source tissues, porcine urinary bladder and small intestinal submucosa, were found to be enriched in miRNA125b-5p, 143-3p, and 145-5p. Inhibition of these miRNAs within macrophages was associated with a gene and protein expression profile more consistent with a proinflammatory rather than an anti-inflammatory/regulatory phenotype. MBV and their associated miRNA cargo appear to play a significant role in mediating the effects of ECM bioscaffolds on macrophage phenotype.

Keywords: extracellular matrix; macrophage; matrix-bound nanovesicles; phenotype.


Conflict of interest statement

No competing financial interests exist.

Figures

<b>FIG. 1.</b>
FIG. 1.
MBV imaging and gene expression signature of MBV-treated macrophages. (A) MBV isolated using proteinase-K digestion were visualized by transmission electron microscopy at 100,000 × magnification. (B) Following exposure of BMDMs (counterstained with DAPI) to MBVs whose nucleic acid content was labeled with acridine orange, the cells were visualized using fluorescence microscopy at 200 × magnification. MBV are seen within the cytosol of cells after a 2-h incubation. (C) Gene expression analysis of cells exposed to either ECM or their respective MBVs was evaluated using qPCR. Results are presented in a heatmap form that was generated using Treeview software; all fold changes are with respect to media control (N = 3). Scale bar scoring system is demonstrated as follows: less than 0.1-fold change (darkest purple), 0.1–0.29-fold change (intermediate purple), 0.3–0.69-fold change (light purple), 0.7–1.29-fold change (gray), 1.3–1.9-fold change (light yellow), 2.0–4.9-fold change (intermediate yellow), greater than 5.0-fold change (bright yellow). Supplementary Table S1 indicates significant differences between media control and treated macrophages as determined using t-tests with p < 0.05 considered significant. BMDM, bone marrow-derived macrophages; ECM, extracellular matrix; DAPI, 4’6-diamidino-2-phenylindole; MBV, matrix-bound nanovesicles.
<b>FIG. 2.</b>
FIG. 2.
MBV treatment increases M2-like protein expression. BMDM were exposed for 24 h to media control, 1 mg/mL pepsin or 0.1 mg/mL collagenase controls, 250 μg/mL ECM, 25 μg/mL MBVs, or the cytokine controls IFNγ+LPS or interleukin (IL)-4. Cells were then fixed with 4% PFA .The cells were then incubated with anti-murine antibody for markers of the M1-like phenotype TNFα and iNOS, or markers of the M2-like phenotype Fizz1 and Arginase1. All images for the same antibody were taken at the same exposure time normalized to the positive control. Cell nuclei were stained with DAPI. Images were taken at 200 × magnification (N = 3). The percentage of cells positive for each stain was quantified using Cell Profiler software and is presented in Supplementary Figure S1A. PFA, paraformaldehyde.
<b>FIG. 3.</b>
FIG. 3.
MBV treatment affects BMDM function more than ECM treatment. Macrophages were exposed for 24 h to MCSF control, 250 μg/mL ECM, 25 μg/mL MBVs, or the cytokine controls IFNγ+LPS or IL-4. (A) Macrophage supernatants were mixed with 1% sulfanilamide in 5% phosphoric acid for 10 min, followed by addition of 0.1% N-1-napthylethylenediamine dihydrochloride in water. The solutions were read in a spectrophotometer at 540 nm and compared to the standard curve of sodium nitrite to assess nitric oxide production levels. Values: mean ± standard deviation, N = 6, *p < 0.05, **p < 0.01, ***p < 0.001, ****p < 0.0001 by one-way analysis of variance (ANOVA) with Tukey's post-hoc test. (B) Treated macrophages were incubated with Vybrant Phagocytosis Kit FITC-labeled Escherichia coli beads for 2 h. Cells were fixed and stained with DAPI. Using fluorescence microscopy, the cells were visualized and quantified for mean fluorescence intensity of the cells using Cell Profiler software. Values: mean ± standard deviation, N = 6, *p < 0.05, **p < 0.01, ***p < 0.001, ****p < 0.0001 by one-way ANOVA with Tukey's post-hoc test. MCSF, macrophage colony-stimulating factor.
<b>FIG. 4.</b>
FIG. 4.
miRNA inhibition reverses gene expression patterns compared to MBV-exposed BMDM. Macrophage miRNA inhibition. (A–C) Selective inhibition of specific miRNAs, miR-145-5p, miR-145-3p, and miR-125-b-5p using 50 nM of inhibitor for each. Relative abundance of miRNA levels following inhibition was determined by TaqMan miRNA qPCR assays. Values: mean ± standard deviation, N = 3, *p < 0.05 by Student's t-test. Data represents fold change in comparison to M0. (D) Gene expression analysis of cells exposed to MBVs, or transfected with scrambled control miRNA inhibitor, mmu-miR-154-5p inhibitor, mmu-miR-143-3p inhibitor, mmu-miR-125b-5p inhibitor, or a combination of all three inhibitors was evaluated using qPCR. Results are presented in a heatmap form that was generated using Treeview software; all fold changes are with respect to media control. Scale bar scoring system is demonstrated as follows: less than 0.1-fold change (darkest purple), 0.1–0.29-fold change (intermediate purple), 0.3–0.69-fold change (light purple), 0.7–1.29-fold change (gray), 1.3–1.9-fold change (light yellow), 2.0–4.9-fold change (intermediate yellow), and greater than 5.0-fold change (bright yellow). Supplementary Table S3 indicates significant differences between media control and treated macrophages as determined using t-tests with p < 0.05 considered significant.
<b>FIG. 5.</b>
FIG. 5.
miRNA inhibition shows opposite protein expression compared to MBV. BMDM were exposed for 4 h to 50 nM of one of the following: scrambled control, mmu-miR-125b-5p inhibitor, mmu-miR-143-3p inhibitor, or miR-145-5p. Treatment media were then changed to normal growth media for an additional 18 h. Cells were then fixed with 4% PFA. Cells were then incubated with anti-murine antibody for markers of the M1-like phenotype TNFα and iNOS, or markers of the M2-like phenotype Fizz1 and Arginase1. Exposure times were established based on a negative isotype control and cytokine-treated controls and kept constant for each marker tested. Cell nuclei were stained with DAPI. Images were taken at 200 × magnification. The percentage of cells positive for each stain was quantified using Cell Profiler software and is presented in Supplementary Figure S1B. The results show that miRNA inhibition is capable of impacting the expression of several probed proteins, implicating the role of miR-125b-5p, miR-143-3p, and miR-145-5p in the formation of the MMBV phenotype.

References

    1. Keane T.J., Dziki J., Sobieski E., Smoulder A., Castleton A., Turner N., White L.J., and Badylak S.F. Restoring mucosal barrier function and modifying macrophage phenotype with an extracellular matrix hydrogel: potential therapy for ulcerative colitis. J Crohn's Colitis 11, 360–368, 2017 - PubMed
    1. Alicuben E.T., and DeMeester S.R. Onlay ventral hernia repairs using porcine non-cross-linked dermal biologic mesh. Hernia 18, 705, 2014 - PMC - PubMed
    1. Seif-Naraghi S.B., Singelyn J.M., Salvatore M.A., Osborn K.G., Wang J.J., Sampat U., Kwan O.L., Strachan G.M., Wong J., Schup-Magoffin P.J. Braden R.L., Bartels K., DeQuach J.A., Preul M., Kinsey A.M., DeMaria A.N., Dib N., and Christman K.L. Safety and efficacy of an injectable extracellular matrix hydrogel for treating myocardial infarction. Sci Transl Med 5, 173ra25, 2013 - PMC - PubMed
    1. Dziki J.L., Sicari B.M., Wolf M.T., Cramer M.C., and Badylak S.F. Immunomodulation and mobilization of progenitor cells by extracellular matrix bioscaffolds for volumetric muscle loss treatment. Tissue Eng Part A 22, 1129, 2016 - PubMed
    1. Agrawal V., Siu B.F., Chao H., Hirschi K.K., Raborn E., Johnson S.A., Tottey S., Hurley K.B., Medberry C.J., and Badylak S.F. Partial characterization of the Sox2+ cell population in an adult murine model of digit amputation. Tissue Eng Part A 18, 1454, 2012 - PMC - PubMed