. 2017 Jun 1;73(Pt 6):488-495.
doi: 10.1107/S2059798317007756. Epub 2017 May 31.

Electron Bio-Imaging Centre (eBIC): the UK national research facility for biological electron microscopy

Affiliations

Electron Bio-Imaging Centre (eBIC): the UK national research facility for biological electron microscopy

Daniel K Clare et al. Acta Crystallogr D Struct Biol. .

Abstract

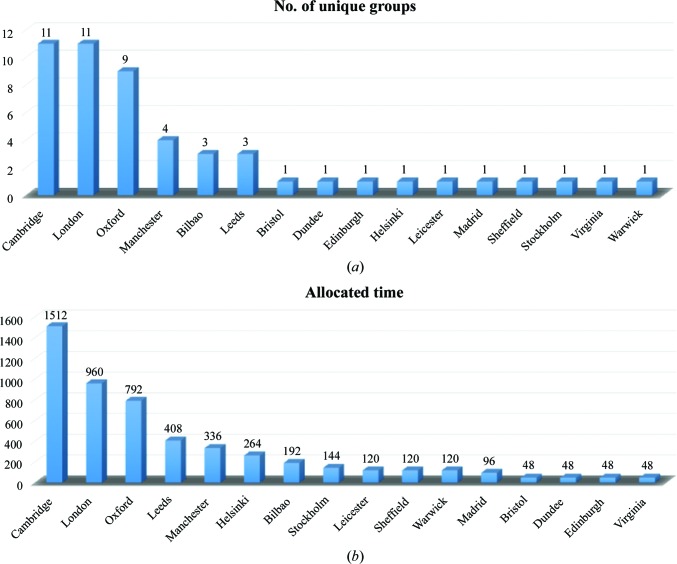
The recent resolution revolution in cryo-EM has led to a massive increase in demand for both time on high-end cryo-electron microscopes and access to cryo-electron microscopy expertise. In anticipation of this demand, eBIC was set up at Diamond Light Source in collaboration with Birkbeck College London and the University of Oxford, and funded by the Wellcome Trust, the UK Medical Research Council (MRC) and the Biotechnology and Biological Sciences Research Council (BBSRC) to provide access to high-end equipment through peer review. eBIC is currently in its start-up phase and began by offering time on a single FEI Titan Krios microscope equipped with the latest generation of direct electron detectors from two manufacturers. Here, the current status and modes of access for potential users of eBIC are outlined. In the first year of operation, 222 d of microscope time were delivered to external research groups, with 95 visits in total, of which 53 were from unique groups. The data collected have generated multiple high- to intermediate-resolution structures (2.8-8 Å), ten of which have been published. A second Krios microscope is now in operation, with two more due to come online in 2017. In the next phase of growth of eBIC, in addition to more microscope time, new data-collection strategies and sample-preparation techniques will be made available to external user groups. Finally, all raw data are archived, and a metadata catalogue and automated pipelines for data analysis are being developed.

Keywords: Electron Bio-Imaging Centre; cryo-EM; cryo-ET; eBIC; user facilities.


Figures

Figure 1
Figure 1
Krios 1 usage. (a) A graph showing the total number of unique research groups from different locations that have used Krios 1 during the first year of eBIC. (b) The total number of hours for each of these locations. London consists of multiple institutions, including Birbeck College, Imperial College, the Crick Instititute and the Institute of Cancer Research. Cambridge consists of the University of Cambridge and the MRC–LMB.
Figure 2
Figure 2
Non-phase-plate versus phase-plate data. A cryo-EM micrograph of FMDV taken at 1 µm defocus and its corresponding power spectrum (a, c) are compared with a micrograph and its corresponding power spectrum when aquired in focus and using the Volta phase plate (b, d). The images were taken with EPU at an equivalent total dose of around 30 e Å−2 at a pixel size of 1.06 Å per pixel using Krios 1 at eBIC. Images were collected on the Quantum K2 Summit detector in counting mode (∼6 electrons per pixel per second) with a 20 eV slit width. The FMDV virus particle can be clearly seen in the phase-plate image. The power spectra clearly show that the phase-plate image was in focus as there is no zero CTF present when compared with the 1 µm under-focus power spectrum. The samples were prepared by A. Kotecha, E. E. Fry, J. Seago and D. I. Stuart. The power spectra were calculated using Bsoft (Heymann et al., 2008 ▸). The scale bar in (b) is 30 nm and the dashed rings in (c) and (d) are at 3.7 Å resolution.
Figure 3
Figure 3
Phase-plate tomography of the perforin pre-pore complex. The 0° image from the tomogram (a), the central ten z sections averaged from the reconstructed tomogram (b) and an enlarged 20-z-section average from the reconstructed tomogram (c) of perforin pre-pores bound to liposomes collected with the phase plate. The tomogram was collected on Krios II at eBIC at 1.7 Å per pixel using the Quantum K2 detector in counting mode (∼5 electrons per pixel per second) with a 20 eV slit width and a nominal defocus of 300 nm to avoid going over focus. Tilt images were collected from −45 to 45° in 3° increments, giving a total dose of around 60 e Å−2. The tomogram was collected using the FEI TOMO package and was processed with MotionCorr and IMOD (Li et al., 2013; Kremer et al., 1996 ▸). The scale bars in (a) and (b) are 100 nm and the scale bar in (c) is 10 nm. The grids were prepared by N. Lukoyanova.
Figure 4
Figure 4
Focused ion beam cryo-milling of herpesvirus-infected cells. Cryo-EM/ET of lamellae produced by focused ion beam (FIB) milling with the eBIC FEI Scios dual-beam scanning electron microscope (SEM). (a) Screenshot of the FIB-SEM acquisition software shortly before milling a lamella into a plunge-frozen porcine kidney cell grown on electron-microscopy grids and infected for 10 h with herpesvirus PrVΔUS3 (muliplicity of infection 10). Several imaging modalities support efficient milling, e.g. SEM for targeting an appropriate cell specimen (I), FIB imaging for planning and controlling lamella geometry (II), an in-column detector to provide material-specific contrast to check for a protective platinum coat on the sample (III) and an infrared live camera to monitor the cryostage (IV). (b) FIB image of the completed lamella through the cell depicted in (a) as viewed from the milling angle (18°). (c) The same lamella as in (b) imaged via SEM from the built-in angle of 52° between the electron and ion beams. A low electron acceleration voltage allows the observation of cellular details. (d) Low-magnification cryo-EM projection image at 0° of the lamella depicted in (b) and (c). Before milling, the leading edge was protected from erosion by the gallium ion beam by a platinum layer (black asterisk; ice contamination is shown by white asterisks). Denser objects in the cell led to curtaining (cytoplasmic lipid body; arrowhead). (e) Cryo-ET slice of a tomogram taken in the area marked by a white square in (d), lamella thickness 130 nm. Visible within the nucleoplasm (nuc) are nucleocapids at different stages of maturation: spherical assemblies of scaffolding protein (1), procapsids (2), partly DNA-filled (3) and nuclear C-capsids (4), which subsequently bud into nucleoplasmic reticulum (NR) forming nuclear egress complex (arrow)-lined capsid-containing vesicles in the perinuclear space (5).

References

    1. Al-Amoudi, A., Chang, J.-J., Leforestier, A., McDowall, A., Salamin, L. M., Norlén, L. P. O., Richter, K., Blanc, N. S., Studer, D. & Dubochet, J. (2004). EMBO J. 23, 3583–3588. - PMC - PubMed
    1. Al-Amoudi, A., Studer, D. & Dubochet, J. (2005). J. Struct. Biol. 150, 109–121. - PubMed
    1. Boland, A., Martin, T. G., Zhang, Z., Yang, J., Bai, X.-C., Chang, L., Scheres, S. H. W. & Barford, D. (2017). Nature Struct. Mol. Biol. 24, 414–418. - PMC - PubMed
    1. Danev, R. & Baumeister, W. (2016). Elife, 5, e13046. - PMC - PubMed
    1. Danev, R., Buijsse, B., Khoshouei, M., Plitzko, J. M. & Baumeister, W. (2014). Proc. Natl Acad. Sci. USA, 111, 15635–15640. - PMC - PubMed