Review
. 2017 Jun 1;73(Pt 6):509-521.
doi: 10.1107/S2059798317007446. Epub 2017 May 31.

The ribosome and its role in protein folding: looking through a magnifying glass

Affiliations
Review

The ribosome and its role in protein folding: looking through a magnifying glass

Abid Javed et al. Acta Crystallogr D Struct Biol. .

Abstract

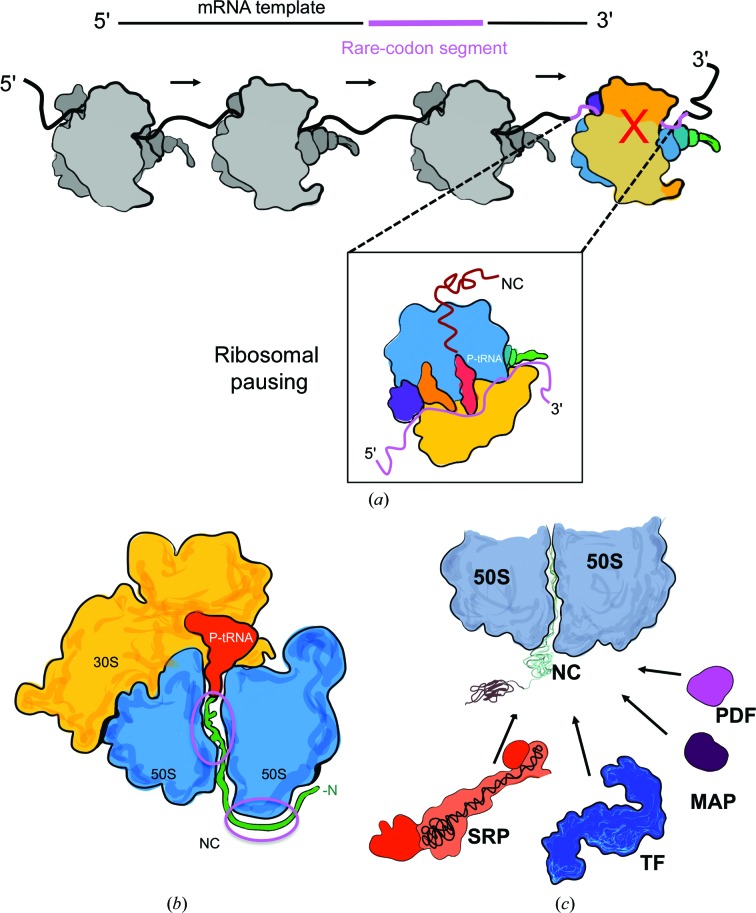
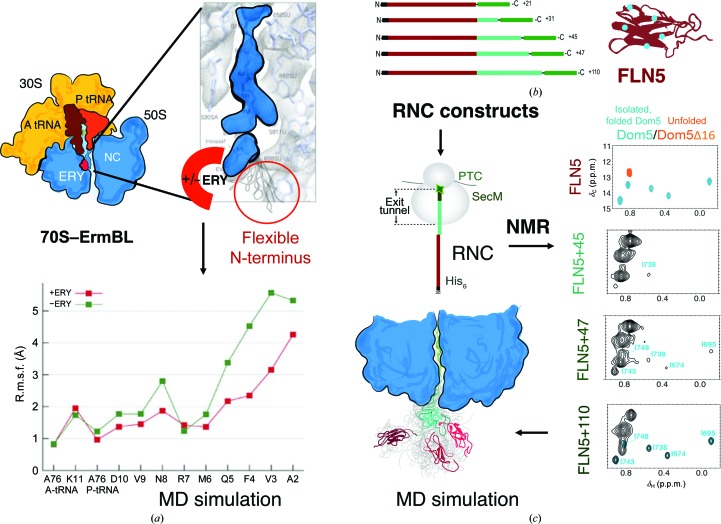
Protein folding, a process that underpins cellular activity, begins co-translationally on the ribosome. During translation, a newly synthesized polypeptide chain enters the ribosomal exit tunnel and actively interacts with the ribosome elements - the r-proteins and rRNA that line the tunnel - prior to emerging into the cellular milieu. While understanding of the structure and function of the ribosome has advanced significantly, little is known about the process of folding of the emerging nascent chain (NC). Advances in cryo-electron microscopy are enabling visualization of NCs within the exit tunnel, allowing early glimpses of the interplay between the NC and the ribosome. Once it has emerged from the exit tunnel into the cytosol, the NC (still attached to its parent ribosome) can acquire a range of conformations, which can be characterized by NMR spectroscopy. Using experimental restraints within molecular-dynamics simulations, the ensemble of NC structures can be described. In order to delineate the process of co-translational protein folding, a hybrid structural biology approach is foreseeable, potentially offering a complete atomic description of protein folding as it occurs on the ribosome.

Keywords: NMR; cryo-EM; nascent chain; protein folding; ribosome.


Figures

Figure 1
Figure 1
Protein biosynthesis on the ribosome. The illustrated diagram shows the key protein-translation steps performed by bacterial ribosomes. During translation, the ribosome is engaged in four key steps: initiation, elongation, termination and recycling (highlighted in yellow boxes). Translation initiation starts with the 30S subunit (yellow) binding near the initiation codon on mRNA at the Shine–Dalgarno (SD) sequence (Schmeing & Ramakrishnan, 2009; light green). Upon recruitment of the formylmethionyl-tRNA (fMet-tRNA; orange) at the P-site, carrying the methionine amino acid (cyan), the 50S subunit (blue) binds to form the initiation complex. Individual steps of the elongation cycle are shown in blue boxes. An incoming aminoacyl-tRNA (aa-tRNA; red), carrying a charged amino acid (cyan circle), bound to EF-Tu-GTP (purple) binds at the A site of the ribosome (in the A-site accommodation step). Upon mRNA decoding and a correct codon–anticodon pair between the mRNA and tRNA, EF-Tu hydrolyses GTP and dislocates (shown as a purple dashed arrow), allowing peptide-bond formation between A-site and P-site tRNAs in the peptidyl-transfer step. Elongation factor EF-G (dark brown) then binds to allow tRNAs to translocate from the A to P sites and from the P to E sites (translocation step) with energy derived from GTP catalysis. The release of EF-G (GDP-bound, shows as a brown arrow) enables deacetylated tRNA to exit (E-tRNA; green). During tRNA translocation, EF4-GTP (magenta; Qin et al., 2006 ▸) can rescue stalled ribosomes by back-translocation (shown as dashed magenta arrows) to the peptidyl-transfer step to proceed with normal protein elongation.
Figure 2
Figure 2
Structural biology of ribosomes. A chronological overview of structural ribosome studies related to developments in electron microscopy and X-ray crystallography. Cryo-EM has recently undergone a ‘resolution revolution’ phase (highlighted in red), revealing the structural details of ribosomes from different kingdoms of life at nearly the atomic level. The red encircled image at the upper left in the electron-microscopy panel shows the ribosome–NC complex (NC labelled with antibodies; Bernabeu & Lake, 1982 ▸), imaged using negative-stain electron microscopy to identify the relative location of the ribosome exit tunnel. In the right panel, atomic structural studies of ribosomes by X-ray crystallography are highlighted. Each structure is described in the main text.
Figure 3
Figure 3
The ribosomal exit tunnel and NCs visualized by cryo-EM. (a) The active ribosome comprises 30S (yellow) and 50S (blue) subunits. The exit tunnel site is shown in the central section of the large 50S subunit. The tunnel starts at the PTC and is lined with 23S rRNA nucleotides (purple), the L4 and L22 loops (cyan and green), forming a constriction site, the L23 (violet) loop, 23S rRNA nucleotides (purple) and the L24 (pink) loop at the vestibule region and is shown here with a nascent polypeptide chain (red). The dimensions of the exit tunnel are narrower at the top, ∼10 Å (starting at the C-­terminus of the NC), and wider near the vestibule, ∼20 Å. 23S rRNA nucleotides and constriction-site residues (marked regions 1–3, respectively) interact equally with the NC. (b) A schematic representation of the three (bacterial) ribosome-stalling NCs visualized by cryo-EM. The left sides of (b) and (c) indicate different areas in the tunnel (starting at the PTC): upper, central tunnel and vestibule regions. Types of interactions between the tunnel components and the stalling NC residues and their relative interaction points are indicated in different colours (grey circle for non-electrostatic, green circle for electrostatic). l-­Tryptophan-binding pockets and an antibiotic-binding pocket for ERY are shown in orange and red, respectively. In 70S–TnaC (shown in purple), the Pro24 and Val20 residues of the TnaC NC interact with U2585 (grey circle) of 23S rRNA, Lys18 interacts with A2058 (green circle), Phe11 interacts with A751 of 23S rRNA (grey circle) and Trp12 interacts with L22 Lys90 (green circle), requiring free l-tryptophan (W1 and W2, orange) molecules to induce ribosome stalling. 70S–SecM shows two SecM NC conformations: SecM-Pro (opaque brown) and SecM-Gly (brown) stalled forms. In SecM-Gly, Ala164 interacts with U2585 (grey circle), Arg163 interacts with the U2585 nucleotide of 23S rRNA (green circle) and Trp155 interacts with Arg64 of the L4 loop (green circle) or A751 of 23S rRNA (grey circle) in SecM-Pro, to induce ribosome stalling. In 70S–ErmBL, the NC (in blue) also adopts a unique conformation induced by bound antibiotic erythromycin (ERY, red) to induce ribosome stalling. The flexible N-terminal residues (shown in yellow, encircled in red) do not interact with ERY but instead adopt altered geometry to allow the critical C-terminal Arg7 residue to interact with U2586 of 23S rRNA (green circle) and cause a translational pause. (c) Three NCs co-translationally folding at the vestibule region on stalled ribosomes as visualized by cryo-EM. 70S–TnaC–R16 (TnaC in purple, GS linker in dark purple, R16 in pink) shows the R16 partially folded domain at the lower vestibule region. 70S–SecM–ADR1α (SecM in brown, ADR1α in red) shows the folded zinc-binding domain at the vestibule region of the tunnel. In 80S–RNC, on a non-stop codon mRNA stalled ribosome, the NC forms an α-helix (in yellow with the α-helix shown as a black line) at the start of the vestibule region.
Figure 3
Figure 3
The ribosomal exit tunnel and NCs visualized by cryo-EM. (a) The active ribosome comprises 30S (yellow) and 50S (blue) subunits. The exit tunnel site is shown in the central section of the large 50S subunit. The tunnel starts at the PTC and is lined with 23S rRNA nucleotides (purple), the L4 and L22 loops (cyan and green), forming a constriction site, the L23 (violet) loop, 23S rRNA nucleotides (purple) and the L24 (pink) loop at the vestibule region and is shown here with a nascent polypeptide chain (red). The dimensions of the exit tunnel are narrower at the top, ∼10 Å (starting at the C-­terminus of the NC), and wider near the vestibule, ∼20 Å. 23S rRNA nucleotides and constriction-site residues (marked regions 1–3, respectively) interact equally with the NC. (b) A schematic representation of the three (bacterial) ribosome-stalling NCs visualized by cryo-EM. The left sides of (b) and (c) indicate different areas in the tunnel (starting at the PTC): upper, central tunnel and vestibule regions. Types of interactions between the tunnel components and the stalling NC residues and their relative interaction points are indicated in different colours (grey circle for non-electrostatic, green circle for electrostatic). l-­Tryptophan-binding pockets and an antibiotic-binding pocket for ERY are shown in orange and red, respectively. In 70S–TnaC (shown in purple), the Pro24 and Val20 residues of the TnaC NC interact with U2585 (grey circle) of 23S rRNA, Lys18 interacts with A2058 (green circle), Phe11 interacts with A751 of 23S rRNA (grey circle) and Trp12 interacts with L22 Lys90 (green circle), requiring free l-tryptophan (W1 and W2, orange) molecules to induce ribosome stalling. 70S–SecM shows two SecM NC conformations: SecM-Pro (opaque brown) and SecM-Gly (brown) stalled forms. In SecM-Gly, Ala164 interacts with U2585 (grey circle), Arg163 interacts with the U2585 nucleotide of 23S rRNA (green circle) and Trp155 interacts with Arg64 of the L4 loop (green circle) or A751 of 23S rRNA (grey circle) in SecM-Pro, to induce ribosome stalling. In 70S–ErmBL, the NC (in blue) also adopts a unique conformation induced by bound antibiotic erythromycin (ERY, red) to induce ribosome stalling. The flexible N-terminal residues (shown in yellow, encircled in red) do not interact with ERY but instead adopt altered geometry to allow the critical C-terminal Arg7 residue to interact with U2586 of 23S rRNA (green circle) and cause a translational pause. (c) Three NCs co-translationally folding at the vestibule region on stalled ribosomes as visualized by cryo-EM. 70S–TnaC–R16 (TnaC in purple, GS linker in dark purple, R16 in pink) shows the R16 partially folded domain at the lower vestibule region. 70S–SecM–ADR1α (SecM in brown, ADR1α in red) shows the folded zinc-binding domain at the vestibule region of the tunnel. In 80S–RNC, on a non-stop codon mRNA stalled ribosome, the NC forms an α-helix (in yellow with the α-helix shown as a black line) at the start of the vestibule region.
Figure 4
Figure 4
The participation of ribosome in co-translational protein folding. (a) An mRNA template with synonymous codons (in black) often includes substituted rare-codon clusters (in pink) near the 3′ end. Ribosomes (dark grey) progressively translate (indicated by black arrows) NCs using this mRNA template until they encounter the rare-codon segment, where they pause (ribosome in colour with a red cross). The paused ribosome state (boxed) provides time for the emerged NC (in red) to undergo folding. (b) An NC sequence (shown in green) can interact with the ribosome surface inside and on the outside surface (highlighted in pink circles), which can help NCs to avoid misfolding. (c) Several ribosome-associating factors (RAFs) bind to the ribosome co-translationally and interact with the emerging NC (only bacterial RAFs are shown). N-terminal processing RAFS (PDF, magenta; MAP, purple) bind to the ribosome near the exit port of the 50S. Similarly, chaperones such as SRP (in orange; RNA in black) and TF (in blue) bind near the 50S exit port to assist co-translational translocation and folding, respectively.
Figure 5
Figure 5
Complementary structural methods to study dynamic biological systems. (a) Diagram of the cryo-EM map of the ErmBL stalled NC structure bound to A-tRNA (brown), P-tRNA (dark orange) and erythromycin (ERY, red), as shown in the enlarged panel. In this panel, the ErmBL NC (blue) flexible N-­terminus is located (circled in red) near to the ERY binding pocket (red). This region was modelled in using the N-terminal peptide sequence of ErmBL with and without the ERY molecule in an all-atom MD simulation. The graph from the MD simulation (bottom panel) shows the calculated root-mean-squared fluctuations (r.m.s.f.s) in the N-terminal residues (x axis) with (red) and without (green) the ERY antibiotic molecule (adopted from Arenz et al., 2016 ▸). (b) The schematic panel describes how co-translational folding of an Ig domain was studied using biochemical construct design, NMR spectroscopy and MD simulation. FLN5 RNCs (brown) were labelled at specific Ile residues (blue) with 13C and the RNC constructs had multiple linker lengths. The FLN6 (cyan) linkers were varied in their lengths while the FLN5 (also known as Dom5, brown) and SecM (green) peptide sequences were kept the same. This enabled tethering FLN5 (brown) on the ribosome and ‘structural snapshots’ of FLN5 emerging and folding on the ribosome to be taken by NMR spectroscopy. (c) Each13C–1H two-dimensional NMR spectrum shows the chemical shifts for the labelled Ile residues on FLN5 RNCs; the first spectrum in the top left panel shows an overlay of isolated and folded FLN5 (cyan peaks) and an unfolded variant (Δ16; orange peaks). This spectrum was used as a reference to map Ile residues for FLN5 RNCs at different linker lengths (two-dimensional spectra for FLN5+45, FLN5+47 and FLN5+110 below). An ensemble of FLN5 NC structures was reported using NMR spectroscopy and MD simulation (adopted from Cabrita et al., 2016 ▸).

Similar articles

Cited by

References

    1. Agrawal, R. K., Penczek, P., Grassucci, R. A., Li, Y., Leith, A., Nierhaus, K. H. & Frank, J. (1996). Science, 271, 1000–1002. - PubMed
    1. Agrawal, R. K., Spahn, C. M. T., Penczek, P., Grassucci, R. A., Nierhaus, K. H. & Frank, J. (2000). J. Cell Biol. 150, 447–460. - PMC - PubMed
    1. Amunts, A., Brown, A., Bai, X.-C., Llacer, J. L., Hussain, T., Emsley, P., Long, F., Murshudov, G., Scheres, S. H. W. & Ramakrishnan, V. (2014). Science, 343, 1485–1489. - PMC - PubMed
    1. Amunts, A., Brown, A., Toots, J., Scheres, S. H. W. & Ramakrishnan, V. (2015). Science, 348, 95–98. - PMC - PubMed
    1. Anfinsen, C. B. (1973). Science, 181, 223–230. - PubMed