. 2017 Jun 30;127(7):2789-2804.
doi: 10.1172/JCI92079. Epub 2017 Jun 5.

Tregs restrain dendritic cell autophagy to ameliorate autoimmunity

Affiliations

Tregs restrain dendritic cell autophagy to ameliorate autoimmunity

Themis Alissafi et al. J Clin Invest. .

Abstract

Design of efficacious Treg-based therapies and establishment of clinical tolerance in autoimmune diseases have proven to be challenging. The clinical implementation of Treg immunotherapy has been hampered by various impediments related to the stability and isolation procedures of Tregs as well as the specific in vivo targets of Treg modalities. Herein, we have demonstrated that Foxp3+ Tregs potently suppress autoimmune responses in vivo through inhibition of the autophagic machinery in DCs in a cytotoxic T-lymphocyte-associated protein 4-dependent (CTLA4-dependent) manner. Autophagy-deficient DCs exhibited reduced immunogenic potential and failed to prime autoantigen-specific CD4+ T cells to mediate autoimmunity. Mechanistically, CTLA4 binding promoted activation of the PI3K/Akt/mTOR axis and FoxO1 nuclear exclusion in DCs, leading to decreased transcription of the autophagy component microtubule-associated protein 1 light chain 3β (Lc3b). Human DCs treated with CTLA4-Ig, a fusion protein composed of the Fc region of IgG1 and the extracellular domain of CTLA4 (also known as abatacept, marketed as Orencia), demonstrated reduced levels of autophagosome formation, while DCs from CTLA4-Ig-treated rheumatoid arthritis patients displayed diminished LC3B transcripts. Collectively, our data identify the canonical autophagy pathway in DCs as a molecular target of Foxp3+ Treg-mediated suppression that leads to amelioration of autoimmune responses. These findings may pave the way for the development of therapeutic protocols that exploit Tregs for the treatment of autoimmunity as well as diseases in which disturbed tolerance is a common denominator.


Conflict of interest statement

Conflict of interest: The authors have declared that no conflict of interest exists.

Figures

Figure 1
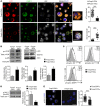
Figure 1. Foxp3+ Treg–mediated tolerance regulates autophagy in DCs.
(A) Hierarchical clustering of autophagy-related genes upon transcriptomic analysis of sorted DCs from control (n = 2) and tolerized (n = 3) mice. (B) Relative mRNA expression of Atg5 and Atg16l1 in DCs from control, tolerized, and tolerized Foxp3+ Treg–depleted mice. Results are expressed as mean ± SEM. n = 6 mice per group, 3 independent experiments. *P = 0.0389; P = 0.0147; P = 0.0145; §P = 0.0241. (C) Western blot analysis for expression of LC3, p62, and actin in DC lysates of indicated groups. Protein extract from Neuro 2A cell line was used as control. One representative experiment of 4 is depicted. Relative intensity of LC3II/LC3I and p62 are depicted. Results are expressed as mean ± SEM. n = 6 mice per group, 3 independent experiments. *P = 0.0184; P = 0.05; P = 0.0432. (D) Immunofluorescence confocal microscopy for LC3 (red), LAMP-1 (green), p62 (silver white), and DAPI (blue) in DCs. Representative fields at 2 different magnifications are depicted. Scale bars: 5 μm. One representative experiment of 3 is shown. n = 4 mice per group. LC3 puncta/cell and p62 puncta/cell are depicted. ***P < 0.0001; **P = 0.0003. Results are expressed as mean ± SEM. n = 4 mice per group, 3 independent experiments. For AD, DCs were isolated from dLNs and spleens of mice at 3.5 days after immunization. Statistical significance was obtained by 2-way ANOVA.
Figure 2
Figure 2. Foxp3+ Tregs suppress the autophagic machinery of DCs under inflammatory conditions.
DCs were isolated from dLNs and spleen of Rag1–/– immunized mice adoptively transferred with Foxp3+ or Foxp3 CD4+ T cells. (A) Immunofluorescence confocal microscopy for LC3 (red), LAMP-1 (green), p62 (silver white), and DAPI (blue). Representative fields at 2 different magnifications. Scale bars: 5 μm; 10 μm (magnified). One representative experiment is shown. LC3 puncta/cell and p62 puncta/cell are depicted. ***P < 0.0001. (B) Western blot analysis for expression of p-mTOR, total mTOR, p-p85, total p85, p-Akt, and total Akt. *P = 0.05; P = 0.0241; P = 0.0110. (C) p-4EBP1, p-S6, and p-Akt expression analyzed by flow cytometry. MFI, mean fluorescence intensity. (D) Western blot analysis for expression of p-ULK-1 and total ULK-1. *P = 0.0334. (E) Immunofluorescence confocal microscopy for p-ULK-1 (silver white) and DAPI (blue). Scale bar: 10 μm. One representative experiment is shown. p-ULK-1 puncta/cell are depicted. ***P < 0.0001. For A and E, results are expressed as mean ± SEM. n = 4 mice per group, 3 independent experiments. Statistical significance was obtained by unpaired Student’s t test. For BD, 1 representative experiment of 4 is depicted.
Figure 3
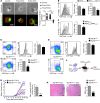
Figure 3. Restrained DC autophagy impairs antigen presentation and CD4+ T cell responses.
(A) Carboxylated beads conjugated to LPS/OVA-Fluor (green) were internalized by DCs from Rag1–/– immunized mice adoptively transferred with Foxp3+ or Foxp3CD4+ T cells and analyzed for LC3 (red). ***P < 0.0001, Pearson’s correlation coefficient. Representative images from 3 experiments Scale bars: 5 μm. (B and C) DCs from naive mice were treated with LPS and MOG35–55 in the presence or absence of NH4Cl (B) or MRT37607 (C) for 4 hours and cultured with CellTrace-labeled 2D2 T cells. CellTrace dilution and division index are shown. *P = 0.0187; **P = 0.0070; P = 0.0363. (D) DCs from Atg16l1ΔCd11lc or Atg16l1fl/fl MOG35–55–immunized mice were pulsed with MOG35–55 for 4 hours and cultured with CellTrace-labeled 2D2 T cells. CellTrace dilution and division index are shown. *P = 0.0438; **P = 0.0012. (E) DCs from Atg16l1ΔCd11lc or Atg16l1fl/fl mice were pulsed with OVA protein for 18 hours and cultured with CellTrace-labeled OT-II T cells. CellTrace dilution and division index are shown. Representative images from 3 experiments. **P = 0.0073. (F) Experimental design for EAE induction upon adoptive transfer of DCs from Atg16l1ΔCd11lc or Atg16l1fl/fl mice and 2D2 T cells into Rag1–/– mice. (G) Mean clinical score and EAE severity. *P = 0.0494; P = 0.0180; P = 0.0196; §P = 0.0121; P = 0.0066; **P = 0.0061; ***P < 0.0001. (H) Representative H&E sections from spinal cords of Atg16l1ΔCd11lc (clinical score 3.5) and Atg16l1fl/fl (clinical score 1.5) mice at 14 days after immunization. ***P < 0.0001. Results are expressed as mean ± SEM. n = 4 mice per group. Statistical significance was obtained by unpaired Student’s t test (BH) or 2-way ANOVA (A).
Figure 4
Figure 4. Foxp3+ Tregs modulate macroautophagy in DCs in a CTLA4-dependent fashion.
(A) Confocal microscopy for cocultures of OVA-specific OT-II Tregs with sorted DCs from syngeneic LC3-GFP mice in the presence of OVA323–339 peptide and anti-CTLA4 mAbs. Representative images from 3 individual experiments are depicted. Scale bars: 10 μm. (B) Western blot analysis for LC3, p62, and actin in DC lysates of indicated groups. One representative experiment of 3 is depicted. Relative intensities of LC3II/LC3I and p62 are depicted. Results are expressed as mean ± SEM. n = 6 mice per group, 3 independent experiments. *P = 0.0290; P = 0.0341; P = 0.0392. (C and D) Immunofluorescence confocal microscopy for LC3 (red), LAMP-1 (green), p62 (silver white), and DAPI (blue) in DCs isolated from dLNs and spleen of (C) Foxp3+ transferred Rag1–/– mice or (D) CTLA4 iKO or control littermate mice. LC3 and p62 puncta/cell are depicted. Representative fields in 2 different magnifications are depicted. Scale bars: 5 μm. ***P < 0.0001. One representative experiment of 3 is shown. Results are expressed as mean ± SEM. n = 4 mice per group, 3 independent experiments. Statistical significance was obtained by 2-way ANOVA (B and C) or unpaired Student’s t test (D).
Figure 5
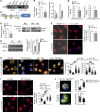
Figure 5. CTLA4 activates PI3K/Akt/mTOR signaling cascade to suppress canonical autophagy in BMDCs.
BMDCs were treated with LPS, CTLA4-Ig, or IgG for 16 to 20 hours (A, B, and DH) or 4 hours (C). (A) Relative mRNA expression of Atg5, Atg16l1, and Becn1. *P = 0.0432; P = 0.0388; P = 0.0390. (B) LC3 (red), LAMP-1 (green), p62 (silver white), and DAPI (blue). Scale bar: 10 μm. One representative experiment of 3. LC3 and p62 puncta/cell are depicted. ***P < 0.0001. (C) BMDCs were treated with chloroquine or bafilomycin A1 for 4 hours. Cell lysates were subjected to Western blotting for LC3 and actin. One representative experiment of 4 is shown. Relative intensity of LC3II/LC3I is depicted. *P = 0.0237; P = 0.0491; P = 0.05; §P = 0.0148. (D) p-4EBP1, p-S6, and p-Akt expression. One representative experiment of 4 is shown. (E) BMDCs from Pik3cg–/– or WT animals were treated with LPS or CTLA4-Ig for 16 hours and pulsed with MOG35–55 for an additional 6 hours, washed, and cultured with CellTrace-labeled 2D2 T cells. CellTrace dilution, CD25 expression, and division index are depicted. One representative experiment of 5. *P = 0.0198, P = 0.0310, **P = 0.0089, P = 0.0030. (F) BMDCs were treated with anti-B7.1 and anti-B7.2 three hours prior to CTLA4-Ig. LC3 and p62 puncta/cell are depicted. ***P < 0.0001. (G) MDCs were treated with CD28 Ig for 16 to 20 hours. bLC3 and p62 puncta/cell are depicted. ***P < 0.0001. Results are expressed as mean ± SEM. n = 4–6 mice per group, 3 independent experiments. Statistical significance was obtained by unpaired Student’s t test (A and B) or 2-way ANOVA (CG).
Figure 6
Figure 6. CTLA4-mediated nuclear exclusion of FoxO1 in DCs.
(A) Western blot for CD86 following immunoprecipitation of p85-containing complexes in DCs from Foxp3+ Treg–transferred MOG35–55–immunized Rag1–/– mice. (B and D) WT or Akt1–/– BMDCs were treated with LPS and CTLA4-Ig or IgG for 12 or 20 hours (B and EJ). (B) mRNA expression of Foxo1 and Lc3b. *P = 0.0214; **P = 0.0214; P = 0.0023. (C) Schematic representation of Lc3b proximal promoter with FoxO1-binding sites (A1 and A2). (D) ChIP analysis of the promoter of Lc3b gene for FoxO1-binding sites. *P = 0.0359; P = 0.0489. Statistical significance using paired t test. (E) Western blot for FoxO1, tubulin, and TBP from cytoplasmic (CEs) and nuclear (NEs) extracts. Relative intensity of FoxO1. *P = 0.0405. (F) FoxO1 (red), and DAPI (blue). Scale bar: 10 μm. Relative intensity of nuclear FoxO1. **P < 0.0001. (G) Western blot for LC3 and actin. Relative intensity of LC3II/LC3I using 2-way ANOVA. *P = 0.05; P = 0.0291; **P = 0.0069. (H) LC3 (red), LAMP-1 (green), p62 (silver white), and DAPI (blue). Scale bar: 10 μm. LC3 and p62 puncta/cell are depicted. ***P < 0.0001; *P = 0,0142; P = 0.027. (I) FoxO1 (red) and Dapi (blue). Scale bar: 10 μm. Relative intensity of nuclear FoxO1. ***P < 0.0001. (J) BMDCs were transfected with FoxO1WT or FoxO1AAA. LC3 and p62 puncta/cell are depicted. Scale bar: 5 μm. ***P < 0.0001. Results are expressed as mean ± SEM. n = 4–5 mice. One representative experiment of 3 or 4 is shown. For B, E, F, and HJ, statistical significance was obtained by unpaired Student’s t test.
Figure 7
Figure 7. CTLA4-Ig diminishes autophagy pathway in human DCs and promotes FoxO1 nuclear exclusion.
(A) CD11c+CD14HLADR+ DCs were isolated from the periphery of anti–TNF-α–treated (n = 5) or CTLA4-Ig–treated (n = 7) RA patients (DAS > 3). Relative mRNA expression of Lc3b. *P = 0.0252. Results are expressed as mean ± SEM. (BD) PBMCs were isolated from the periphery of healthy individuals and differentiated toward DCs in the presence of GMCSF and IL-4. DCs were treated with LPS in the presence or absence of CTLA4-Ig or Ly294002 for 16 hours. (B) Immunofluorescence confocal microscopy for LC3 (red) and p62 (silver white). Scale bar: 10 μm. One representative experiment of 3 is shown. LC3 puncta/cell and p62 puncta/cell are depicted. Results are expressed as mean ± SEM; n = 6 donors per group. ***P < 0.0001. (C) Western blot analysis for expression of p-mTOR, total mTOR, p-p85, total p85, p-Akt, and total Akt in DC lysates. One representative experiment of 3 is depicted. *P = 0.0181; P = 0.0438; P = 0.0432. (D) Immunofluorescence confocal microscopy for FoxO1 (red) and DAPI (blue). Scale bar: 10 μm. One representative experiment is shown. Relative intensity for nuclear FoxO1 is depicted. Results are expressed as mean ± SEM. n = 6 healthy donors per group. Statistical significance was obtained by unpaired Student’s t test. ***P < 0.0001.

Comment in

References

    1. Littman DR, Rudensky AY. Th17 and regulatory T cells in mediating and restraining inflammation. Cell. 2010;140(6):845–858. doi: 10.1016/j.cell.2010.02.021. - DOI - PubMed
    1. Sakaguchi S, Yamaguchi T, Nomura T, Ono M. Regulatory T cells and immune tolerance. Cell. 2008;133(5):775–787. doi: 10.1016/j.cell.2008.05.009. - DOI - PubMed
    1. Onishi Y, Fehervari Z, Yamaguchi T, Sakaguchi S. Foxp3+ natural regulatory T cells preferentially form aggregates on dendritic cells in vitro and actively inhibit their maturation. Proc Natl Acad Sci U S A. 2008;105(29):10113–10118. doi: 10.1073/pnas.0711106105. - DOI - PMC - PubMed
    1. Tang Q, et al. Visualizing regulatory T cell control of autoimmune responses in nonobese diabetic mice. Nat Immunol. 2006;7(1):83–92. doi: 10.1038/ni1289. - DOI - PMC - PubMed
    1. Matheu MP, et al. Imaging regulatory T cell dynamics and CTLA4-mediated suppression of T cell priming. Nat Commun. 2015;6:6219. - PMC - PubMed