. 2017 Jul 13;547(7662):227-231.
doi: 10.1038/nature22979. Epub 2017 Jun 5.

Dystrophin-glycoprotein complex sequesters Yap to inhibit cardiomyocyte proliferation

Affiliations

Dystrophin-glycoprotein complex sequesters Yap to inhibit cardiomyocyte proliferation

Yuka Morikawa et al. Nature. .

Abstract

The regenerative capacity of the adult mammalian heart is limited, because of the reduced ability of cardiomyocytes to progress through mitosis. Endogenous cardiomyocytes have regenerative capacity at birth but this capacity is lost postnatally, with subsequent organ growth occurring through cardiomyocyte hypertrophy. The Hippo pathway, a conserved kinase cascade, inhibits cardiomyocyte proliferation in the developing heart to control heart size and prevents regeneration in the adult heart. The dystrophin-glycoprotein complex (DGC), a multicomponent transmembrane complex linking the actin cytoskeleton to extracellular matrix, is essential for cardiomyocyte homeostasis. DGC deficiency in humans results in muscular dystrophy, including the lethal Duchenne muscular dystrophy. Here we show that the DGC component dystroglycan 1 (Dag1) directly binds to the Hippo pathway effector Yap to inhibit cardiomyocyte proliferation in mice. The Yap-Dag1 interaction was enhanced by Hippo-induced Yap phosphorylation, revealing a connection between Hippo pathway function and the DGC. After injury, Hippo-deficient postnatal mouse hearts maintained organ size control by repairing the defect with correct dimensions, whereas postnatal hearts deficient in both Hippo and the DGC showed cardiomyocyte overproliferation at the injury site. In the hearts of mature Mdx mice (which have a point mutation in Dmd)-a model of Duchenne muscular dystrophy-Hippo deficiency protected against overload-induced heart failure.


Figures

Extended Data Figure 1
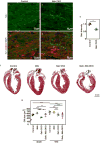
Extended Data Figure 1. Cardiomyocyte alignment after apex resection in P8 mouse hearts
a-o, Hearts were collected 21 days after apex resection was performed in P8 mice. Hearts of control (a, e, i), Mdx (b, f, j), Salv conditional knockout (CKO) (c, g, k), and Salv;Mdx double knockout (DKO, d, h, l) mice were stained for cardiac troponin T (cTNT) and wheat germ agglutinin (WGA) for CMs and cell membranes, respectively. For control and Mdx hearts, the apex regions above the scar are shown. For Salv CKO and Salv;Mdx DKO hearts, the apex regions that regenerated are shown. m, Sarcomere length in each CM was measured. Groups were compared by using one-way analysis of variance (n=3 for each genotype). No statistically significant difference was observed between samples. n, o, CM orientation in either the border zone or repaired area. In panel n, a representative image shows how the orientation angles of CMs were measured. Angles referenced to the plane of resection were measured for each CM. A total of 50 CMs were measured for each sample. o, Histograms showing the distribution of CM orientation angles for each genotype (n=3 for each genotype; 150 CMs total were analyzed for each genotype). Variance between genotype groups was compared by using an F-test.
Extended Data Figure 2
Extended Data Figure 2. Protrusion formation in border zone cardiomyocytes and migration of postnatal cardiomyocytes after apex resection in mice
a-e, Apex resection was performed in P8 hearts of control (a), Mdx (b), Salv conditional knockout (CKO) (c), and Salv;Mdx double knockout (DKO, d) mice, and hearts were collected 4 days after resection. CMs were stained for cardiac troponin T (cTNT), and images were documented of the tissue around border zone CMs. Dotted lines show plane of resection. Arrowheads show CM protrusions. e, Quantification of CM protrusions (n=3 for each genotype). CMs adjacent to the scar were analyzed for length and number of protrusions 4 days after resection. One hundred CMs from each heart were analyzed. Groups were compared by using analysis of variance (ANOVA) with Bonferroni's multiple comparison test for pairwise comparisons. **p<0.01. CM, cardiomyocyte. f-m, Immunostaining for vinculin to visualize cytoskeletal rearrangement in border zone CMs of control (f, j), Mdx (g, k), Salv CKO (h, l), and Salv;Mdx DKO (i, m) mouse hearts. CMs were labeled with anti-sarcomeric actinin. Arrowheads indicate where the upregulation of vinculin is visible in Salv CKO border zone CMs. n-r, Collagen gel assay results for P10 hearts collected from control (n), Mdx (o), Salv CKO (p), and Salv;Mdx DKO mice (q). Gel was stained with DAPI and for cTNT. r, Quantification of hearts in which migration was observed. Groups were compared by using the Fisher's exact test. Control vs Salv CKO, p=0.0097; Mdx vs Salv CKO, p=0.0097; Salv CKO vs Salv;Mdx DKO, p=0.007.
Extended Data Figure 3
Extended Data Figure 3. Characterization of mouse hearts after transverse aortic constriction surgery
a-e, Knockout efficiency in Salv conditional knockout (CKO) mice. Immunohistochemical analysis of Salv was performed in control (a, c) and Salv CKO (b, d) mouse hearts 2 weeks after transverse aortic constriction (TAC) surgery. CMs were labeled with anti-sarcomeric actinin. e, Quantification of Salv intensity (n=3 for each treatment) measured according to pixel intensity. Groups were compared by using the Mann-Whitney U test (n=3 for each treatment). *p<0.05. f-g Histology and cell size after TAC surgery. f, Representative images showing trichrome staining of hearts 2 weeks after TAC surgery in control Mdx, Salv CKO, and Salv;Mdx double knockout (DKO) mice. g, CM size 2 weeks after sham or TAC surgery. Cell size was measured in wheat germ agglutinin (WGA)-stained sections by using ImageJ software. Groups were compared by using analysis of variance (ANOVA) with Bonferroni's post-hoc test for pairwise comparisons (n=3 each). *p<0.05, **p<0.01, ***p<0.001.
Extended Data Figure 4
Extended Data Figure 4. Echocardiographic measurements
a, Color Doppler echocardiography across the transverse aorta before transverse aortic constriction (pre-TAC, left panel), and after transverse aortic constriction (post-TAC, right panel). The constriction site (TAC) is labeled on the post-TAC image. b, Doppler echocardiography measurement of peak pressure through the constriction site two weeks after TAC. Sham (n=9), TAC (n=7). Groups were compared by using analysis of variance (ANOVA) with the Tukey post-hoc test for pairwise comparisons, ***p<0.001. c, Interventricular septal (IVS) thickness during diastole (IVS.d, left panel) and systole (IVS.s, right panel). d, Left ventricular internal diameter (LVID) during diastole (LVID.d, left panel) and systole (LVID.s, right panel). e, Left ventricular posterior wall (LVPW) thickness during diastole (LVPW.d, left panel) and systole (LVPW.s, right panel). Sham control (n= 4); sham Salv conditional knockout (CKO, n=4); sham Mdx (n=6); sham Salv;Mdx double knockout (DKO, n=12). TAC control (n=5); TAC Salv CKO (n=8); TAC Mdx (n=5); TAC Salv;Mdx DKO (n=11). Groups were compared by using analysis of variance (ANOVA) with the Tukey post-hoc test for pairwise comparisons. Significant differences with the Mdx group two weeks post TAC are indicated. *p<0.05, **p<0.01, ***p<0.001.
Extended Data Fig. 5
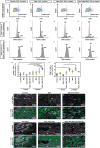
Extended Data Fig. 5. EdU incorporation analysis after transverse aortic constriction (TAC) surgery
a-n, Flow cytometry analysis on isolated nuclei after transverse aortic constriction (TAC) surgery. a-l, Representative images of flow cytometry analysis on the nuclei isolated from control (a, e, i), Mdx (b, f, j), Salv conditional knockout (CKO; c, g, k), and Salv;Mdx double knockout (DKO; d, h, l) mouse hearts after TAC surgery. a-d, PCM1+ population was gated and plots show EdU incorporation. e-h, Histogram showing DAPI intensity in PCM1+ population and discrimination between 2N, 4N, and >4N population. i-l, Histogram showing DAPI intensity in PCM1+, EdU+ population. m, n, Quantification of PCM1+, EdU+ nuclei in >2N-4N (m) and >4N (n) population. Groups were compared by using analysis of variance (ANOVA) with the Tukey post-hoc test for pairwise comparisons (n=3). *p<0.05, **p<0.01. o-v, Representative images showing EdU staining of control (o, u), Mdx (p, v), peri-fibrotic area of Mdx (q, w), Salv conditional knockout (CKO) (r, x), Salv;Mdx double knockout (DKO; s, y) and peri-fibrotic area of DKO (t, z) mouse heart sections after TAC surgery collected after 2 weeks. CMs were stained for actinin and cells were delineated by WGA. Arrowheads show EdU-positive CMs. Quantification of EdU-positive CMs is shown in Figure 3n. Peri-fibrotic area defined in Methods.
Extended Data Figure 6
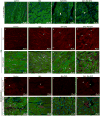
Extended Data Figure 6. Immunohistochemical analysis of mouse hearts after transverse aortic constriction (TAC) surgery
a-d, Representative images for aurora kinase B (AurkB) staining of control (a), Mdx (b), Salv CKO (c), and Salv;Mdx DKO (d) mouse hearts 2 weeks after TAC surgery. CMs were stained with anti-cTNT antibody. Quantification of AurkB-positive CMs is shown in Figure 3o. Arrowheads indicate positive AurkB staining. e-k, Representative images showing Yap staining of control (e, i), Mdx (f, j), Salv conditional knockout (CKO) (g, k), and Salv;Mdx double knockout (DKO; h, l) mouse hearts after TAC surgery. CMs were detected by immunostaining for cardiac troponin T (cTNT). Arrowheads point to Yap localized in nuclei. Quantification of CMs with nuclear Yap is shown in Figure 3p. m-t, Representative images for active caspase 3 staining of control (m, q), Mdx (n, r), Salv conditional knockout (CKO;o, s), and Salv;Mdx double knockout (DKO;p, t) mouse hearts 1 and 2 weeks after TAC surgery. CMs were stained with anti-cardiac troponin T (cTNT) antibody. Arrowheads show active caspase 3–positive CMs. Quantification of active caspase 3–positiveCMs is shown in Figure 3q.
Extended Data Figure 7
Extended Data Figure 7. Immunohistochemical analysis for phospho-Yap and Vinculin after transverse aortic constriction (TAC) surgery
a-h, Representative images showing phospho-Yap (P-Yap) staining of control (a, e), Mdx (b, f), Salv CKO (c, g), and Salv;Mdx DKO (d, h) mouse hearts after TAC surgery. CMs were detected by immunostaining for cardiac troponin T (cTNT). Arrows indicate P-Yap in intercalated discs. i, Quantification of P-Yap levels (n=3 for each genotype) measured according to pixel intensity. Groups were compared by using one-way analysis of variance with the Tukey post-hoc test for pairwise comparisons. **p<0.01. j-q, Representative images for vinculin staining of control (j, n), Mdx (k, o), Salv CKO (l, p), and Salv;Mdx DKO (m, q) mouse hearts after TAC surgery. Vinculin staining was used to detect cytoskeletal rearrangements in CMs after TAC surgery. Sarcomeres were stained with anti-sarcomeric actinin.
Extended Data Figure 8
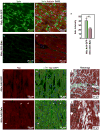
Extended Data Figure 8. Adeno-associated virus (AAV9)-treated Mdx hearts after transverse aortic constriction (TAC) surgery
Mouse hearts were collected 11 weeks after TAC surgery. a-d, Staining for Salvador in Mdx hearts transfected with AAV9-GFP (a, b) or AAV9-Salv (c, d). CMs were stained with actinin. e, Quantification of Salv (n=5 each treatment) measured according to pixel intensity. Groups were compared by using the Mann-Whitney U test. **p<0.01. f-i, Staining for Yap in Mdx mouse hearts transfected with AAV-GFP (f, g) or AAV-Salv (h, i). Arrowheads point to Yap localized in nuclei. j, k, Representative images showing trichrome staining of Mdx mouse hearts transfected with AAV9-GFP (j) or AAV9-Salv (k).
Extended Data Figure 9
Extended Data Figure 9. Immunoprecipitation and subcellular localization studies in C2C12 cells
a, Knockdown efficiency of the small interfering (si)RNAs used in this study. C2C12 cells were differentiated and treated with siSalv, siDmd, or control siRNA for 48 hours before harvesting. Groups were compared by using the Mann-Whitney U test (n=3 for each treatment). *p<0.05. b-d, Immunoprecipitation was performed by using protein extracts of differentiated C2C12 cells with antibodies specific for Yap (b), FLAG (c), or DAG1 (d), followed by immunoblotting of indicated proteins. Yap5SA or green fluorescent protein (GFP) constructs were transfected into C2C12 cells before differentiation (c, d). For gel source data, see Supplementary Figure 1.
Extended Data Figure 10
Extended Data Figure 10. Model of interaction between the Hippo pathway and the dystrophin glycoprotein complex (DGC)
ICD, intercalated disc. (Left side)
  1. Hippo signaling is low. YAP phosphorylation and YAP binding to the DGC is reduced.

  2. YAP-TEAD promote the transcription of target genes including Sgcδ and α-catenin.

  3. YAP-TEAD promote DGC assembly by promoting the expression of the core component Sgcδ.

  4. The ICD is immature in neonatal cardiomyocytes. Yap promotes the expression of the ICD component α3-catenin.

(Right side)
  1. Hippo signaling is high. YAP phosphorylation and YAP binding to the DGC is increased.

  2. YAP-TEAD transcription-activating activity is reduced.

  3. The DGC sequesters phosphorylated YAP through an interaction involving the PPxY motif of DAG1.

  4. The ICD is mature in adult cardiomyocytes. YAP is incorporated into the ICD independent of Hippo through α-catenin binding.

Figure 1
Figure 1. Combined loss of the dystrophin glycoprotein complex and Hippo pathway in the injured heart
a-d, Trichrome-stained sections of heart apex 21 days after resection. Fibrotic scar (arrowheads) and extra apex (arrows) are denoted. e, Fibrotic scar quantification: control (n=9), Mdx (n=4), Salv CKO (n=6), and Salv;Mdx DKO (n=7). Comparisons by analysis of variance (ANOVA) with Bonferroni's multiple comparison test for pairwise comparisons. **p<0.01, ***p<0.001. f-i, Sections showing extra apex (arrows). Dotted lines show resection plane. LV, left ventricle, RV, right ventricle. j, Quantification of extra apex size: control (n=9), Mdx (n=4), Salv CKO (n=6), and Salv;Mdx DKO (n=7). Comparisons by ANOVA with Bonferroni's multiple comparison test for pairwise comparisons. *p<0.05, **p<0.01. k, Quantification of EdU-positive CMs (n=3 for each). EdU was injected 4 hours before collection. Comparisons by ANOVA with Bonferroni's post-hoc test for pairwise comparisons. *p<0.05, **p<0.01, ***p<0.001. l, Quantification of AurkB-positive CMs (n=3 for each). Comparisons by ANOVA with the Mann-Whitney test for pairwise comparisons. *p<0.05, **p<0.01, ***p<0.001. m-p, Immunohistochemical staining of AurkB-positive CMs (arrowheads) Dotted lines delineate dividing CMs. CMs were stained for cardiac troponin T (cTNT), and nuclei with DAPI.
Figure 2
Figure 2. Yap subcellular localization and expression of downstream targets in Hippo-deficient Mdx cardiomyocytes after apex resection
a-i, Immunohistochemical staining showing Yap localization 4 days after apex resection. CMs were stained cTNT and nuclei with DAPI. Nuclear Yap (arrowheads). i, Nuclear Yap quantification in CMs (n=3 for each). Comparisons by two-way ANOVA with Mann-Whitney test for pairwise comparisons. *p<0.05, **p<0.01, ***p<0.001. j-r, Immunohistochemical staining of CCNE2 (arrowheads). r, Quantification of CCNE2-positive CMs (n=3 for each). Comparisons by one-way ANOVA with Tukey post-hoc test for pairwise comparisons. **p<0.01. s-a′, Talin immunohistochemical staining. CMs stained for sarcomeric actinin, and nuclei with DAPI. a′, Talin quantification (n=3 for each), measured by pixel intensity. Comparisons by one-way ANOVA with Tukey post-hoc test for pairwise comparisons. *p<0.05, **p<0.01.
Figure 3
Figure 3. Suppression of Mdx cardiomyopathy by Hippo deletion in a pressure overload model
a-n, Transverse aortic constriction (TAC) or sham surgery in 9-week-old control (n=4 for sham, n=5 for TAC), Mdx (n=6 for sham, n=5 for TAC), Salv conditional knockout (CKO; n=4 for sham, n=8 for TAC), and Salv;Mdx double knockout (DKO; n=12 for sham, n=11 for TAC). a-h, Trichrome stained sections 2 weeks after sham (a-d) or TAC (e-h). i, Fibrotic area quantitation. Comparisons by analysis of variance (ANOVA) with Bonferroni's post-hoc test for pairwise comparisons (n=7 for DKO TAC group, n=3 for all others). **p<0.01, ***p<0.001. j, k, Ejection fraction (EF) and fractional shortening (FS). Detailed analyses are in Extended Data Fig. 4. Comparisons by ANOVA with Tukey post-hoc test for pairwise comparisons. *p<0.05, **p<0.01. l, Estimation of total CM number. Comparisons by ANOVA with Bonferroni's post-hoc test for pairwise comparisons (n=4 for control TAC group, n=8 for DKO TAC group, n=3 for others). *p<0.05, **p<0.01, ***p<0.001. m, EdU incorporation in diploid CM nuclei by flow cytometry after TAC. Representative images of flow cytometry are in Extended Data Fig. 5a-l. Comparisons by ANOVA with Tukey post-hoc test for pairwise comparisons (SalvCKO 1 week n=4; n=3 for all others). *p<0.05, **p<0.01. n, CM EdU incorporation using tissue sections. Representative images are in Extended Data Fig. 5o-z. Comparisons by ANOVA with Tukey post-hoc test for pairwise comparisons (n=3 for each). **p<0.01. o, Quantification of AurkB positive CMs. Representative images are in Extended Data Fig. 6a-d. Comparisons by ANOVA with Bonferroni's post-hoc test for pairwise comparisons (n=3 for each). *p<0.05, *** p<0.001. p, Quantification of nuclear localized Yap in CMs. Representative images are in Extended Data Fig. 6e-l. Groups compared by ANOVA with Bonferroni's post-hoc test for pairwise comparisons (n=3 for each). *p<0.05, **p<0.01, ***p<0.001. q, Active caspase 3–positive CMs quantification at 1 week and 2 weeks after TAC. Representative images are in Extended Data Fig. 6m-t. Comparisons by one-way analysis of variance with Tukey post-hoc test for pairwise comparisons (n=3 for each). *p<0.05, **p<0.01. r, s, EF and FS in TAC (n=10 for AAV-GFP, n=9 for AAV-Salv) and sham (n=8 for AAV-GFP, n=10 for AAV-Salv). Week 11 comparisons by ANOVA with Tukey post-hoc test for pairwise comparisons. *p<0.05, **p<0.01, ***p<0.001. t, Nuclear Yap quantification in CMs. Comparisons by Mann-Whitney U test (n=3 for each). *p<0.05. Representative images in Extended Data Fig. 8f-i. u, QRT-PCR of Yap target genes. Comparisons by Mann-Whitney U test (n=5 for each treatment). *p<0.05, **p<0.01. ns, nonsignificant. v, Fibrotic area quantification. Comparisons by Mann-Whitney U test (n=5 for each treatment). Representative images in Extended Data Fig. 8j, k.
Figure 4
Figure 4. Yap binding to the dystrophin glycoprotein complex
a, b, Immunoprecipitation (IP) of P12 control and Mdx mouse hearts for Yap (a) or DAG1 (b), with immunoblotting of indicated proteins (n=3 for each). c, d, IPfor FLAG(c) and DAG1 (d) from 6-week-old Yap5SA-expressing hearts with immunoblotting of indicated proteins (n=3 each). e-h, YAP subcellular localization C2C12 cells. Comparisons by ANOVA with Tukey post-hoc test for pairwise comparisons (n=3 for each). **p<0.01. i-p, Deconvolution epifluorescence (super-resolution) microscopic images of Yap subcellular localization in 11-week-old hearts; Cx43, Connexin 43. Yap localization in membrane (arrows) and intercalated discs (arrowhead). q, GST fusion protein binding assay for indicated proteins. DAG1ΔPPxY, DAG1 PPxY motif deletion. Gel source data (Supplementary Figure 1).

References

    1. Xin M, Olson EN, Bassel-Duby R. Mending broken hearts: cardiac development as a basis for adult heart regeneration and repair. Nature reviews Molecular cell biology. 2013;14:529–541. doi: 10.1038/nrm3619. - DOI - PMC - PubMed
    1. Porrello ER, et al. Transient regenerative potential of the neonatal mouse heart. Science (New York, N Y) 2011;331:1078–1080. doi: 10.1126/science.1200708. - DOI - PMC - PubMed
    1. Bergmann O, et al. Dynamics of Cell Generation and Turnover in the Human Heart. Cell. 2015;161:1566–1575. doi: 10.1016/j.cell.2015.05.026. - DOI - PubMed
    1. Heallen T, et al. Hippo signaling impedes adult heart regeneration. Development. 2013;140:4683–4690. - PMC - PubMed
    1. Heallen T, et al. Hippo pathway inhibits Wnt signaling to restrain cardiomyocyte proliferation and heart size. Science (New York, N Y) 2011;332:458–461. doi: 10.1126/science.1199010. - DOI - PMC - PubMed

Publication types

MeSH terms