Comparative Study
. 2017 Jul;49(7):1015-1024.
doi: 10.1038/ng.3891. Epub 2017 Jun 5.

Between-region genetic divergence reflects the mode and tempo of tumor evolution

Affiliations
Comparative Study

Between-region genetic divergence reflects the mode and tempo of tumor evolution

Ruping Sun et al. Nat Genet. 2017 Jul.

Abstract

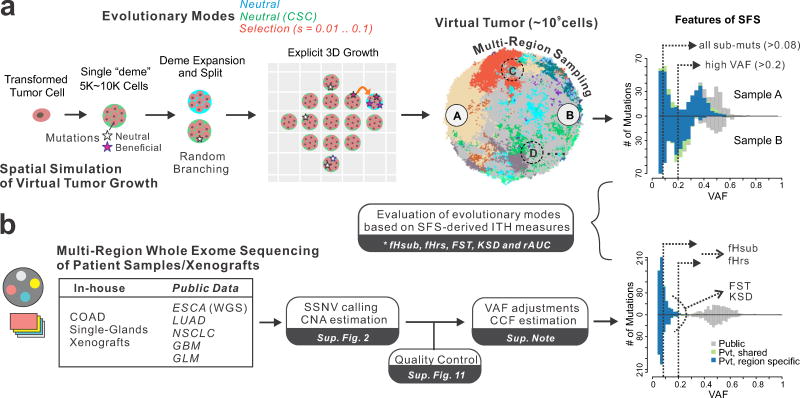
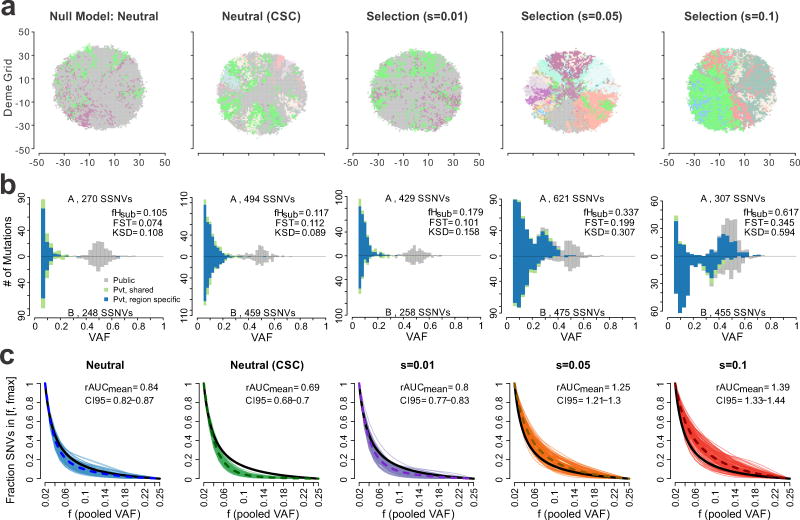
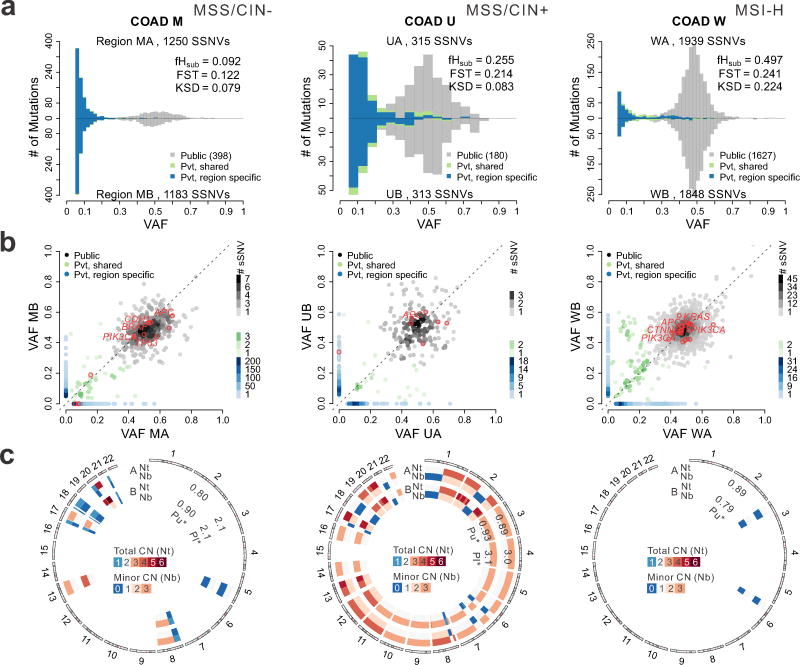
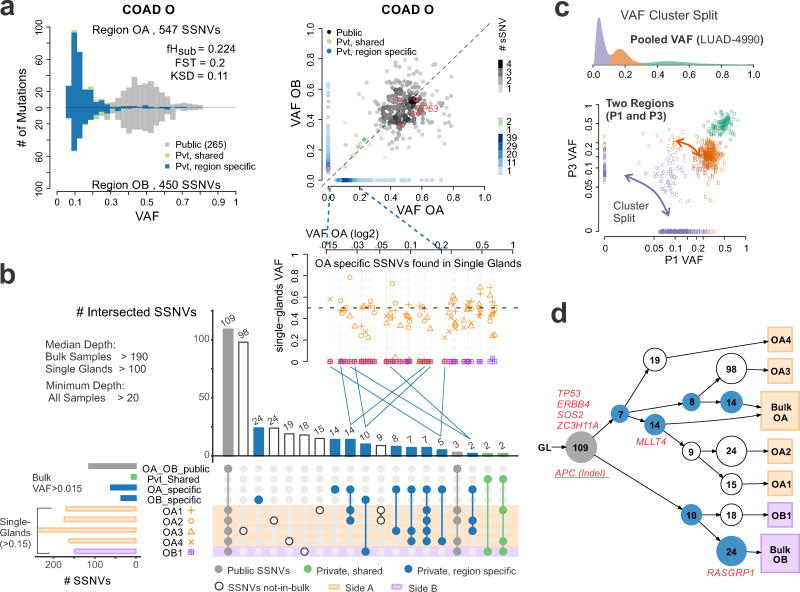
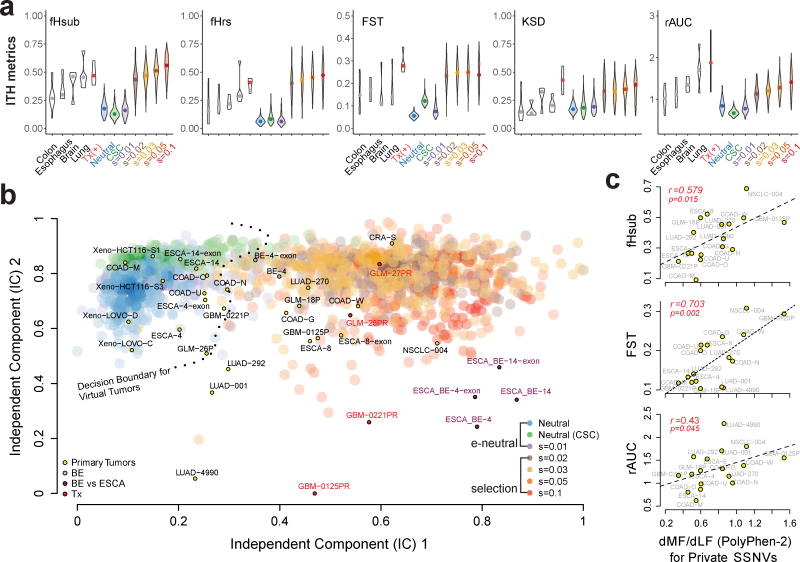
Given the implications of tumor dynamics for precision medicine, there is a need to systematically characterize the mode of evolution across diverse solid tumor types. In particular, methods to infer the role of natural selection within established human tumors are lacking. By simulating spatial tumor growth under different evolutionary modes and examining patterns of between-region subclonal genetic divergence from multiregion sequencing (MRS) data, we demonstrate that it is feasible to distinguish tumors driven by strong positive subclonal selection from those evolving neutrally or under weak selection, as the latter fail to dramatically alter subclonal composition. We developed a classifier based on measures of between-region subclonal genetic divergence and projected patient data into model space, finding different modes of evolution both within and between solid tumor types. Our findings have broad implications for how human tumors progress, how they accumulate intratumoral heterogeneity, and ultimately how they may be more effectively treated.


Conflict of interest statement

Competing interests

The authors declare no competing interests.

Figures

Figure 1
Figure 1. Overview of simulation framework and genomic data analysis pipeline
(a) Schematic overview of our agent-based computational framework to simulate 3D tumor growth (after transformation) under various modes of evolution, including neutral evolution (null model) and different levels of positive selection, followed by spatial sampling and multi-region sequencing of the virtual tumor. Tumor growth is simulated via the expansion of deme subpopulations within a defined 3D cubic lattice according to explicit rules dictated by spatial constraints, where cells within each deme are well-mixed and grow via a stochastic branching (birth-death) process (Methods and Supplementary Figure 1). By simulating the acquisition of random mutations (neutral or beneficial), tracing the genealogy of each cell as the tumor expands and subsequently virtually sampling and sequencing the ‘final’ virtual tumor as is done experimentally after resection or biopsy, it is possible to evaluate differences in the site frequency spectrum (SFS) under different modes of selection and sampling strategies. Five intra-tumor heterogeneity (ITH) metrics derived from the SFS were employed to distinguish between different evolutionary modes. Sub muts, subclonal mutations. (b) A unified sequencing analysis pipeline based on SSNV calling, copy number estimation, as well as stringent quality control was employed to obtain variant allele frequency (VAF) estimates adjusted for purity and local copy number for seven multi-region sequencing (MRS) datasets derived from patient samples across diverse tissue types. The ITH metrics were similarly computed in patient tumor samples and compared to those observed in virtual tumors under different evolutionary modes.
Figure 2
Figure 2. Characteristics of virtual tumors simulated under different modes of evolution
(a) A 2D visualization of a clone map in virtual tumors simulated under different modes of evolution, including the null neutral model (selection coefficient, s=0), a neutral model with cancer stem cell driven growth (neutral-CSC), and varying levels of selection (s=0.01, 0.05 and 0.1). Colors correspond to distinct clones with high VAF (> 0.4) in each deme subpopulation. (b) Representative pairwise SFS histograms derived from two spatially separated regions (labeled A and B) within the same tumor are shown for tumors simulated under different evolutionary modes. SSNVs were classified as Public (gray), Private (Pvt)-shared (green), or Private-region specific (blue) based on their presence in the virtual MRS data (Methods). The total number of SSNVs detected in each region, as well as three ITH metrics are indicated, namely fHsub, FST, KSD. (c) The cumulative SFS derived from virtual tumors (100 shown for each mode) was computed based on the pooled VAF for subclonal SSNVs for four regions in the frequency (f) range 0.02–0.25. Curves are Bezier smoothed. The dashed curve corresponds to the average and the black curve to a theoretical cumulative SFS under neutral exponential growth in a well-mixed population. For each mode, the mean ratio of the area under the cumulative SFS from the virtual tumors compared to that of the theoretical cumulative SFS (denoted rAUC) based on 100 virtual tumors is indicated as are the 95% bootstrap confidence intervals.
Figure 3
Figure 3. Colorectal tumors exhibit patterns of between-region genetic divergence consistent with effectively-neutral growth or selection
(a) Pairwise comparison of SFS histograms from each of three bi-sampled colon adenocarcinomas (COADs) representing the major molecular subgroups, including MSI-H (carcinoma W, right), MSS/CIN+ (carcinoma U, middle) and MSS/CIN- (carcinoma M, left). The pairwise histograms illustrate the number of SSNVs detected at a given VAF for the two tumor regions shown above and below the x-axis. SSNVs were classified as Public (gray), Private (Pvt)-shared (green), or Private-region specific (blue). The total number of SSNVs detected in each region and the fHsub, FST, and KSD values are indicated. (b) Scatterplots comparing SSNVs detected in each tumor region at a given VAF. The color of individual SSNV points correspond to that in Panel A and hues reflect the number of SSNVs in a square (0.02 on a side) centered on each SSNV, as depicted in the legend. Nonsilent SSNVs in predicted COAD driver genes are denoted by red circles with known drivers labeled. (c) Circos plot illustrating the predicted absolute total CN (Nt) and minor allele CN (Nb) for each tumor sample. Diploid segments are indicated in white for Nt (two copies) and Nb (one copy), while segments with copy number gain and loss are shown in red and blue, respectively, according to the scale bar. Tumor cell purity (Pu) as well as ploidy (Pl) estimates for each region are indicated on the corresponding concentric rings.
Figure 4
Figure 4. Single-gland WES reveals spatial constraints amongst subclonal mutations
(a) Pairwise histogram of the SFS and SSNV scatterplots from two regions of COAD-O (OA vs. OB). (b) Intersection of SSNVs found in bulk regions and single-glands. In the inset, the VAFs for single-gland vs. bulk sample OA (side-A) specific SSNVs are shown. OA specific SSNVs present in different sets of single-glands collapse to similar VAF values (<0.2) in the bulk sample (blue lines connecting the insert), indicating that mutational clusters do not necessarily guarantee clonal identity. (c) The pooled VAF (derived from four regions) is shown for for LUAD-4990, indicating a clonal cluster (centered at 0.5) and two subclonal clusters. In pairwise comparisons of the VAF from two regions (P3 and P1) the clonal VAF cluster persists, consistent with the mutations in this cluster being present in all cells, whereas the subclonal clusters partition into distinct clusters according to the two tumor regions. (d) Phylogenetic tree based on SSNV presence/absence in single glands and bulk samples constructed using LICHeE. The bulk sample and corresponding single-glands from the same tumor region share a common lineage relationship, potentially reflecting spatial constraints during tumor expansion. SSNVs in known and candidate driver genes are labeled. A truncal APC indel was also detected, but not used for tree construction.
Figure 5
Figure 5. The SFS reflects differential modes of evolution within and between tumors types
(a) Cumulative SFS based on the merged VAF for tumors derived from four tissue types (colon, esophageal, lung, brain) analyzed using the VAP (Methods). All samples were subject to WES with the exception of the ESCA/BE cases for which WGS was available. Each line corresponds to a Bezier smoothed curve of the cumulative SFS. Thick gray curves correspond to the theoretical cumulative SFS under neutral exponential growth in a well-mixed population, shown for reference. Dashed lines correspond to comparisons of tumor regions sampled at distinct stages of tumor progression in the same patient, e.g., Barrett’s esophagus (BE) versus esophageal carcinoma (ESCA), or treatment naïve primary tumor versus post-treatment (Tx) recurrent brain tumors, both of which represent positive controls for selection. (b) Pairwise SFS histograms from representative tumors of different tissue type are shown and depict the number of SSNVs detected at a given VAF for two regions, where SSNVs are grouped according to Public (gray), Private (Pvt)-Shared (green) and Private-Region specific (blue) mutations (as in Figure 3). Histogram bin widths were optimized based on the number of SSNVs (Methods). (c) Two-way density plots of SSNVs present in each region at a given VAF are shown for two tumors. Non-silent SSNVs in known and candidate driver genes are labeled. The color scale reflects the relative density of mutations.
Figure 6
Figure 6. Projection of patient samples onto distinct evolutionary modes
(a) Violin plots for each of five ITH metrics, namely, fHsub, fHrs, Fst, KSD, and rAUC. Colored violin plots show the virtual tumors simulated under different evolutionary modes, whereas the white plots correspond to patient tumor data. Paired pre-treatment primary and post-treatment recurrent brain tumors are denoted by “Tx” and serve as a positive control for selection. (b) Independent component analysis (ICA) of virtual and patient tumors based on the five ITH metrics. The independent components separate virtual tumors simulated under effectively (e) neutral growth (neutral, neutral-CSC and s=0.01) versus positive selection (s≥0.02) where the decision boundary for a SVM trained on two independent components (IC) based on the virtual tumors (e-neutral versus positive selection models) is indicated by the dashed line. Large transparent colored circles represent values from virtual tumors under different models (200 tumors from each of the seven modes are shown). Small circles indicate patient tumors labeled by their corresponding sample ID and color-coded according to the type of sample. COAD: colorectal adenocarcinoma; CRA: colorectal adenoma; ESCA: esophageal adenocarcinoma; BE: Barrett’s esophagus; LUAD: lung adenocarcinoma; NSCLC: non-small-cell lung cancer; GLM: glioma; GBM: glioblastoma; Xeno: COAD cell line xenografts. (c) The ratio of private SSNVs at more functional (MF) relative to less functional (LF) sites (dMF/dLF) based on PolyPhen2 was calculated for each of the primary tumors in order to evaluate the correlation with various ITH metrics.

References

    1. Nordling CO. A new theory on cancer-inducing mechanism. Br J Cancer. 1953;7:68–72. - PMC - PubMed
    1. Armitage P, Doll R. The age distribution of cancer and a multi-stage theory of carcinogenesis. Br J Cancer. 1954;8:1–12. - PMC - PubMed
    1. Nowell PC. The clonal evolution of tumor cell populations. Science. 1976;194:23–8. - PubMed
    1. Cairns J. Mutation selection and the natural history of cancer. Nature. 1975;255:197–200. - PubMed
    1. Fearon ER, Vogelstein B. A genetic model for colorectal tumorigenesis. Cell. 1990;61:759–67. - PubMed

Publication types

MeSH terms

LinkOut - more resources