. 2017 Jun 5;13(6):e1005590.
doi: 10.1371/journal.pcbi.1005590. eCollection 2017 Jun.

Dynamic metabolic modeling of heterotrophic and mixotrophic microalgal growth on fermentative wastes

Affiliations

Dynamic metabolic modeling of heterotrophic and mixotrophic microalgal growth on fermentative wastes

Caroline Baroukh et al. PLoS Comput Biol. .

Abstract

Microalgae are promising microorganisms for the production of numerous molecules of interest, such as pigments, proteins or triglycerides that can be turned into biofuels. Heterotrophic or mixotrophic growth on fermentative wastes represents an interesting approach to achieving higher biomass concentrations, while reducing cost and improving the environmental footprint. Fermentative wastes generally consist of a blend of diverse molecules and it is thus crucial to understand microalgal metabolism in such conditions, where switching between substrates might occur. Metabolic modeling has proven to be an efficient tool for understanding metabolism and guiding the optimization of biomass or target molecule production. Here, we focused on the metabolism of Chlorella sorokiniana growing heterotrophically and mixotrophically on acetate and butyrate. The metabolism was represented by 172 metabolic reactions. The DRUM modeling framework with a mildly relaxed quasi-steady-state assumption was used to account for the switching between substrates and the presence of light. Nine experiments were used to calibrate the model and nine experiments for the validation. The model efficiently predicted the experimental data, including the transient behavior during heterotrophic, autotrophic, mixotrophic and diauxic growth. It shows that an accurate model of metabolism can now be constructed, even in dynamic conditions, with the presence of several carbon substrates. It also opens new perspectives for the heterotrophic and mixotrophic use of microalgae, especially for biofuel production from wastes.


Conflict of interest statement

The authors have declared that no competing interests exist.

Figures

Fig 1
Fig 1. Central carbon metabolic network of a unicellular heterotrophic microalga decomposed into three sub-networks.
Central carbon metabolic network is composed of photosynthesis, the glyoxysome, citric acid cycle, glycolysis, carbohydrate synthesis, pentose phosphate pathway, lipid synthesis, oxidative phosphorylation, protein, DNA, RNA, chlorophyll and biomass synthesis. During photosynthesis, inorganic carbon (CO2) is assimilated using light energy to produce a 3-carbon sugar glyceraldehyde 3-phosphate (GAP). In the glyoxysome, fatty acids (including acetate and butyrate) are degraded to Acetyl-CoA, which is then transformed to succinate (SUC) thanks to the glyoxylate cycle. SUC and GAP are then used as primary precursors to produce precursor metabolites and energy via the Tricarboxylic Acid (TCA) cycle for protein, DNA, RNA, carbohydrate and lipid synthesis.
Fig 2
Fig 2. Comparison between the model and experimental data for Chlorella sorokiniana heterotrophic growth on acetate or butyrate.
Simulations are represented by full lines (conditions used for calibration) or dashed lines (conditions used for validation). Experimental results are represented by large dots, triangles or diamonds. Red: 1 gC.L-1; blue: 0.5 gC.L-1; purple: 0.3 gC.L-1; yellow: 0.25 gC.L-1; green: 0.1 gC.L-1. A. Acetate concentration (gC.L-1) for acetate growth. B. Biomass concentration (g.L-1) in acetate growing conditions. C. Butyrate concentration (gC.L-1) for butyrate growth. D. Biomass concentration (g.L-1) in butyrate growing conditions. Thanks to the fitting quality, each of the experimental triplicates could be appropriately fit accounting for the slight variations in the initial conditions. Only one of the triplicates per experimental condition is represented here, but the simulations for all triplicates are available in S4 Fig.
Fig 3
Fig 3. Comparison between the model and experimental data for Chlorella sorokiniana heterotrophic growth mixtures of acetate and butyrate.
Simulations are represented by full lines (conditions used for calibration) or dashed lines (conditions used for validation). Experimental results are represented by large dots, triangles or diamonds. Red: acetate (gC.L-1); blue: butyrate (gC.L-1); yellow: biomass (g.L-1). A. Growth on 0.25 gC.L-1 acetate and 0.25 gC.L-1 butyrate. B. Growth on 0.25 gC.L-1 acetate and 0.5 gC.L-1 butyrate. C. Growth on 0.4 gC.L-1 acetate and 0.1 gC.L-1 butyrate. D. Growth on 0.5 gC.L-1 acetate and 0.9 gC.L-1 butyrate. E. Growth on 0.9 gC.L-1 acetate and 0.1 gC.L-1 butyrate. Only one of the experimental triplicates is represented here. The simulations for all triplicates are available in S5 Fig.
Fig 4
Fig 4. Comparison between the model and experimental data for Chlorella sorokiniana mixotrophic and autotrophic growth.
Simulations are represented by full lines (conditions used for calibration). Experimental results are represented by large dots, diamonds or triangles. Red: acetate; blue: butyrate; yellow: biomass. A. Autotrophic growth. B. Mixotrophic growth with 0.3 gC.L-1 acetate C. Mixotrophic growth with 0.3 gC.L-1 butyrate. D. Mixotrophic growth with 0.3 gC.L-1 acetate and 0.3 gC.L-1 butyrate. Only one of the experimental triplicates is represented here. The simulations for all triplicates are available in S7 Fig.
Fig 5
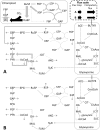
Fig 5. Flux maps for mixotrophic and heterotrophic growth of Chlorella sorokiniana on butyrate.
Fluxes are normalized by unit of biomass. Dashed arrows indicate fluxes related to biomass formation. Metabolic fluxes vary greatly according to substrates and growth modes. The scale for converting metabolic fluxes into arrows width is presented for each case. A. Mixotrophic growth on 0.3 g.L-1 butyrate. Flux maps computed at time = 5.0 days. B. Heterotrophic growth on 0.1g.L-1 butyrate. Flux maps computed at time = 8.1 days. Flux maps on other substrates are available in S9 Fig.
Fig 6
Fig 6. Disinhibition of butyrate by addition of acetate, light and a mix of acetate/butyrate due to the biomass effect.
A larger biomass implies a decrease in butyrate inhibition on growth. Biomass can be increased by addition of acetate (B), light (C) and/or a mix of acetate and butyrate (D). Red: acetate; blue: butyrate; yellow: biomass. A. Normal conditions, without any additions. B. Addition of acetate (0.5 gC.L-1, volume half of culture volume) in the medium at day 5. C: Addition of light at day 5. Full lines: incident light intensity of 136 μE.m-2.s-1. Dashed line: incident light intensity of 272 μE.m-2.s-1. D. Addition of a mix of acetate (0.25 gC.L-1) and butyrate (0.45 gC.L-1) (volume half of culture volume) representative of a fermentative waste (4). Full lines: without light. Dashed lines: with light.

References

    1. Perez-Garcia O, Escalante FME, de-Bashan LE, Bashan Y. Water Res. Elsevier Ltd; 2011;45: 11–36. - PubMed
    1. Mata TM, Martins AA, Caetano NS. Renew Sustain Energy Rev. 2010;14: 217–232.
    1. Doucha J, Lívanský K. J Appl Phycol. 2011;24: 35–43.
    1. Rafrafi Y, Trably E, Latrille E, Hamelin J, Meynial-Salles I, Benomar S, et al. Int J Hydrogen Energy. 2013;38: 4975–4985.
    1. Turon V, Baroukh C, Trably E, Latrille E, Fouilland E, Steyer J-P. Bioresour Technol. 2015;175: 342–349. 10.1016/j.biortech.2014.10.114 - DOI - PubMed