

JDINAC: joint density-based non-parametric differential interaction network analysis and classification using high-dimensional sparse omics data
- PMID: 28582486
- PMCID: PMC5870609
- DOI: 10.1093/bioinformatics/btx360
JDINAC: joint density-based non-parametric differential interaction network analysis and classification using high-dimensional sparse omics data
Abstract
Motivation: A complex disease is usually driven by a number of genes interwoven into networks, rather than a single gene product. Network comparison or differential network analysis has become an important means of revealing the underlying mechanism of pathogenesis and identifying clinical biomarkers for disease classification. Most studies, however, are limited to network correlations that mainly capture the linear relationship among genes, or rely on the assumption of a parametric probability distribution of gene measurements. They are restrictive in real application.
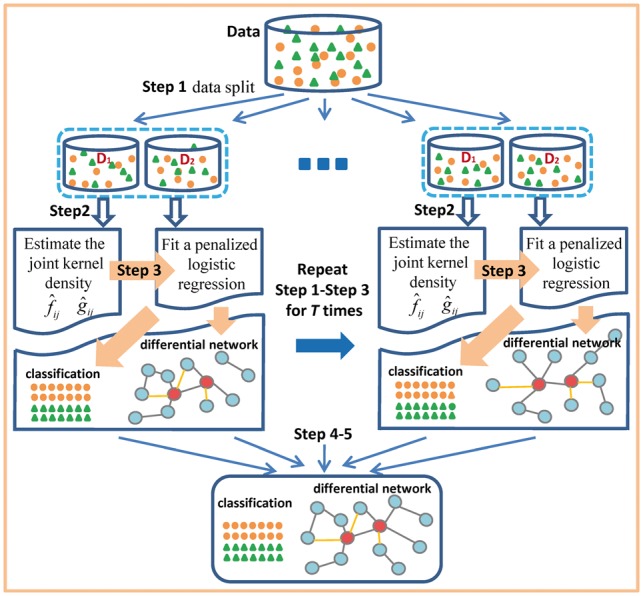
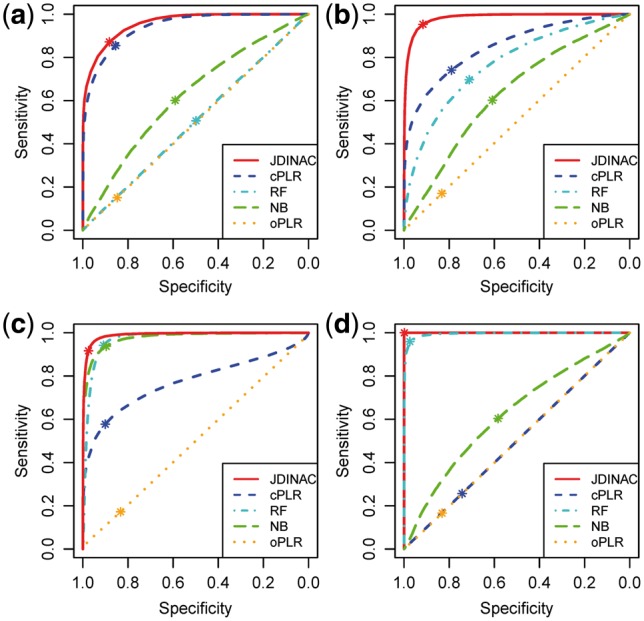
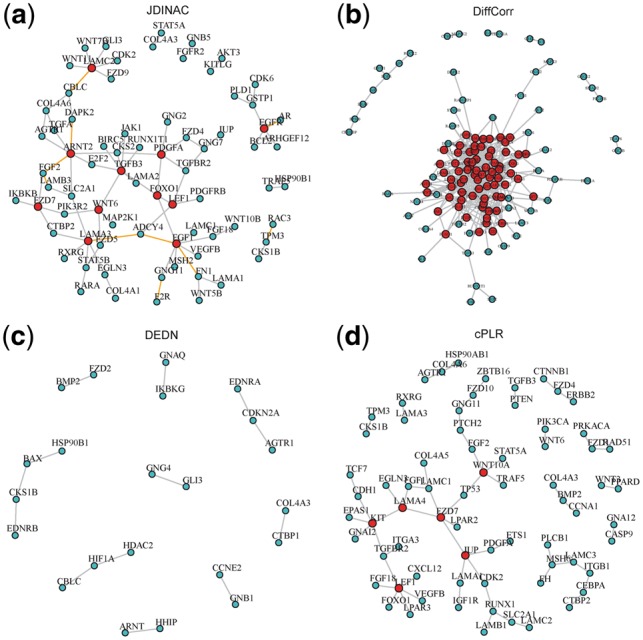
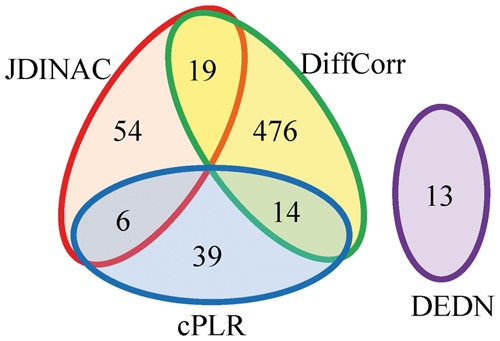
Results: We propose a new Joint density based non-parametric Differential Interaction Network Analysis and Classification (JDINAC) method to identify differential interaction patterns of network activation between two groups. At the same time, JDINAC uses the network biomarkers to build a classification model. The novelty of JDINAC lies in its potential to capture non-linear relations between molecular interactions using high-dimensional sparse data as well as to adjust confounding factors, without the need of the assumption of a parametric probability distribution of gene measurements. Simulation studies demonstrate that JDINAC provides more accurate differential network estimation and lower classification error than that achieved by other state-of-the-art methods. We apply JDINAC to a Breast Invasive Carcinoma dataset, which includes 114 patients who have both tumor and matched normal samples. The hub genes and differential interaction patterns identified were consistent with existing experimental studies. Furthermore, JDINAC discriminated the tumor and normal sample with high accuracy by virtue of the identified biomarkers. JDINAC provides a general framework for feature selection and classification using high-dimensional sparse omics data.
Availability and implementation: R scripts available at https://github.com/jijiadong/JDINAC.
Contact: lxie@iscb.org.
Supplementary information: Supplementary data are available at Bioinformatics online.
© The Author (2017). Published by Oxford University Press. All rights reserved. For Permissions, please email: journals.permissions@oup.com
Figures
Similar articles
-
A new insight into underlying disease mechanism through semi-parametric latent differential network model.BMC Bioinformatics. 2018 Dec 28;19(Suppl 17):493. doi: 10.1186/s12859-018-2461-2. BMC Bioinformatics. 2018. PMID: 30591011 Free PMC article.
-
A Machine Learning Method for Identifying Critical Interactions Between Gene Pairs in Alzheimer's Disease Prediction.Front Neurol. 2019 Oct 31;10:1162. doi: 10.3389/fneur.2019.01162. eCollection 2019. Front Neurol. 2019. PMID: 31736866 Free PMC article.
-
Using machine learning to identify gene interaction networks associated with breast cancer.BMC Cancer. 2022 Oct 17;22(1):1070. doi: 10.1186/s12885-022-10170-w. BMC Cancer. 2022. PMID: 36253742 Free PMC article.
-
Incorporating prior information into differential network analysis using non-paranormal graphical models.Bioinformatics. 2017 Aug 15;33(16):2436-2445. doi: 10.1093/bioinformatics/btx208. Bioinformatics. 2017. PMID: 28407042
-
Differential network analysis by simultaneously considering changes in gene interactions and gene expression.Bioinformatics. 2021 Dec 7;37(23):4414-4423. doi: 10.1093/bioinformatics/btab502. Bioinformatics. 2021. PMID: 34245246
Cited by
-
Systems Bioinformatics: increasing precision of computational diagnostics and therapeutics through network-based approaches.Brief Bioinform. 2019 May 21;20(3):806-824. doi: 10.1093/bib/bbx151. Brief Bioinform. 2019. PMID: 29186305 Free PMC article. Review.
-
Computational Methods Summarizing Mutational Patterns in Cancer: Promise and Limitations for Clinical Applications.Cancers (Basel). 2023 Mar 24;15(7):1958. doi: 10.3390/cancers15071958. Cancers (Basel). 2023. PMID: 37046619 Free PMC article. Review.
-
Machine learning to identify pairwise interactions between specific IgE antibodies and their association with asthma: A cross-sectional analysis within a population-based birth cohort.PLoS Med. 2018 Nov 13;15(11):e1002691. doi: 10.1371/journal.pmed.1002691. eCollection 2018 Nov. PLoS Med. 2018. PMID: 30422985 Free PMC article.
-
Brain connectivity alteration detection via matrix-variate differential network model.Biometrics. 2021 Dec;77(4):1409-1421. doi: 10.1111/biom.13359. Epub 2020 Sep 1. Biometrics. 2021. PMID: 32829503 Free PMC article.
-
A new insight into underlying disease mechanism through semi-parametric latent differential network model.BMC Bioinformatics. 2018 Dec 28;19(Suppl 17):493. doi: 10.1186/s12859-018-2461-2. BMC Bioinformatics. 2018. PMID: 30591011 Free PMC article.
References
-
- Breiman L. (2001) Random forests. Mach Learn., 45, 5–32.
MeSH terms
Grants and funding
LinkOut - more resources
Full Text Sources
Other Literature Sources
Medical
