. 2017 Jun 5;18(1):442.
doi: 10.1186/s12864-017-3827-y.

A comprehensive assessment of RNA-seq protocols for degraded and low-quantity samples

Affiliations

A comprehensive assessment of RNA-seq protocols for degraded and low-quantity samples

Sven Schuierer et al. BMC Genomics. .

Abstract

Background: RNA-sequencing (RNA-seq) has emerged as one of the most sensitive tool for gene expression analysis. Among the library preparation methods available, the standard poly(A) + enrichment provides a comprehensive, detailed, and accurate view of polyadenylated RNAs. However, on samples of suboptimal quality ribosomal RNA depletion and exon capture methods have recently been reported as better alternatives.

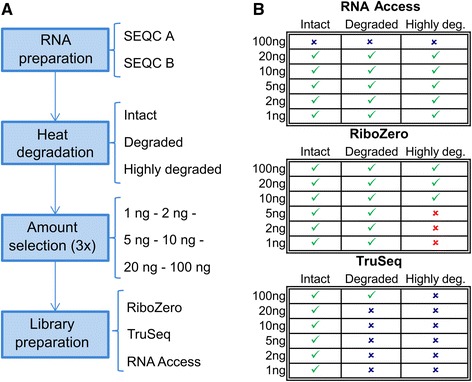
Methods: We compared for the first time three commercial Illumina library preparation kits (TruSeq Stranded mRNA, TruSeq Ribo-Zero rRNA Removal, and TruSeq RNA Access) as representatives of these three different approaches using well-established human reference RNA samples from the MAQC/SEQC consortium on a wide range of input amounts (from 100 ng down to 1 ng) and degradation levels (intact, degraded, and highly degraded).

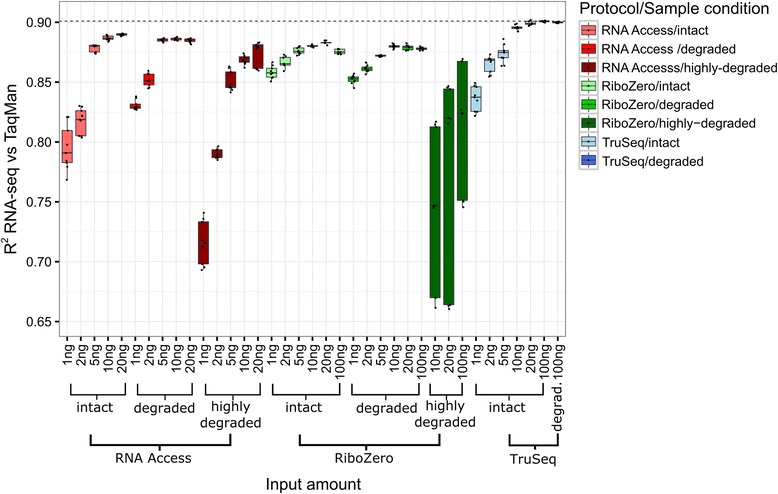
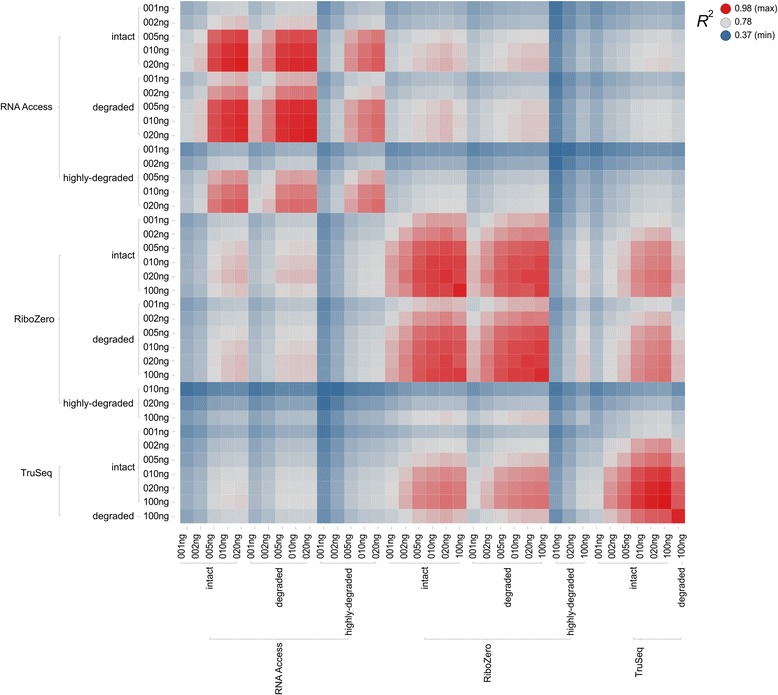
Results: We assessed the accuracy of the generated expression values by comparison to gold standard TaqMan qPCR measurements and gained unprecedented insight into the limits of applicability in terms of input quantity and sample quality of each protocol. We found that each protocol generates highly reproducible results (R 2 > 0.92) on intact RNA samples down to input amounts of 10 ng. For degraded RNA samples, Ribo-Zero showed clear performance advantages over the other two protocols as it generated more accurate and better reproducible gene expression results even at very low input amounts such as 1 ng and 2 ng. For highly degraded RNA samples, RNA Access performed best generating reliable data down to 5 ng input.

Conclusions: We found that the ribosomal RNA depletion protocol from Illumina works very well at amounts far below recommendation and over a good range of intact and degraded material. We also infer that the exome-capture protocol (RNA Access, Illumina) performs better than other methods on highly degraded and low amount samples.

Keywords: Benchmarking; Differential expression; Expression profiling; Low quality; Low quantity; RNA-sequencing.


Figures

Fig. 1
Fig. 1
Generation of sequencing libraries and experimental design. a Schematic representation of the workflow to generate the sequencing libraries. RNA of the SEQC samples A and B is heat degraded to obtain three distinct RNA input qualities. Several input amounts between 1 ng and 100 ng are selected from the degraded RNA in triplicate and used for the library preparation with one of the three protocols (TruSeq, Ribo-Zero, or RNA Access). b Overview of the combinations of degradation stage, input amount, and library preparation protocol considered in this study. A green tick indicates a combination that was sequenced, a blue cross indicates a combination for which we decided not to generate a library either because the input amount was higher than the maximum recommended input amount (for RNA Access) or because previously published studies suggested inferior performance on degraded samples (for TruSeq), and a red cross indicates a combination for which no library was generated because libraries with higher input amounts already performed poorly
Fig. 2
Fig. 2
Bargraph of the alignment statistics for the SEQC-A sample and all three protocols. Each bar represents the averaged values across the three technical replicates per condition. The percentage of total aligned reads is represented by the height of the bar, and the percentage of reads aligning to exons is in red, introns in blue, and intergenic regions in green. The alignment statistics graph for the SEQC-B sample can be found in Additional file 1: Figure S4
Fig. 3
Fig. 3
Normalized transcript coverage plot. Plot of the normalized average coverage of the 1000 most expressed transcripts for each sample condition as created by Picard
Fig. 4
Fig. 4
Bargraph of the number of detected genes across different protocols, degradation stages, and input amounts. The bar segments with the number of detected genes are listed by simplified Ensembl “Gene type” categories and the average number of detected genes per protocol is indicated by a black line. A gene is considered “expressed” if it has a FPKM value of at least 0.3 in one of the three technical replicates of at least one of the two samples (SEQC-A or SEQC-B)
Fig. 5
Fig. 5
Venn diagram of the protein coding genes detected by each of the three protocols. Venn diagram of the protein coding genes detected by each of the three protocols on intact samples at the recommended input amounts (10 ng for RNA Access and 100 ng for Ribo-Zero and TruSeq). A gene is considered “expressed” if it has a FPKM value of at least 0.3 in one of the three technical replicates of at least one of the two samples (SEQC-A or SEQC-B)
Fig. 6
Fig. 6
Boxplot of the coefficients of determination (R 2 values) of the RNA-seq log fold change values vs TaqMan qPCR measurements. The boxes are coloured by protocol: red for RNA Access, green for Ribo-Zero, and blue for TruSeq. Darker shades indicate boxes for samples to which a more severe degradation protocol was applied
Fig. 7
Fig. 7
Heat map of the coefficients of determination (R 2 values) of the log fold change values of the pairwise comparison of all protocols. Each colored box represents the coefficient of determination (R 2 value) between two conditions which are given by the labels on the x and y axes. The R 2 value is color-coded on a scale where blue represents the lowest, grey the median, and red the highest observed value

References

    1. Mortazavi A, Williams BA, McCue K, Schaeffer L, Wold B. Mapping and quantifying mammalian transcriptomes by RNA-Seq. Nat Meth. 2008;5(7):621–628. doi: 10.1038/nmeth.1226. - DOI - PubMed
    1. Sultan M, Schulz MH, Richard H, Magen A, Klingenhoff A, Scherf M, et al. A global view of Gene activity and alternative splicing by deep sequencing of the human Transcriptome. Science. 2008;321(5891):956–960. doi: 10.1126/science.1160342. - DOI - PubMed
    1. Wang Z, Gerstein M, Snyder M. RNA-Seq: a revolutionary tool for transcriptomics. Nat Rev Genet. 2009;10(1):57–63. doi: 10.1038/nrg2484. - DOI - PMC - PubMed
    1. Melé M, Ferreira PG, Reverter F, DeLuca DS, Monlong J, Sammeth M, et al. The human transcriptome across tissues and individuals. Science. 2015;348(6235):660–665. doi: 10.1126/science.aaa0355. - DOI - PMC - PubMed
    1. Shin H, Shannon CP, Fishbane N, Ruan J, Zhou M, Balshaw R, et al. Variation in RNA-Seq Transcriptome profiles of peripheral whole blood from healthy individuals with and without Globin depletion. PLoS One. 2014;9(3):e91041. doi: 10.1371/journal.pone.0091041. - DOI - PMC - PubMed