Single-cell study links metabolism with nutrient signaling and reveals sources of variability
- PMID: 28583118
- PMCID: PMC5460408
- DOI: 10.1186/s12918-017-0435-z
Single-cell study links metabolism with nutrient signaling and reveals sources of variability
Abstract
Background: The yeast AMPK/SNF1 pathway is best known for its role in glucose de/repression. When glucose becomes limited, the Snf1 kinase is activated and phosphorylates the transcriptional repressor Mig1, which is then exported from the nucleus. The exact mechanism how the Snf1-Mig1 pathway is regulated is not entirely elucidated.
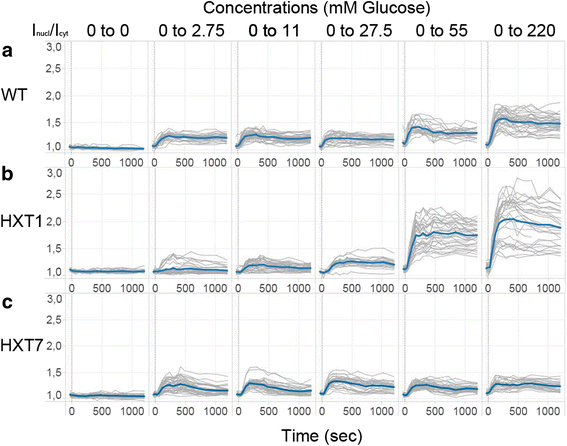
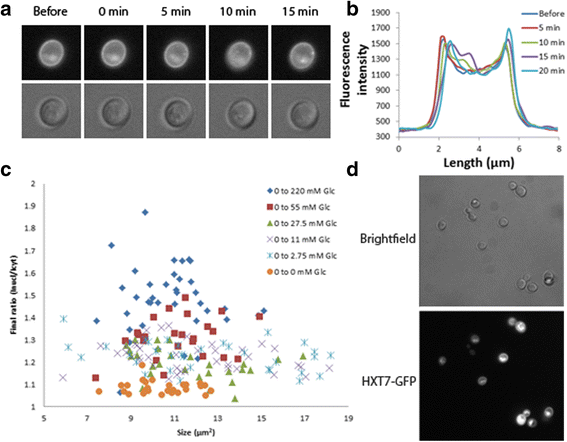
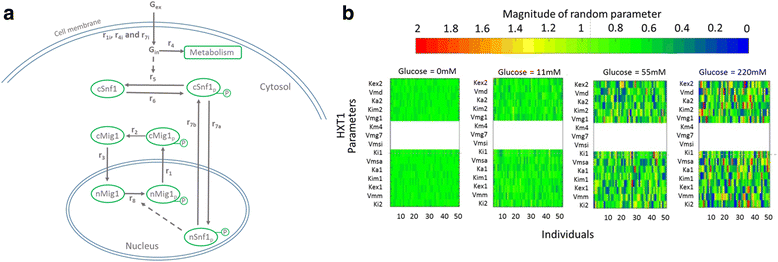
Results: Glucose uptake through the low affinity transporter Hxt1 results in nuclear accumulation of Mig1 in response to all glucose concentrations upshift, however with increasing glucose concentration the nuclear localization of Mig1 is more intense. Strains expressing Hxt7 display a constant response to all glucose concentration upshifts. We show that differences in amount of hexose transporter molecules in the cell could cause cell-to-cell variability in the Mig1-Snf1 system. We further apply mathematical modelling to our data, both general deterministic and a nonlinear mixed effect model. Our model suggests a presently unrecognized regulatory step of the Snf1-Mig1 pathway at the level of Mig1 dephosphorylation. Model predictions point to parameters involved in the transport of Mig1 in and out of the nucleus as a majorsource of cell to cell variability.
Conclusions: With this modelling approach we have been able to suggest steps that contribute to the cell-to-cell variability. Our data indicate a close link between the glucose uptake rate, which determines the glycolytic rate, and the activity of the Snf1/Mig1 system. This study hence establishes a close relation between metabolism and signalling.
Keywords: Dynamical modelling; Glucose uptake; Microfluidics systems; Non-linear mixed effect modelling.
Figures


Similar articles
-
Glucose de-repression by yeast AMP-activated protein kinase SNF1 is controlled via at least two independent steps.FEBS J. 2014 Apr;281(7):1901-17. doi: 10.1111/febs.12753. Epub 2014 Mar 4. FEBS J. 2014. PMID: 24529170
-
Yeast AMP-activated protein kinase monitors glucose concentration changes and absolute glucose levels.J Biol Chem. 2014 May 2;289(18):12863-75. doi: 10.1074/jbc.M114.547976. Epub 2014 Mar 13. J Biol Chem. 2014. PMID: 24627493 Free PMC article.
-
The nuclear exportin Msn5 is required for nuclear export of the Mig1 glucose repressor of Saccharomyces cerevisiae.Curr Biol. 1999 Nov 4;9(21):1231-41. doi: 10.1016/s0960-9822(99)80503-x. Curr Biol. 1999. PMID: 10556086
-
Glucose repression in yeast.Curr Opin Microbiol. 1999 Apr;2(2):202-7. doi: 10.1016/S1369-5274(99)80035-6. Curr Opin Microbiol. 1999. PMID: 10322167 Review.
-
Transcriptional control of nonfermentative metabolism in the yeast Saccharomyces cerevisiae.Curr Genet. 2003 Jun;43(3):139-60. doi: 10.1007/s00294-003-0381-8. Epub 2003 Apr 25. Curr Genet. 2003. PMID: 12715202 Review.
Cited by
-
Recent advances in microfluidic platforms for single-cell analysis in cancer biology, diagnosis and therapy.Trends Analyt Chem. 2019 Aug;117:13-26. doi: 10.1016/j.trac.2019.05.010. Epub 2019 May 17. Trends Analyt Chem. 2019. PMID: 32831435 Free PMC article.
-
A novel yeast hybrid modeling framework integrating Boolean and enzyme-constrained networks enables exploration of the interplay between signaling and metabolism.PLoS Comput Biol. 2021 Apr 9;17(4):e1008891. doi: 10.1371/journal.pcbi.1008891. eCollection 2021 Apr. PLoS Comput Biol. 2021. PMID: 33836000 Free PMC article.
-
Exploring carbon source related localization and phosphorylation in the Snf1/Mig1 network using population and single cell-based approaches.Microb Cell. 2024 May 16;11:143-154. doi: 10.15698/mic2024.05.822. eCollection 2024. Microb Cell. 2024. PMID: 38756204 Free PMC article.
-
D-Xylose Sensing in Saccharomyces cerevisiae: Insights from D-Glucose Signaling and Native D-Xylose Utilizers.Int J Mol Sci. 2021 Nov 17;22(22):12410. doi: 10.3390/ijms222212410. Int J Mol Sci. 2021. PMID: 34830296 Free PMC article. Review.
-
AMPK Phosphorylation Is Controlled by Glucose Transport Rate in a PKA-Independent Manner.Int J Mol Sci. 2021 Aug 31;22(17):9483. doi: 10.3390/ijms22179483. Int J Mol Sci. 2021. PMID: 34502388 Free PMC article.
References
MeSH terms
Substances
LinkOut - more resources
Full Text Sources
Other Literature Sources
Molecular Biology Databases

