. 2017 Jun 28;37(26):6314-6330.
doi: 10.1523/JNEUROSCI.0602-17.2017. Epub 2017 Jun 5.

Noise Trauma-Induced Behavioral Gap Detection Deficits Correlate with Reorganization of Excitatory and Inhibitory Local Circuits in the Inferior Colliculus and Are Prevented by Acoustic Enrichment

Affiliations

Noise Trauma-Induced Behavioral Gap Detection Deficits Correlate with Reorganization of Excitatory and Inhibitory Local Circuits in the Inferior Colliculus and Are Prevented by Acoustic Enrichment

Joshua J Sturm et al. J Neurosci. .

Abstract

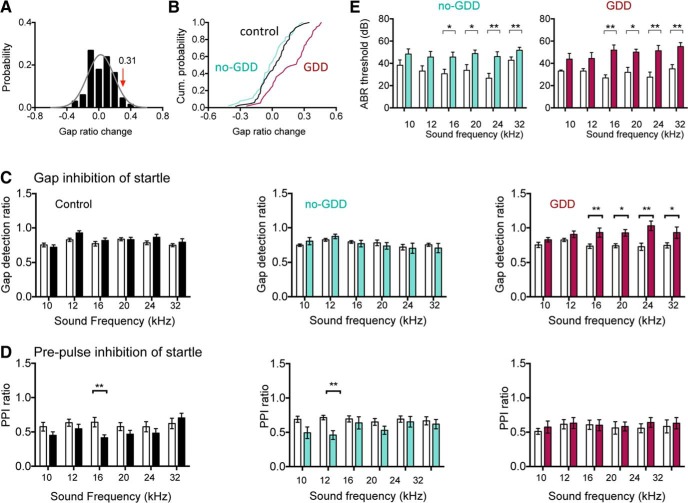
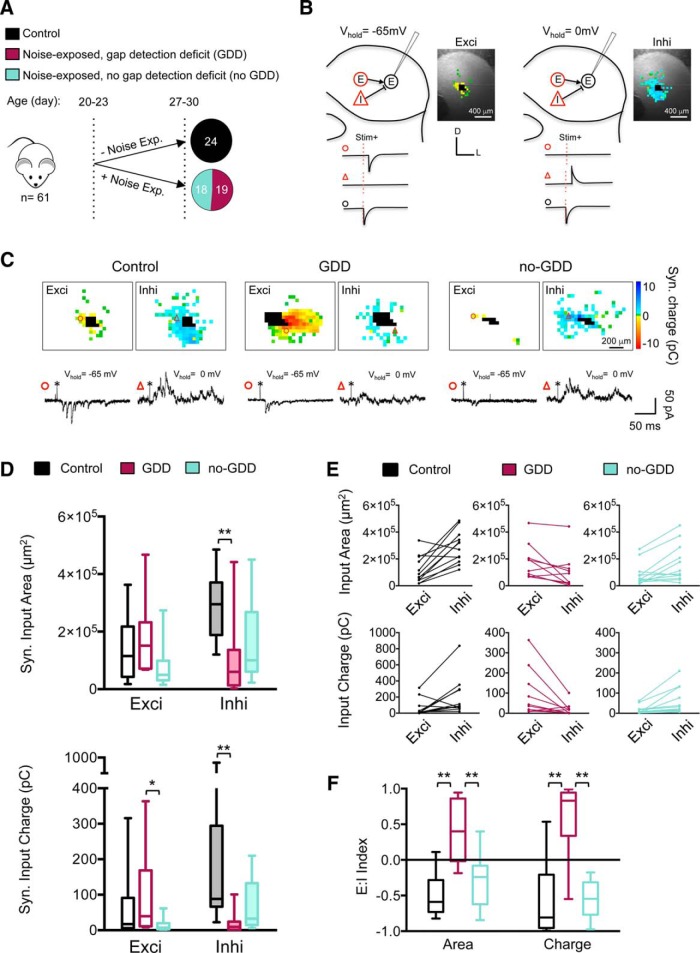
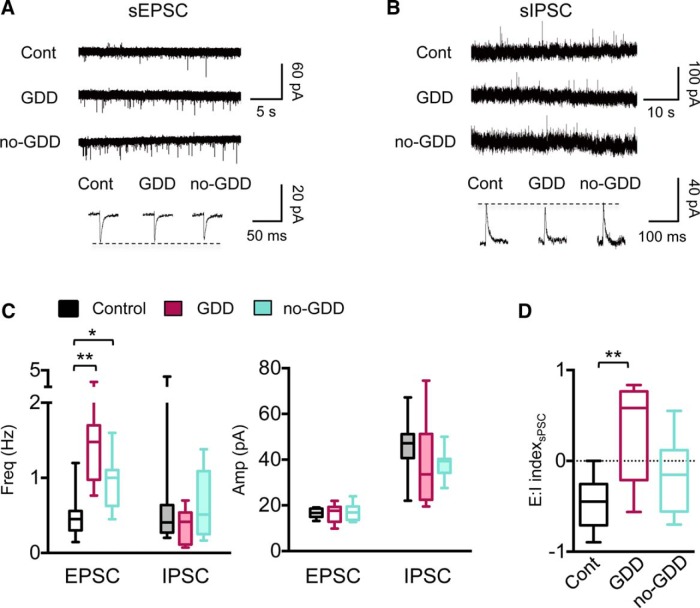
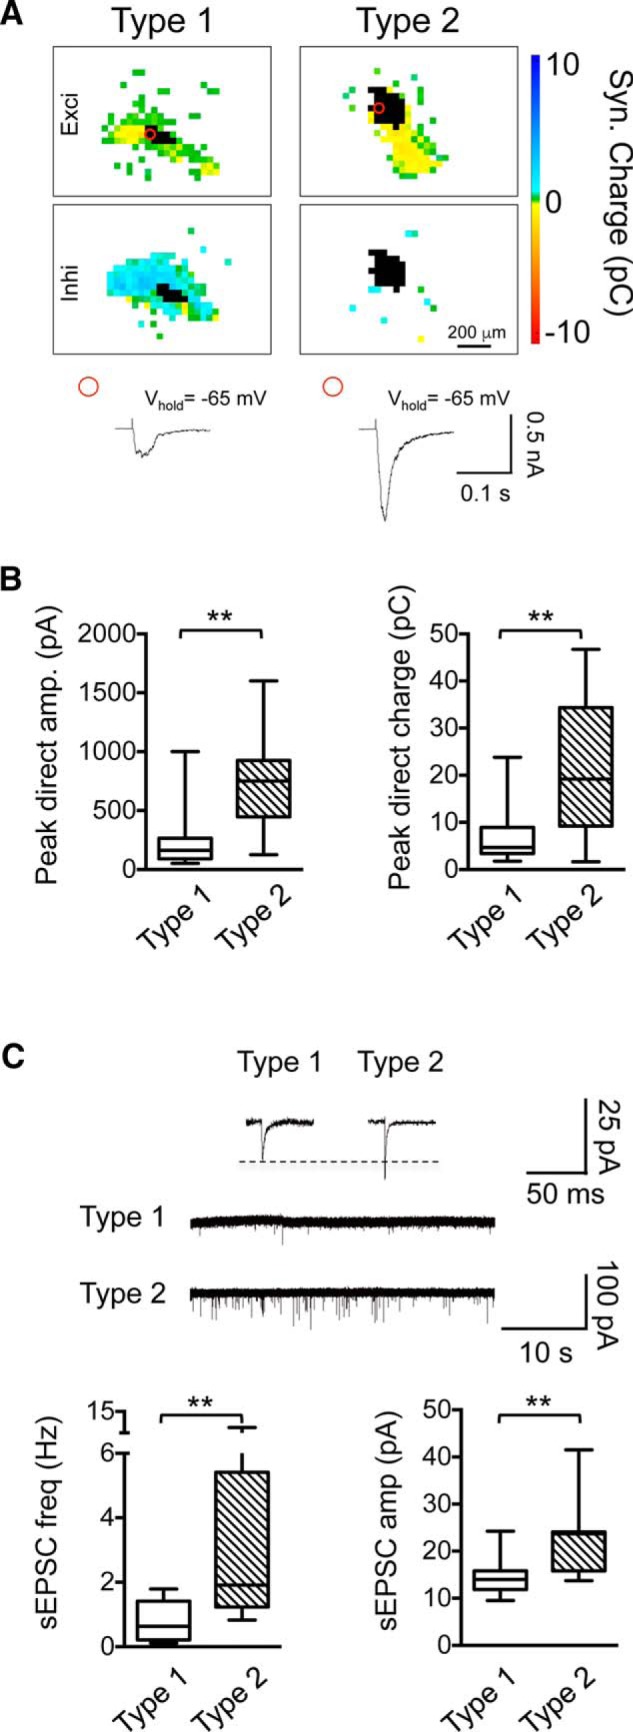
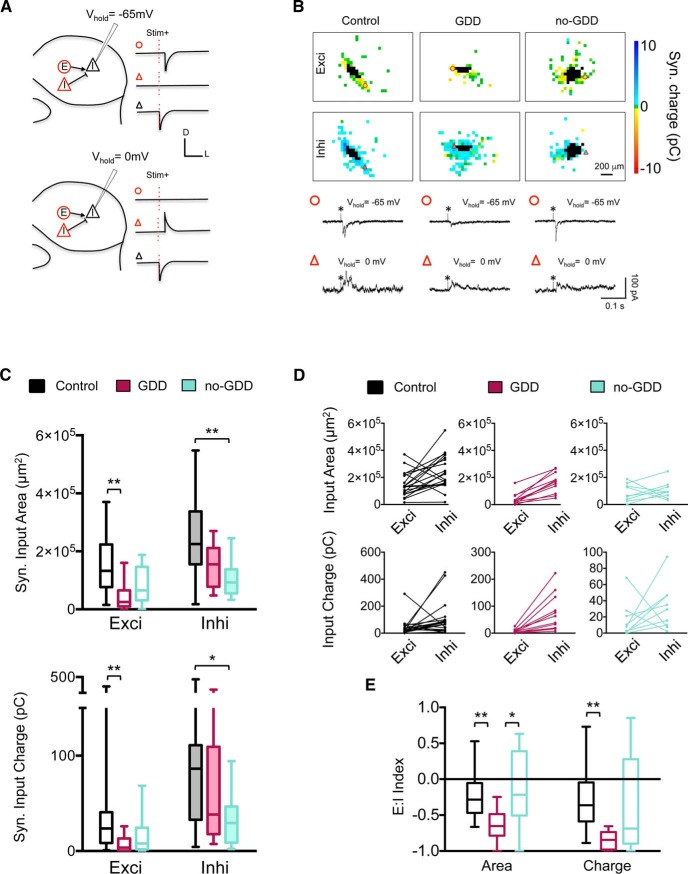
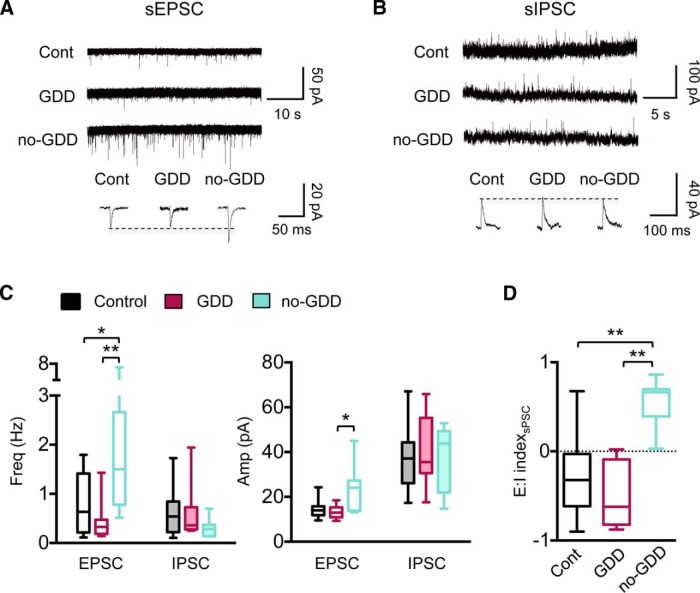
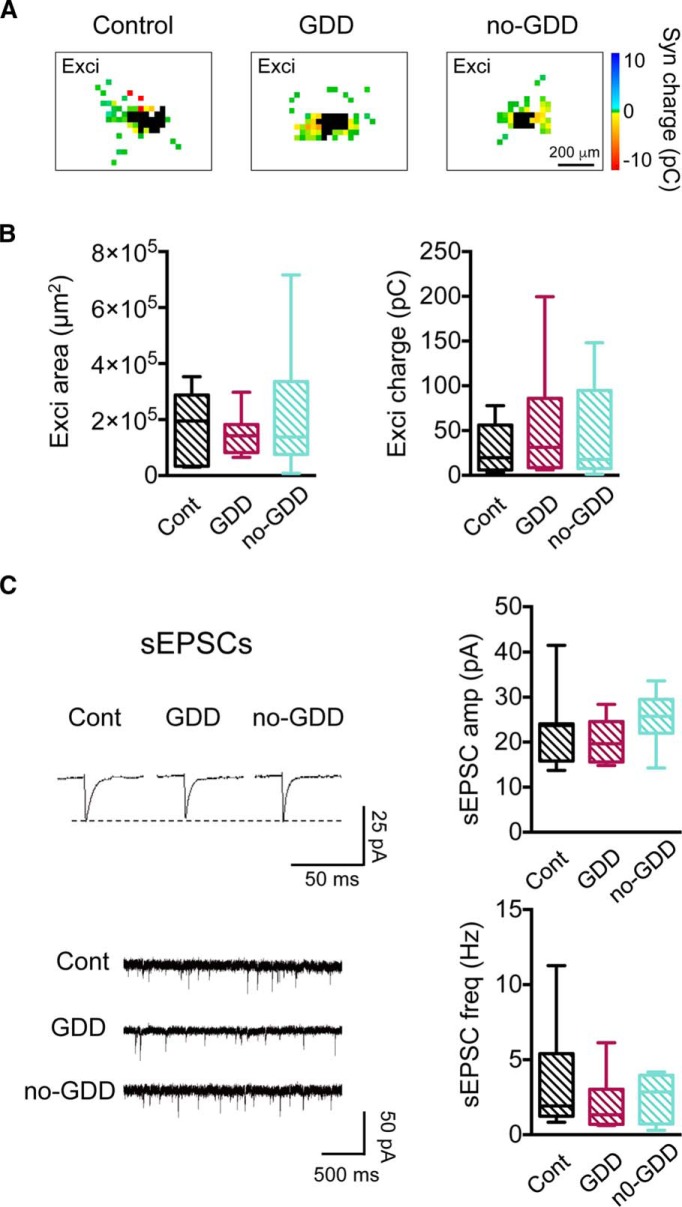
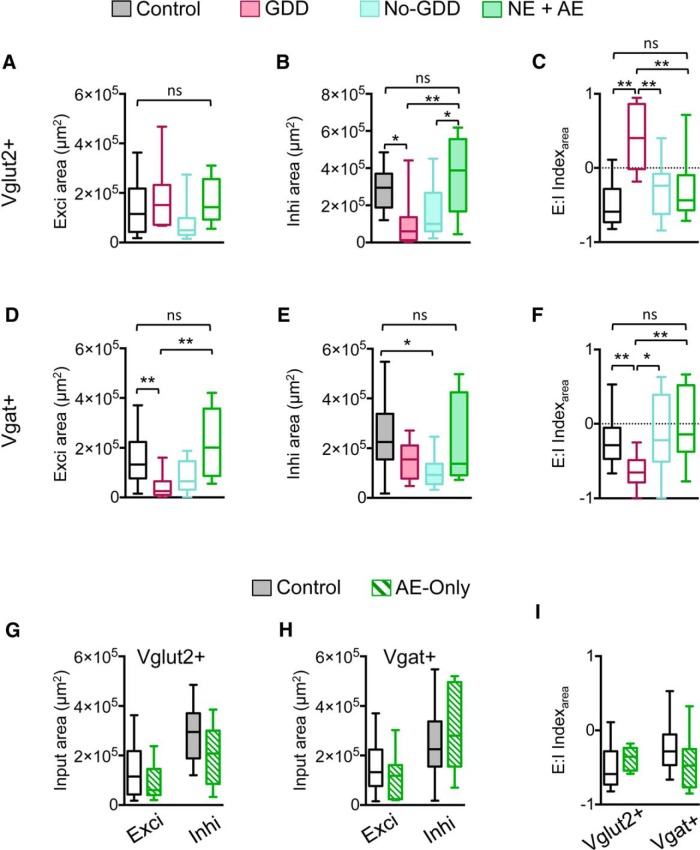
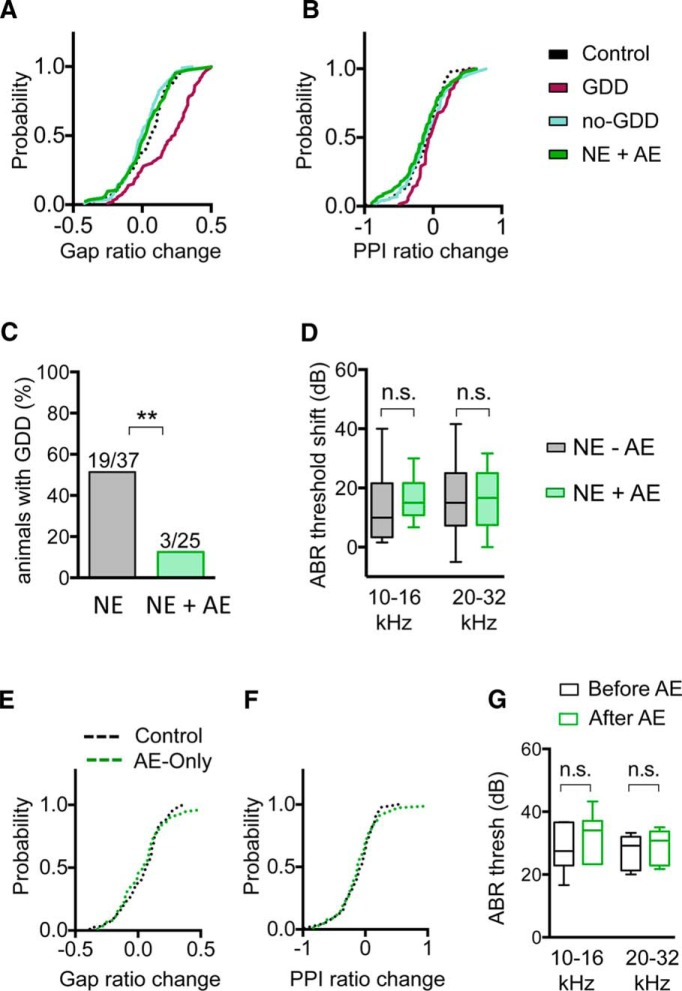
Hearing loss leads to a host of cellular and synaptic changes in auditory brain areas that are thought to give rise to auditory perception deficits such as temporal processing impairments, hyperacusis, and tinnitus. However, little is known about possible changes in synaptic circuit connectivity that may underlie these hearing deficits. Here, we show that mild hearing loss as a result of brief noise exposure leads to a pronounced reorganization of local excitatory and inhibitory circuits in the mouse inferior colliculus. The exact nature of these reorganizations correlated with the presence or absence of the animals' impairments in detecting brief sound gaps, a commonly used behavioral sign for tinnitus in animal models. Mice with gap detection deficits (GDDs) showed a shift in the balance of synaptic excitation and inhibition that was present in both glutamatergic and GABAergic neurons, whereas mice without GDDs showed stable excitation-inhibition balances. Acoustic enrichment (AE) with moderate intensity, pulsed white noise immediately after noise trauma prevented both circuit reorganization and GDDs, raising the possibility of using AE immediately after cochlear damage to prevent or alleviate the emergence of central auditory processing deficits.SIGNIFICANCE STATEMENT Noise overexposure is a major cause of central auditory processing disorders, including tinnitus, yet the changes in synaptic connectivity underlying these disorders remain poorly understood. Here, we find that brief noise overexposure leads to distinct reorganizations of excitatory and inhibitory synaptic inputs onto glutamatergic and GABAergic neurons and that the nature of these reorganizations correlates with animals' impairments in detecting brief sound gaps, which is often considered a sign of tinnitus. Acoustic enrichment immediately after noise trauma prevents circuit reorganizations and gap detection deficits, highlighting the potential for using sound therapy soon after cochlear damage to prevent the development of central processing deficits.

Keywords: midbrain; noise trauma; tinnitus; uncaging.


Conflict of interest statement

The authors declare no competing financial interests.

Figures

Figure 1.
Figure 1.
Effects of noise exposure on gap detection and PPI. A, Distribution of changes in gap startle ratios (response to startle stimulus with gap present divided by response to startle stimulus alone) over a 1 week period in control mice. Data fitted with normal distribution (gray curve, μ = 0.02, σ = 0.145, n = 67 sound frequencies). Gap ratio changes >2σ above the distribution mean (0.31) are considered a GDD. B, Cumulative probability distribution of gap ratio changes after noise exposure. C, Summary graphs of gap startle ratios before (open bars) and 7 d after noise exposure (closed bars). Gap detection ratios remain stable in no-GDD mice, but are increased for higher sound frequencies in GDD mice. See Figure 2 source data 1 for raw data and exact p values. D, Summary graphs of PPI startle ratio before and after noise exposure. Error bars indicate SEM. Asterisks indicate statistical significance. *p < 0.05, **p < 0.01. E, Summary graphs of ABR thresholds before and 7 d after noise exposure in vgat-ires-cre-dT mice. Thresholds for higher sound frequencies were elevated after noise exposure in both no-GDD and GDD mice. Error bars indicate SEM. *p < 0.05, **p < 0.01. AE are from vgat-ires-cre-dT-loxP mice; similar results were obtained from vglut2-cre-dT-loxP mice (data not shown).
Figure 2.
Figure 2.
Noise-induced reorganization of synaptic input maps onto glutamatergic IC neurons. A, Mice were noise exposed at P20–P23 and tested 7 d later for GDDs. Nineteen of 37 NE mice (51%) developed a GDD. B, Schematic of mapping excitatory (red E) and inhibitory (red I) synaptic inputs to glutamatergic (vglut2+) neurons (black encircled E). Excitatory and inhibitory synaptic input maps are obtained at a membrane holding voltage (Vm) of −65 mV (left) and 0 mV (right), respectively. Example maps are overlaid over a photograph of the corresponding IC slice. C, Examples of input maps from control, NE with GDD, and noise exposed without GDD (no-GDD) mice. Traces illustrate excitatory (¢) and inhibitory (Δ) synaptic responses to glutamate uncaging (*) at the locations indicated by symbols. Uncaging sites that elicited direct responses in the recorded neuron are marked as black. Examples maps and recordings traces are from single stimulation iterations. D, Noise trauma decreased inhibitory input area (top) and total inhibitory charge (bottom) in GDD mice, but not in no-GDD mice (median inhi area: control = 2.95 × 105 μm2, n = 12 neurons, n = 6 animals, GDD = 0.60 × 105 μm2, n = 10 neurons, n = 6 animals, no-GDD = 1.0 × 105 μm2, n = 12 neurons, n = 7 animals, F(2,31) = 6.13, p = 0.006, one-way ANOVA; median inhi charge: control = 88.3 pC, n = 12 neurons, n = 6 animals, GDD = 9.6 pC, n = 10 neurons, n = 6 animals, no-GDD = 32.6, n = 11 neurons, n = 7 animals, H = 14.13, p = 0.0009, Kruskal–Wallis test). Total excitatory charge (bottom) was decreased in no-GDD mice compared with GDD mice (median exci charge: control = 17.3 pC, n = 14 neurons, n = 6 animals, GDD = 39.4 pC, n = 10 neurons, n = 6 animals, no-GDD = 7.1 pC, n = 12 neurons, n = 7 animals, H = 6.43, p = 0.04, Kruskal–Wallis test). Data are shown as box-and-whisker plots; midline depicts median, box encompasses interquartile range and error bars represent total range. E, Excitatory and inhibitory synaptic inputs for individual neuron. Lines connect data from individual neurons. F, Mean of E:I indices of individual neurons for input area (left) and input charge (right; median E:IArea: control = −0.59, n = 12 neurons, n = 6 animals, GDD = 0.40, n = 10 neurons, n = 6 animals, no-GDD = −0.24, n = 12 neurons, n = 7 animals, F(2,31) = 17.72, p < 0.0001, one-way ANOVA; median E:ICharge: control = −0.81, n = 12 neurons, n = 6 animals, GDD = 0.83, n = 10 neurons, n = 6 animals, no-GDD = −0.55, n = 11 neurons, n = 7 animals, F(2,30) = 21.62, p < 0.0001, one-way ANOVA). *p < 0.05, **p < 0.01 in post hoc, pairwise assessments corrected for multiple comparisons.
Figure 3.
Figure 3.
Noise-trauma-induced changes in spontaneous synaptic events in glutamatergic CNIC neurons. A, Example traces of sEPSCs from control, GDD, and no-GDD mice. Individual events are averages of 30–100 individual events from single neurons. B, Same as A but for sIPSCs. C, Summary graphs for sPSC frequency (left) and amplitude (right). sEPSC frequency was increased in both GDD and no-GDD mice compared with control mice (median exci frequency: control = 0.45 Hz, n = 12 neurons, n = 6 animals, GDD = 1.48 Hz, n = 9 neurons, n = 6 animals, no-GDD = 1.0 Hz, n = 11 neurons, n = 6 animals, H = 16.89, p = 0.0002, Kruskal–Wallis test). sIPSC frequency was indistinguishable between groups (H = 1.85, p = 0.40, Kruskal–Wallis test). Amplitudes of sEPSC and sIPSC did not differ between control and NE groups (sEPSC amplitude, F(2,29) = 0.135, p = 0.88, one-way ANOVA; sIPSC amplitude, H = 3.42, p = 0.18, Kruskal–Wallis test). D, The E:I index calculated for the sum of PSC amplitudes over 60 s was increased in GDD mice relative to control mice (median E:I index: control = −0.45, n = 10 neurons, n = 6 animals, GDD = 0.58, n = 9 neurons, n = 6 animals, no-GDD= −0.15, n = 10 neurons, n = 6 animals, F(2,26) = 7.72, p = 0.002, one-way ANOVA). Data are shown as box-and-whisker plots. *p < 0.05, **p < 0.01 in post hoc, pairwise assessments corrected for multiple comparisons.
Figure 4.
Figure 4.
Two types of GABAergic CNIC neurons distinguished by local inputs. A, Example input maps of a type 1 and a type 2 GABAergic neuron. Type 1 neurons receive both excitatory and inhibitory inputs, whereas type 2 neurons receive predominantly excitatory inputs. Stimulation sites eliciting direct glutamate responses are in black. Example traces represent membrane currents elicited by glutamate uncaging over the soma. Circle indicates location of stimulation site. B, Direct response amplitude (left) and charge (right) are significantly larger in type 2 than in type 1 neurons (median peak amplitude, type 1 = 162.0 pA, n = 21 neurons, n = 10 animals, type 2 = 750.0 pA, n = 9 neurons, n = 8 animals, U = 23.50, p = 0.0007, two-tailed Mann–Whitney test; median peak charge, type 1 = 4.7 pC, n = 21 neurons, n = 10 animals, type 2 = 19.18 pC, n = 9 neurons, n = 8 animals, U = 34.0, p = 0.005, two-tailed Mann–Whitney test). C, Frequency and amplitudes of sEPSCs are significantly greater for type 2 neurons than for type 1 neurons (median frequency, type 1 = 0.63 Hz, n = 14 neurons, n = 8 animals, type 2 = 1.91 Hz, n = 7 neurons, n = 6 animals, U = 13.0, p = 0.006, two-tailed Mann–Whitney test; median amplitude, type 1 = 14.0 pA, n = 14 neurons, n = 8 animals, type 2 = 23.7 pA, n = 7 neurons, n = 6 animals, U = 14.5, p = 0.008, two-tailed Mann–Whitney test). Data are shown as box-and-whisker plots. Asterisks indicate statistical significance. *p < 0.05, **p < 0.01.
Figure 5.
Figure 5.
Noise-induced reorganization of synaptic input maps onto type 1 GABAergic neurons. A, Schematic of synaptic input mapping of type 1 GABAergic neurons (black triangle). Excitatory (circle) and inhibitory (triangle) inputs are shown in red. B, Examples of input maps for type 1 GABAergic neurons in control, GDD, and no-GDD mice. Current traces illustrate excitatory (circle) and inhibitory (triangle) synaptic responses to glutamate uncaging (asterisk) at the locations indicated by symbols. Uncaging sites that elicited direct responses are in black. C, Excitatory input area and total excitatory charge were decreased in GDD mice, relative to control mice (median exci area: control = 1.33 × 105 μm2, n = 20 neurons, n = 10 animals, GDD = 0.25 × 105 μm2, n = 12 neurons, n = 5 animals, no-GDD = 0.65 × 10⁵, n = 9 neurons, n = 6 animals, F(2,37) = 7.16, p = 0.002, one-way ANOVA; median exci charge, control = 23.7 pC, n = 20 neurons, n = 10 animals, GDD = 3.5 pC, n = 11 neurons, n = 5 animals, no-GDD = 7.9 pC, n = 9 neurons, n = 6 animals, H = 10.44, p = 0.005, Kruskal–Wallis test). Inhibitory input area and total inhibitory charge were decreased in no-GDD mice compared with control mice (median inhi area: control = 2.25 × 105 μm2, n = 21 neurons, n = 10 animals, GDD = 1.55 × 105 μm2, n = 13 neurons, n = 5 animals, no-GDD = 0.93 × 10⁵, n = 9 neurons, n = 6 animals, H = 10.97, p = 0.004, Kruskal–Wallis test; median inhi charge, control = 86.3 pC, n = 21 neurons, n = 10 animals, GDD = 38.3 pC, n = 13 neurons, n = 5 animals, no-GDD = 29.4 pC, n = 9 neurons, n = 6 animals, H = 6.02, p = 0.049, Kruskal–Wallis test). D, Relationship between excitatory and inhibitory synaptic inputs for individual neuron. Lines connect measurements from individual cells. E, E:I indices of control, GDD, and no-GDD mice. In GDD mice, the E:I indices for input area and input charge were shifted to more negative values relative to both control and no-GDD mice (median E:IArea: control = −0.28, n = 20 neurons, n = 10 animals, GDD = −0.65, n = 12 neurons, n = 5 animals, no-GDD = −0.21, n = 9 neurons, n = 6 animals, H = 13.01, p = 0.0015, Kruskal–Wallis test, median E:ICharge: control = −0.36, n = 20 neurons, n = 10 animals, GDD = −0.84, n = 12 neurons, n = 5 animals, no-GDD = −0.69, n = 9 neurons, n = 6 animals, H = 13.35, p = 0.0013, Kruskal–Wallis test). Data are shown as box-and-whisker plots. *p < 0.05, **p < 0.01 in post hoc, pairwise assessments corrected for multiple comparisons.
Figure 6.
Figure 6.
Spontaneous synaptic events onto type 1 GABAergic neurons in noise-traumatized mice. A, Example traces of sEPSCs from control, GDD, and no-GDD mice. Individual event traces are the average of 30–100 events from a single cell. B, Same as A but for sIPSCs. C, Frequencies and amplitudes of sEPSCs were increased in no-GDD mice (median sEPSC frequency: control = 0.63 Hz, n = 14 neurons, n = 8 animals, GDD = 0.33 Hz, n = 15 neurons, n = 6 animals, no-GDD = 1.50 Hz, n = 7 neurons, n = 5 animals, F(2,33) = 7.39, p = 0.0022, one-way ANOVA; median sEPSC amplitude: control = 14.0 pA, n = 14 neurons, n = 8 animals, GDD = 13.0 pA, n = 15 neurons, n = 6 animals, no-GDD = 24.1 pA, n = 7 neurons, n = 5 animals, H = 8.80, p = 0.0123, Kruskal–Wallis test). The frequencies and amplitudes of sIPSCs were indistinguishable between groups (sIPSC frequency, F(2,33) = 1.141, p = 0.33, one-way ANOVA; sIPSC amplitude, F(2,33) = 0.236, p = 0.79, one-way ANOVA). D, E:I index calculated for the sum of PSC amplitudes over 60 s was increased in no-GDD mice relative to both GDD and control mice (median E:I index: control = −0.32, n = 14 neurons, n = 8 animals, GDD = −0.62, n = 15 neurons, n = 6 animals, no-GDD = 0.67, n = 7 neurons, n = 5 animals, F(2,33) = 19.74, p < 0.0001, one-way ANOVA). Data are shown as box-and-whisker plots. *p < 0.05, **p < 0.01 in post hoc, pairwise assessments corrected for multiple comparisons.
Figure 7.
Figure 7.
Synaptic inputs onto type 2 GABAergic neurons are unchanged in noise-traumatized mice. A, Examples of excitatory input maps of type 2 GABAergic neurons from control, GDD, and no-GDD mice. Uncaging sites that elicited direct responses in the recorded neuron are marked in black. B, Noise exposure had no effect on excitatory input area (left) or on total excitatory postsynaptic charge (right; area: control, n = 9 neurons, n = 8 animals, GDD, n = 7 neurons, n = 4 animals, no-GDD, n = 10 neurons, n = 6 animals, H = 0.067, p = 0.97, Kruskal–Wallis test; charge: control, n = 9 neurons, n = 8 animals, GDD, n = 7 neurons, n = 4 animals, no-GDD, n = 10 neurons, n = 6 animals, F(2,23) = 0.49, p = 0.62, one-way ANOVA). C, Amplitudes (top) and frequency of spontaneous EPSCs are unchanged by noise trauma (control, n = 7 neurons, n = 6 animals, GDD, n = 6 neurons, n = 3 animals, no-GDD, n = 10 neurons, n = 6 animals, amplitudes: F(2,20) = 1.13, p = 0.34, one-way ANOVA; frequency: F(2,20) = 1.00, p = 0.38, one-way ANOVA). Data are shown as box-and-whisker plots. *p < 0.05, **p < 0.01 in post hoc, pairwise assessments corrected for multiple comparisons.
Figure 8.
Figure 8.
AE with pulsed white noise inhibits noise-trauma-induced circuit reorganization. A, Excitatory input maps of glutamatergic neurons (Vglut2+) in control, GDD, no-GDD (same data as in Figs. 2, 5), and NE-AE mice (median exci area: control = 1.15 × 105 μm2, n = 15 neurons, n = 6 animals, NE-AE = 1.43 × 105 μm2, n = 9 neurons, n = 4 animals, F(3,42) = 1.78, p = 0.180, one-way ANOVA: 95% CI of difference between control vs NE-AE = −1.45–0.92 × 105 μm2, corrected pairwise comparison after one-way ANOVA). B, Same as A but for inhibitory input maps (median inhi area: control = 2.95 × 105 μm2, n = 12 neurons, n = 6 animals, NE-AE = 3.88 × 105 μm2, n = 9 neurons, n = 4 animals, F(3,39) = 6.008, p = 0.0018, one-way ANOVA: 95% CI of difference between control vs NE-AE = −2.44–1.11 × 105 μm2, corrected pairwise comparison after one-way ANOVA). C, E:I indices of glutamatergic neurons. The E:I indices from NE-AE animals are not significantly different from those of control animals (median E:I index, control = −0.59, n = 12 neurons, n = 6 animals, NE-AE = −0.44, n = 9 neurons, n = 4 animals, F(3,39) = 11.18, p < 0.0001, one-way ANOVA: 95% CI of difference between control vs NE-AE = −0.65–0.24, corrected pairwise comparison after one-way ANOVA). DF, Same as in AC but for type 1 GABAergic neurons (vgat+). D, Excitatory input maps (median exci area: control = 1.33 × 105 μm2, n = 20 neurons, n = 10 animals, NE-AE = 2.01 × 105 μm2, n = 8 neurons, n = 4 animals, H = 17.50, p = 0.0006, Kruskal–Wallis test, mean rank difference for control vs NE-AE = −5.36, p > 0.05, Dunn's test after Kruskal–Wallis test). E, Inhibitory input maps (median inhi area, control = 2.25 × 105 μm2, n = 21 neurons, n = 10 animals, NE-AE = 1.38 × 105 μm2, n = 9 neurons, n = 4 animals, H = 10.60, p = 0.014, Kruskal–Wallis test, mean rank difference for control vs NE-AE = 4.93, p > 0.05, Dunn's test after Kruskal–Wallis test). F, E:I indices (median E:I index, control = −0.28, n = 20 neurons, n = 10 animals, NE-AE = −0.14, n = 8 neurons, n = 4 animals, H = 15.17, p = 0.0017, Kruskal–Wallis test, mean rank difference of between control vs NE-AE = −5.50, p > 0.05, Dunn's test after Kruskal–Wallis test). G, AE applied to animals without noise trauma had no effect on excitatory or inhibitory input maps of glutamatergic neurons (vglut2+; exci area: control, n = 15 neurons, n = 6 animals, AE-only, n = 7 neurons, n = 4 animals, t(20) = 0.850, p = 0.41, two-tailed Student's t test: inhi area: control, n = 12 neurons, n = 6 animals, AE-only, n = 7 neurons, n = 4 animals, t(17) = p = 0.12, two-tailed Student's t test). H, Same as G but for type 1 GABAergic neurons (vgat+; exci area: control, n = 20 neurons, n = 10 animals, AE-alone, n = 9 neurons, n = 3 animals, t(27) = 0.99, p = 0.33, two-tailed Student's t test; inhi area: control, n = 21 neurons, n = 10 animals, AE-alone, n = 9 neurons, n = 3 animals, t(28) = 1.07, p = 0.29, two-tailed Student's t test). I, AE in nontraumatized animals did not change E:I indices for glutamatergic or for type 1 GABAergic neurons (Vglut2+ neurons: control, n = 12 neurons, n = 6 animals, AE-only, n = 7 neurons, n = 4 animals, t(17) = 1.08, p = 0.30, two-tailed Student's t test: Vgat+ neurons: control, n = 20 neurons, n = 10 animals, AE-only, n = 9 neurons, n = 3 animals, t(27) = 1.75, p = 0.09, two-tailed Student's t test). Data are shown as box-and-whisker plots. *p < 0.05, **p < 0.01.
Figure 9.
Figure 9.
AE prevents the development of GDDs. A, AE prevented the noise-induced increase in gap detection ratios observed in GDD mice (gap ratio change: control = 0.03 ± 0.02, n = 89 sound frequencies, GDD = 0.18 ± 0.02, n = 93 sound frequencies, no-GDD = 0.00 ± 0.01, n = 110 sound frequencies, NE-AE = 0.02 ± 0.02, n = 84 sound frequencies, p < 0.0001, Kruskal–Wallis test). B, PPI of the startle response was not significantly different between groups (PPI ratio change, control = −0.12 ± 0.03, n = 90 sound frequencies; GDD = 0.00 ± 0.03, n = 65 sound frequencies, no-GDD = −0.10 ± 0.04, n = 100 sound frequencies, NE-AE = −0.15 ± 0.04, n = 89 sound frequencies). C, Percentage of NE animals that developed GDDs (black) was decreased by AE (green; NE without AE, n = 37 animals, NE with AE, n = 25, p = 0.0025, two-tailed Fisher's exact test). D, AE did not affect noise-induced ABR threshold shifts at low or high frequencies (10–16 kHz: NE = 13.6 ± 2.8 dB, n = 17 animals, NE+AE = 16.2 ± 2.0 dB, n = 13 animals, t(28) = 0.73, p = 0.47, two-tailed Student's t test; 20–32 kHz: NE = 16.5 ± 3.0 dB, n = 17 animals, NE+AE = 15.8 ± 2.7 dB, n = 13 animals, t(28) = 0.185, p = 0.85, two-tailed Student's t test). E, AE delivered to control mice without noise exposure had no effect on gap detection ratios (gap ratio change, control = 0.03 ± 0.02, n = 89 sound frequencies, AE-only = 0.04 ± 0.02, n = 75 sound frequencies, p = 0.59, Kolmogorov–Smirnov test). F, Same as E but for PPI inhibition of the ASR (PPI ratio change, control = −0.12 ± 0.03, n = 90 sound frequencies, AE-only = −0.11 ± 0.04, n = 77 sound frequencies, p = 0.83, Kolmogorov–Smirnov test). G, AE for 7 d delivered to control mice without noise exposure did not change ABR thresholds (10–16 kHz: median threshold before AE = 27.5 dB, after AE = 34.0 dB, n = 6 animals, p = 0.43, Wilcoxon test; 20–32 kHz: median threshold before AE = 29.2 dB, after AE = 30.8, n = 6 animals, p = 0.60, two-tailed paired t test). Data in D and G are shown as box-and-whisker plots. *p < 0.05, **p < 0.01.

Similar articles

Cited by

References

    1. Adams JC. (1979) Ascending projections to the inferior colliculus. J Comp Neurol 183:519–538. 10.1002/cne.901830305 - DOI - PubMed
    1. Baguley D, McFerran D, Hall D (2013) Tinnitus. Lancet 382:1600–1607. 10.1016/S0140-6736(13)60142-7 - DOI - PubMed
    1. Bajo VM, King AJ (2012) Cortical modulation of auditory processing in the midbrain. Front Neural Circuits 6:114. 10.3389/fncir.2012.00114 - DOI - PMC - PubMed
    1. Bajo VM, Nodal FR, Moore DR, King AJ (2010) The descending corticocollicular pathway mediates learning-induced auditory plasticity. Nat Neurosci 13:253–260. 10.1038/nn.2466 - DOI - PMC - PubMed
    1. Bauer CA, Turner JG, Caspary DM, Myers KS, Brozoski TJ (2008) Tinnitus and inferior colliculus activity in chinchillas related to three distinct patterns of cochlear trauma. J Neurosci Res 86:2564–2578. 10.1002/jnr.21699 - DOI - PMC - PubMed

Publication types