Comparative Study
. 2017 Jul 21;292(29):12139-12152.
doi: 10.1074/jbc.M117.793877. Epub 2017 Jun 5.

Conformational biosensors reveal allosteric interactions between heterodimeric AT1 angiotensin and prostaglandin F2α receptors

Affiliations
Comparative Study

Conformational biosensors reveal allosteric interactions between heterodimeric AT1 angiotensin and prostaglandin F2α receptors

Rory Sleno et al. J Biol Chem. .

Abstract

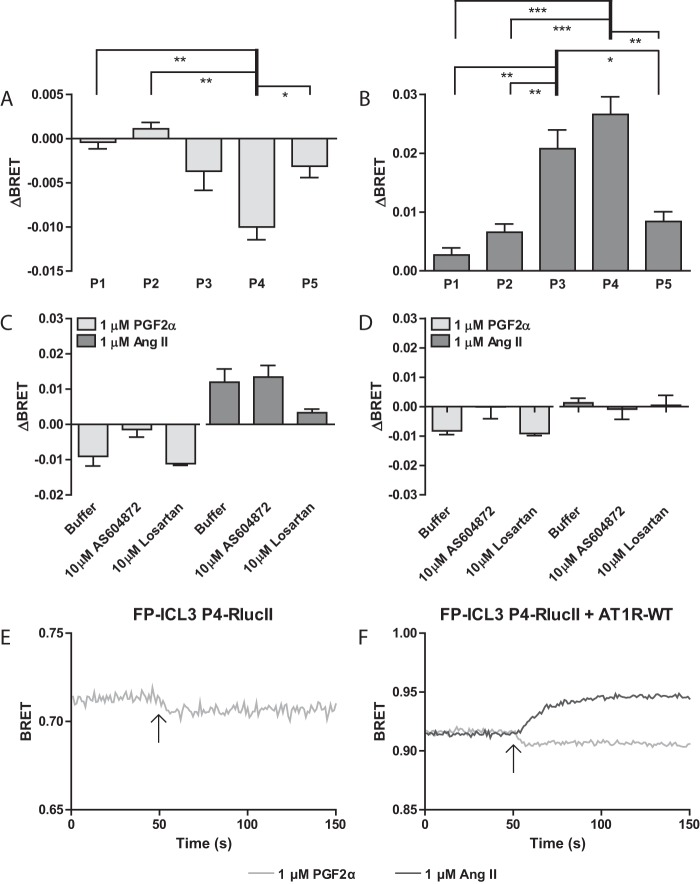
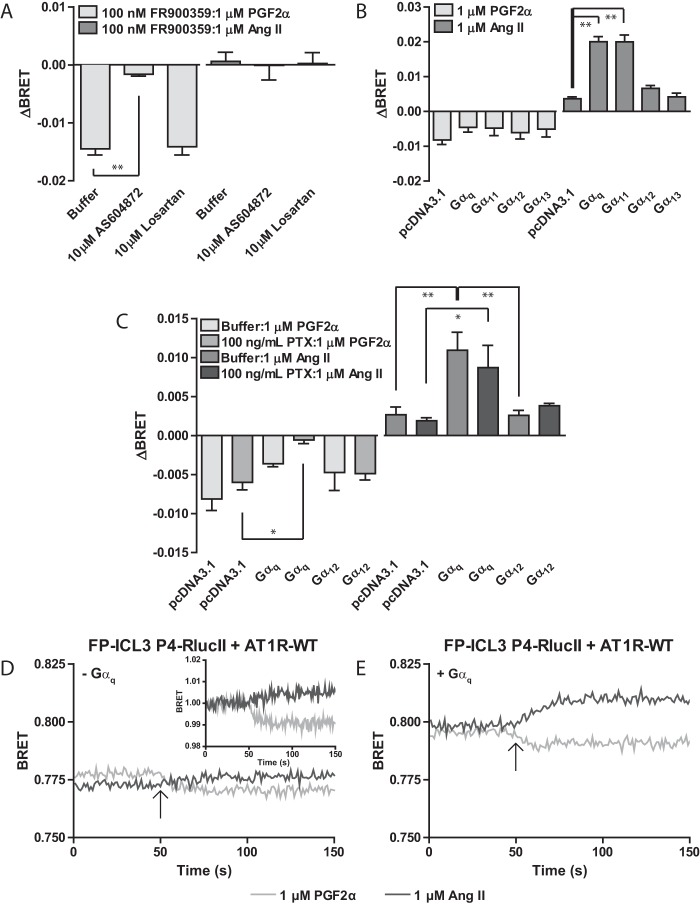
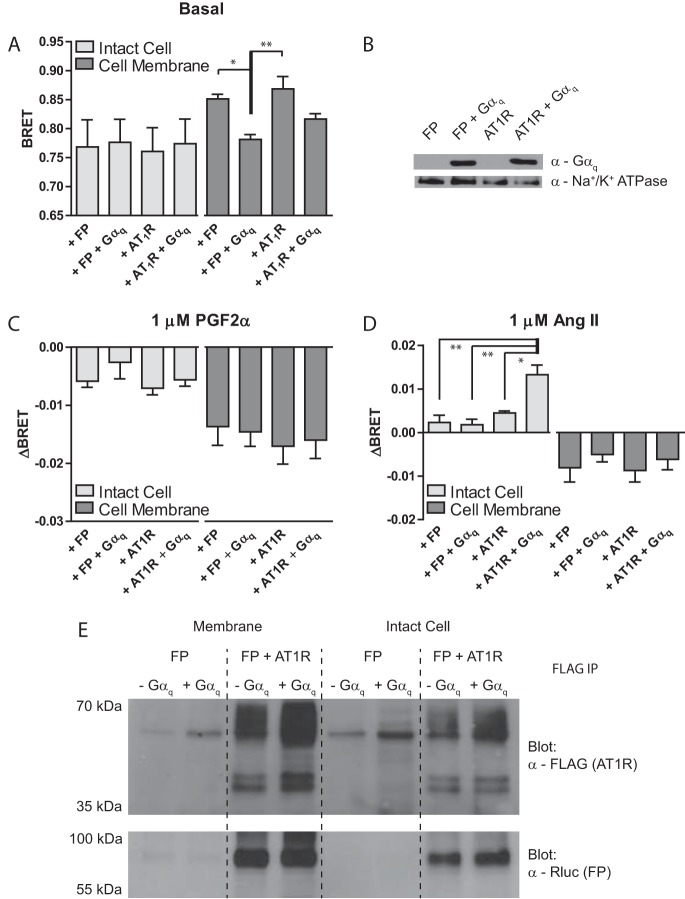
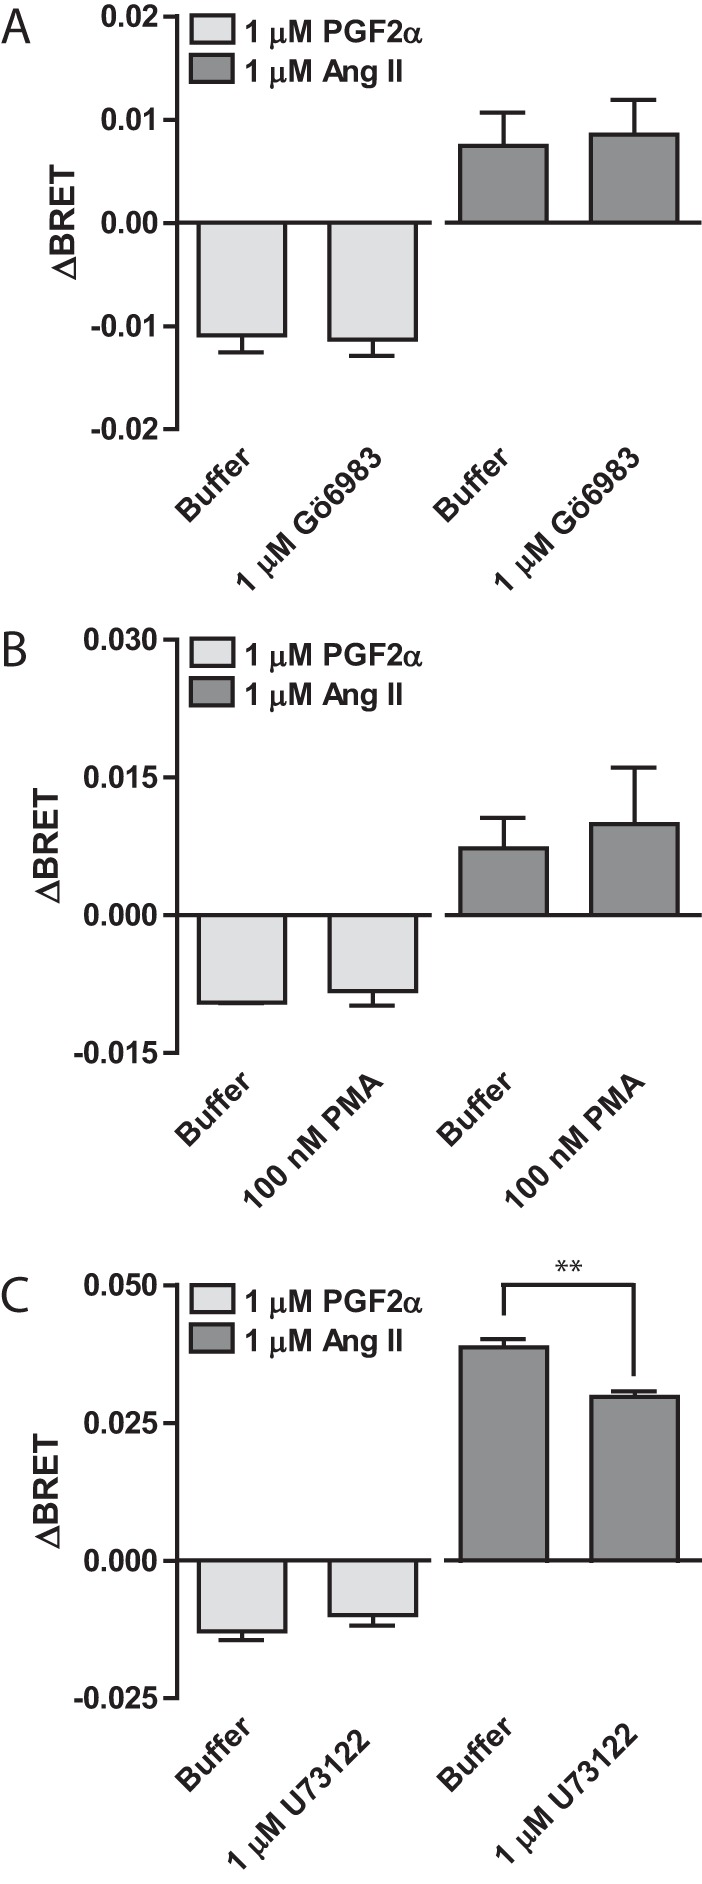
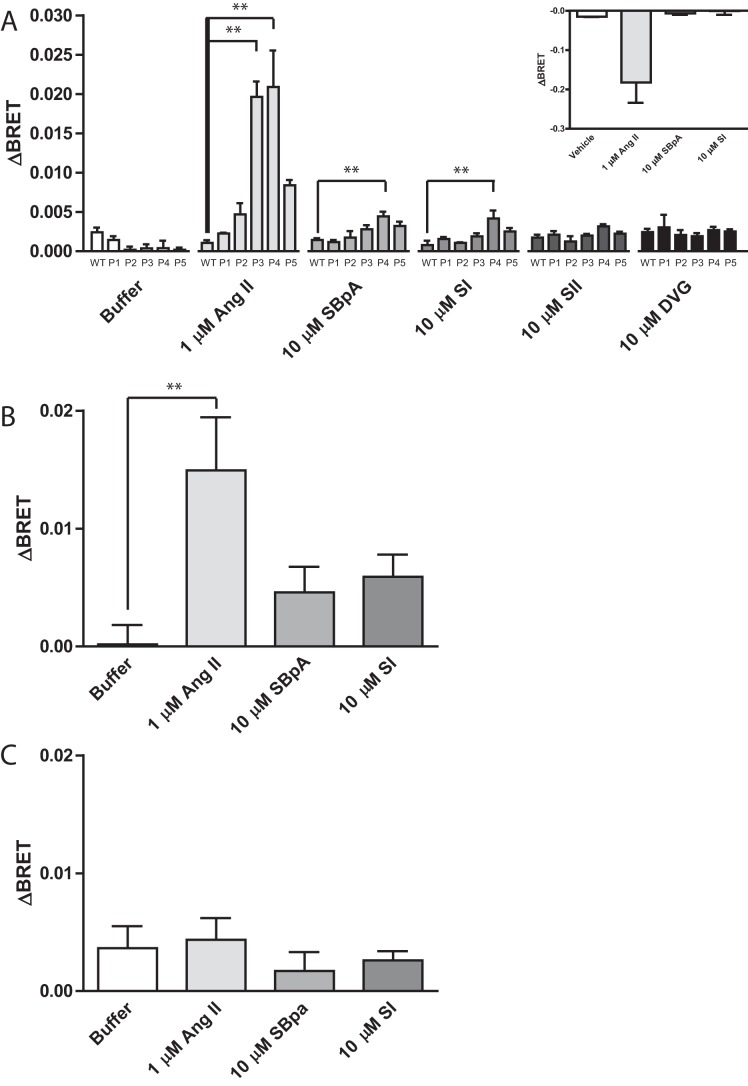
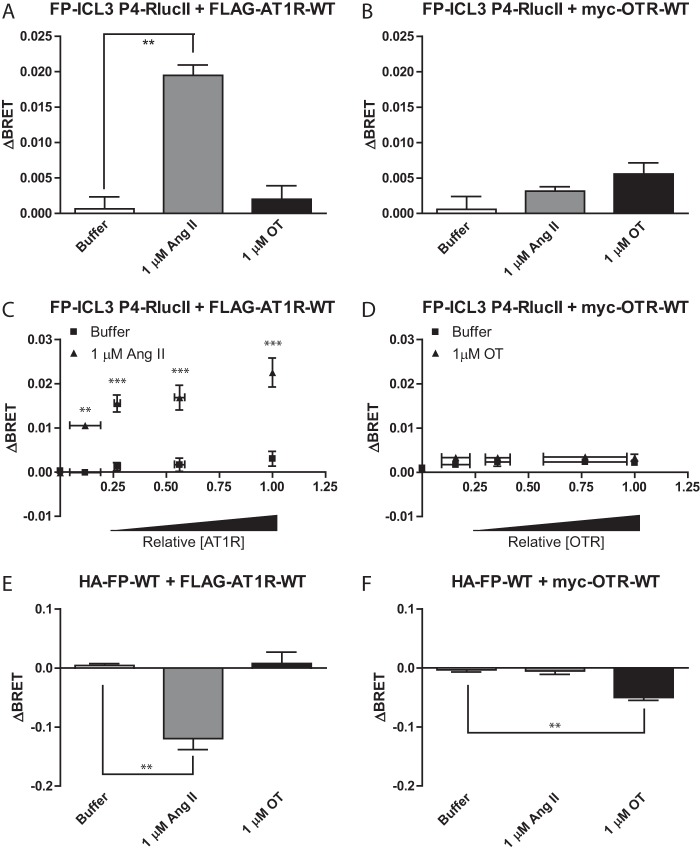
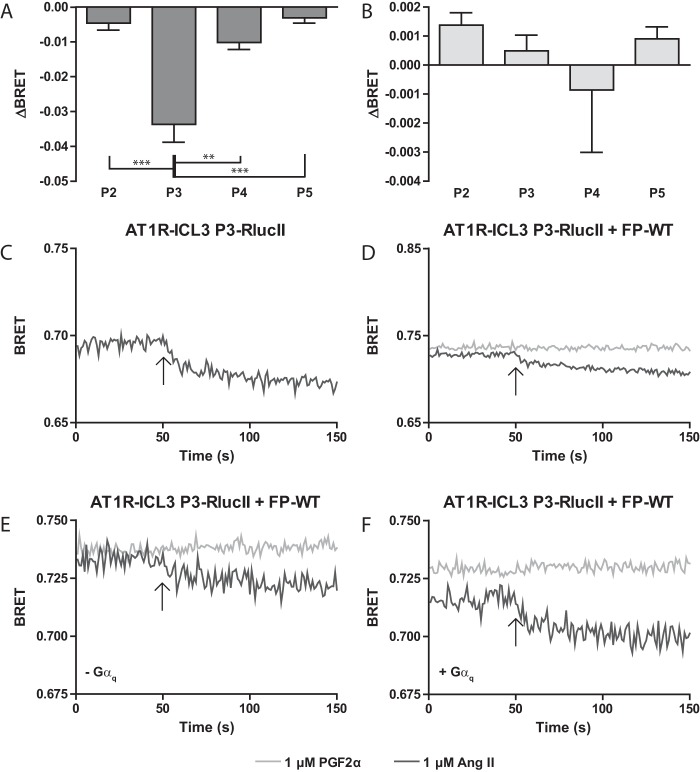
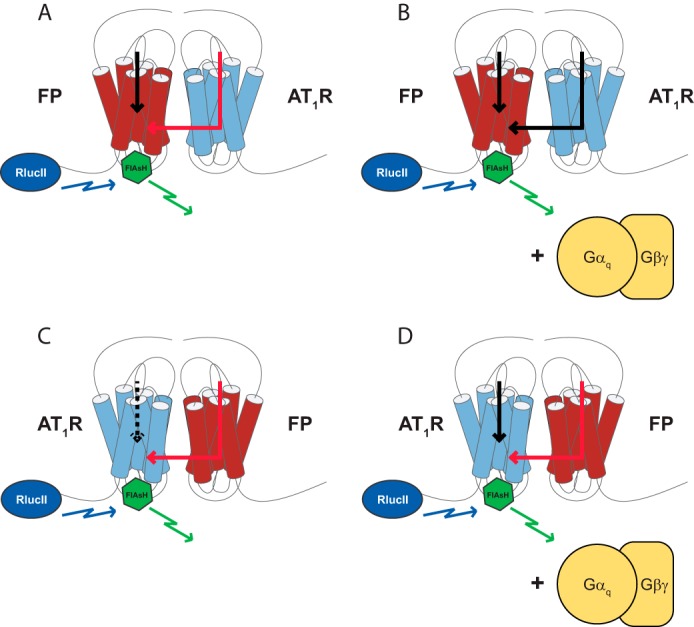
G protein-coupled receptors (GPCRs) are conformationally dynamic proteins transmitting ligand-encoded signals in multiple ways. This transmission is highly complex and achieved through induction of distinct GPCR conformations, which preferentially drive specific receptor-mediated signaling events. This conformational capacity can be further enlarged via allosteric effects between dimers, warranting further study of these effects. Using GPCR conformation-sensitive biosensors, we investigated allosterically induced conformational changes in the recently reported F prostanoid (FP)/angiotensin II type 1 receptor (AT1R) heterodimer. Ligand occupancy of the AT1R induced distinct conformational changes in FP compared with those driven by PGF2α in bioluminescence resonance energy transfer (BRET)-based FP biosensors engineered with Renilla luciferase (RLuc) as an energy donor in the C-tail and fluorescein arsenical hairpin binder (FlAsH)-labeled acceptors at different positions in the intracellular loops. We also found that this allosteric communication is mediated through Gαq and may also involve proximal (phospholipase C) but not distal (protein kinase C) signaling partners. Interestingly, β-arrestin-biased AT1R agonists could also transmit a Gαq-dependent signal to FP without activation of downstream Gαq signaling. This transmission of information was specific to the AT1R/FP complex, as activation of Gαq by the oxytocin receptor did not recapitulate the same phenomenon. Finally, information flow was asymmetric in the sense that FP activation had negligible effects on AT1R-based conformational biosensors. The identification of partner-induced GPCR conformations may help identify novel allosteric effects when investigating multiprotein receptor signaling complexes.

Keywords: G protein-coupled receptor (GPCR); bioluminescence resonance energy transfer (BRET); cell signaling; conformational change; dimerization.


Conflict of interest statement

The authors declare that they have no conflicts of interest with the contents of this article

Figures

Figure 1.
Figure 1.
Ang II binding to AT1R induces a conformational rearrangement in FP. A and B, HEK 293 cells were transfected with FP conformational biosensors with a FlAsH tag inserted at the indicated position (Px) along with AT1R-WT. Cells were stimulated with 1 μm PGF2α (A) or Ang II (B) and the change in BRET (ΔBRET) due to ligand stimulation is reported. C, and D, HEK 293 cells were transfected with FP-ICL3 P4-RLucII and AT1R-WT (C) or FP-WT (D). Cells were pre-treated with assay buffer, 10 μm AS604872, or 10 μm losartan for 30 min prior to BRET recording. Cells were stimulated with 1 μm PGF2α or Ang II and the change in BRET (ΔBRET) due to ligand stimulation is reported. Bars represent the mean of 3 independent biological replicates and error bars represent S.E. A and B, Tukey's test was performed where: *** = p < 0.001; ** = p < 0.01; and * = p < 0.05, n = 3. C and D, Dunnett's test was performed to compare treatments to buffer. No comparisons were statistically significant. Increasing n was not possible as availability of AS604872 was limited. E and F, kinetic traces of conformation biosensors in response to ligand stimulation. HEK 293 cells were transfected with FP-ICL3 P4-RLucII alone (E) or co-transfected with AT1R-WT (F). The specified ligand was injected onto the cells at the 50th repeat measure as denoted by an arrow. Traces represent the mean of 3 independent experiments.
Figure 2.
Figure 2.
Functional Gαq/11 is required for Ang II-induced conformational cross-talk between AT1R and FP. A, HEK 293 cells were transfected with the FP-ICL3 P4-RLucII biosensor and AT1R-WT. Cells were pre-treated with 100 nm of the Gαq inhibitor FR900359 for 1 h followed by buffer, 10 μm AS604872, or 10 μm losartan for 30 min prior to BRET recording. Cells were stimulated with 1 μm PGF2α or Ang II and the change in BRET (ΔBRET) due to ligand stimulation is reported. B, ΔGαq/11/12/13 HEK 293 cells were transfected with FP-ICL3 P4-RLucII, AT1R-WT, and pcDNA3.1 or the indicated Gα subunit. Cells were stimulated with 1 μm PGF2α or Ang II and the change in BRET (ΔBRET) due to ligand stimulation is reported. C, ΔGαq/11/12/13 HEK 293 cells were transfected with FP-ICL3 P4-RLucII, AT1R-WT, and pcDNA3.1 or the indicated Gα subunit. Cells were pre-treated with buffer or 100 ng/ml of pertussis toxin for 16 h before FlAsH labeling. Cells were stimulated with 1 μm PGF2α or Ang II and the change in BRET (ΔBRET) due to ligand stimulation is reported. Bars represent the mean of 3 independent biological replicates and error bars represent S.E. A and B, Dunnett's test was performed to compare conditions with buffer (A) or pcDNA3.1 (B), where ** = p < 0.01. C, a two-way analysis of variance was used to analyze the 2 graphs. For both graphs, the G protein factor and interaction were nonsignificant, whereas the PTX factor was significant (PGF2α = p < 0.01, Ang II = p < 0.001). Bonferroni corrected tests were used to make post hoc comparisons where: * = p < 0.05; ** = p < 0.01. D and E, kinetic traces of conformational biosensors responding to ligand in the presence and absence of G proteins. ΔGαq/11/12/13 cells were transfected with FP-ICL3 P4-RLucII and AT1R-WT (D) or FP-ICL3 P4-RLucII, AT1R-WT, and Gαq (E). The specified ligand was injected onto the cells at the 50th repeat measure as denoted by an arrow. Inset to D: offset basal traces for PGF2α and Ang II to better demonstrate differences in biosensor responses. Traces represent the mean of 3 independent experiments.
Figure 3.
Figure 3.
Membrane preparation results in a loss of Ang II-induced AT1R to FP conformational cross-talk although the receptors still form a complex. A, ΔGαq/11/12/13 HEK 293 cells were transfected with FP-ICL3 P4-RLucII, the indicated wild-type receptor, and pcDNA3.1, or the indicated Gα subunit. Cells were split into intact cell or membrane preparation groups. Each group was treated as described under “Experimental procedures.” Basal BRET was recorded in the absence of receptor ligands. B, Western blot analysis demonstrating that Gαq is still present in the sample after membrane preparation. C and D, the same preparations used in A and B were stimulated with 1 μm PGF2α (C) or Ang II (D) and the change in BRET (ΔBRET) due to ligand stimulation is reported. E, Western blots demonstrating that AT1R (FLAG) can co-immunoprecipitate FP-ICL3 P4-RLucII in lysates from prepared membrane or intact ΔGαq/11/12/13 HEK 293 cell samples, independent of the expression of Gαq. A, C, and D, bars represent the mean of 3 independent biological replicates and error bars represent S.E. Tukey's test was used to compare all groups in graphs where: * = p < 0.5; ** = p < 0.01. B and E are representative blots of n = 2. E, expression of FP-ICL3 P4-RLucII in all conditions has been demonstrated based on quantification of luminescence from RLucII (data not shown).
Figure 4.
Figure 4.
Proximal but not distal Gαq signaling cross-talk is involved in transmitting Ang II-induced conformational information to FP. A and B, HEK 293 cells were transfected with FP-ICL3 P4-RLucII and AT1R-WT. Cells were pre-treated with 1 μm of the PKC inhibitor Gö6983 for 1 h (A) or co-stimulated with 100 nm phorbol 12-myristate 13-acetate (B), a direct PKC activator. Cells were stimulated with 1 μm PGF2α or Ang II and the change in BRET (ΔBRET) due to ligand stimulation is reported. D, HEK 293 cells were transfected with FP-ICL3 P4-RLucII and AT1R-WT. Cells were pre-treated with 1 μm U73122 for 1 h. Cells were stimulated with 1 μm PGF2α or Ang II and the change in BRET (ΔBRET) due to ligand stimulation is reported. Bars represent the mean of 3 independent biological replicates and error bars represent S.E. A t test was performed to compare buffer versus treatment where ** = p < 0.01.
Figure 5.
Figure 5.
β-Arrestin-biased AT1R agonists induce a Gαq-dependent conformational change in FP. A, HEK 293 cells were transfected with the different FP ICL3 conformational biosensors and AT1R-WT. Cells were stimulated with the indicated ligand and concentration and the change in BRET (ΔBRET) due to ligand stimulation is reported. Inset: ΔGαq/11/12/13 HEK 293 cells were transfected with FP-WT, AT1R-WT, and a BRET-based Gαq activation sensor and stimulated with the indicated ligand and concentration and the change in BRET (ΔBRET) due to ligand stimulation is reported, n = 2. B and C, ΔGαq/11/12/13 HEK 293 cells were transfected with FP-ICL3 P4-RLucII, AT1R-WT, and Gαq (B) or pcDNA3.1 (C). Cells were stimulated with the indicated ligand and concentration and the change in BRET (ΔBRET) due to ligand stimulation is reported. Bars represent the mean of 3 independent biological replicates and error bars represent S.E. Dunnett's test was performed comparing WT (A), or buffer (B and C), where ** = p < 0.01.
Figure 6.
Figure 6.
Activation of Gαq by the oxytocin receptor does not induce a similar conformational change in FP. A and B, HEK 293 cells were transfected with FP-ICL3 P4-RLucII and AT1R-WT (A) or OTR-WT (B). Cells were stimulated with the indicated ligand/concentration and the change in BRET (ΔBRET) due to ligand stimulation is reported. C and D, HEK 293 cells were transfected with a constant amount of the cDNA for FP-ICL3 P4-RLucII and increasing amounts of AT1R-WT (C) or OTR-WT (D) cDNA. Cells were stimulated with 1 μm Ang II (C) or oxytocin (OT) (D) and the change in BRET (ΔBRET) due to ligand stimulation is reported. Ligand-induced changes in BRET plotted against the relative AT1R (C) or OTR (D) surface expression as assessed by in-cell western blots normalized to the highest expression level. E and F, HEK 293 cells were transfected with a BRET-based Gαq activation sensor, FP-WT, and AT1R-WT (E) or OTR (F). Cells were stimulated with the indicated ligand/concentration and the change in BRET (ΔBRET) due to ligand stimulation is reported. A, B, E, and F, bars represent the mean of 3 independent biological replicates and error bars represent S.E. Dunnett's test was performed comparing to buffer where, ** = p < 0.01. C and D, a two-way analysis of variance was performed, n = 3. For C, both factors of relative expression and stimulation as well as the interaction were significant. For D, both factors of relative expression and stimulation were significant but the interaction was not. Bonferroni corrected t-tests were performed to compare the buffer versus Ang II or OT at each relative expression level, where ** = p < 0.01 and *** = p < 0.001.
Figure 7.
Figure 7.
Conformational communication between protomers of the FP/AT1R heterodimer is asymmetric. HEK 293 cells were transfected with AT1R conformation sensors with a FlAsH tag inserted at the indicated position along with FP-WT. Cells were stimulated with 1 μm PGF2α (A) or Ang II (B) and the change in BRET (ΔBRET) due to ligand stimulation is reported. Bars represent the mean of 3 independent biological replicates and error bars represent S.E. Tukey's test was performed where, ** = p < 0.01 and ** = p < 0.001. C and D, kinetic traces of AT1R conformational biosensors responding to ligand. HEK 293 cells were transfected with AT1R-ICL3 P3-RLucII alone (C) or co-transfected with FP-WT (D). The specified ligand was injected onto the cells at the 50th repeat measure as denoted by an arrow. Traces represent the mean of 3 independent experiments. E and F, kinetic traces of AT1R conformational biosensors responding to ligand in the presence and absence of G proteins. ΔGαq/11/12/13 cells were transfected with AT1R-ICL3 P3-RLucII and FP-WT (E) or AT1R-ICL3 P3-RLucI, FP-WT, and Gαq (F). The specified ligand was injected onto the cells at the 50th repeat measure as denoted by an arrow. Traces represent the mean of 3 independent experiments.
Figure 8.
Figure 8.
Conformational information is transmitted asymmetrically between protomers of the FP/AT1R heterodimer and is dependent on Gα. In the absence (A) of Gαq/11/12/13, PGF2α binding to the sensor receptor can elicit a conformational (black arrow), but this response was blunted for the partner AT1R (red arrow). However, when Gαq/11 is present (B), full responses to in the FP biosensor are observed in response to either receptor. When the AT1R is tagged with the conformational biosensor, responses are detected in response to Ang II but not PGF2α (C and D, respectively), indicating that such conformational responses might be asymmetric depending on the relative positions of the sensor tags and the organization of the dimer/G protein complex.

Similar articles

Cited by

References

    1. Lane J. R., Donthamsetti P., Shonberg J., Draper-Joyce C. J., Dentry S., Michino M., Shi L., López L., Scammells P. J., Capuano B., Sexton P. M., Javitch J. A., and Christopoulos A. (2014) A new mechanism of allostery in a G protein-coupled receptor dimer. Nat. Chem. Biol. 10, 745–752 - PMC - PubMed
    1. Han Y., Moreira I. S., Urizar E., Weinstein H., and Javitch J. A. (2009) Allosteric communication between protomers of dopamine class A GPCR dimers modulates activation. Nat. Chem. Biol. 5, 688–695 - PMC - PubMed
    1. Rasmussen S. G., DeVree B. T., Zou Y., Kruse A. C., Chung K. Y., Kobilka T. S., Thian F. S., Chae P. S., Pardon E., Calinski D., Mathiesen J. M., Shah S. T., Lyons J. A., Caffrey M., Gellman S. H., et al. (2011) Crystal structure of the β2-adrenergic receptor-Gs protein complex. Nature 477, 549–555 - PMC - PubMed
    1. Tesmer J. J. (2016) Hitchhiking on the heptahelical highway: structure and function of 7TM receptor complexes. Nat. Rev. Mol. Cell Biol. 17, 439–450 - PMC - PubMed
    1. Huang W., Manglik A., Venkatakrishnan A. J., Laeremans T., Feinberg E. N., Sanborn A. L., Kato H. E., Livingston K. E., Thorsen T. S., Kling R. C., Granier S., Gmeiner P., Husbands S. M., Traynor J. R., Weis W. I., et al. (2015) Structural insights into μ-opioid receptor activation. Nature 524, 315–321 - PMC - PubMed

Publication types

MeSH terms

Grants and funding

LinkOut - more resources