. 2017 Jun 6;114(23):5878-5885.
doi: 10.1073/pnas.1610602114.

Whole-organism cellular gene-expression atlas reveals conserved cell types in the ventral nerve cord of Platynereis dumerilii

Affiliations

Whole-organism cellular gene-expression atlas reveals conserved cell types in the ventral nerve cord of Platynereis dumerilii

Hernando Martínez Vergara et al. Proc Natl Acad Sci U S A. .

Abstract

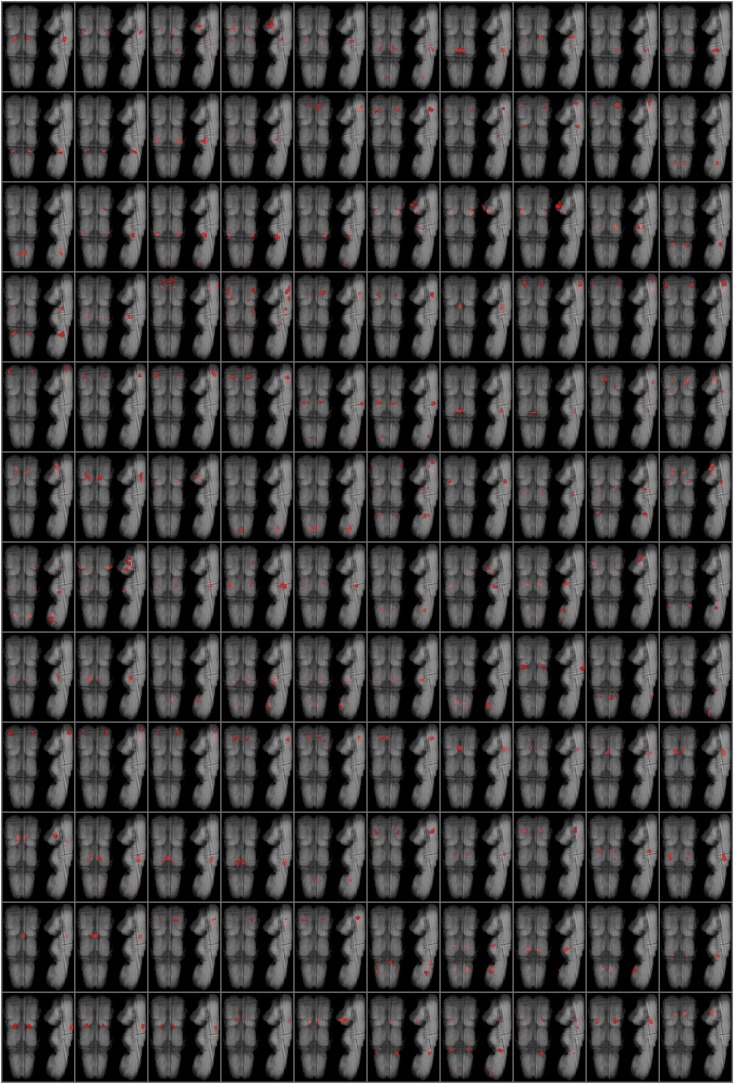
The comparative study of cell types is a powerful approach toward deciphering animal evolution. To avoid selection biases, however, comparisons ideally involve all cell types present in a multicellular organism. Here, we use image registration and a newly developed "Profiling by Signal Probability Mapping" algorithm to generate a cellular resolution 3D expression atlas for an entire animal. We investigate three-segmented young worms of the marine annelid Platynereis dumerilii, with a rich diversity of differentiated cells present in relatively low number. Starting from whole-mount expression images for close to 100 neural specification and differentiation genes, our atlas identifies and molecularly characterizes 605 bilateral pairs of neurons at specific locations in the ventral nerve cord. Among these pairs, we identify sets of neurons expressing similar combinations of transcription factors, located at spatially coherent anterior-posterior, dorsal-ventral, and medial-lateral coordinates that we interpret as cell types. Comparison with motor and interneuron types in the vertebrate neural tube indicates conserved combinations, for example, of cell types cospecified by Gata1/2/3 and Tal transcription factors. These include V2b interneurons and the central spinal fluid-contacting Kolmer-Agduhr cells in the vertebrates, and several neuron types in the intermediate ventral ganglionic mass in the annelid. We propose that Kolmer-Agduhr cell-like mechanosensory neurons formed part of the mucociliary sole in protostome-deuterostome ancestors and diversified independently into several neuron types in annelid and vertebrate descendants.

Keywords: Kolmer-Agduhr cells; ProSPr; cell-type evolution; evo-devo; gene-expression atlas.


Conflict of interest statement

The authors declare no conflict of interest.

Figures

Fig. 1.
Fig. 1.
Comparison of mediolateral patterning, morphogenesis, and molecular neuroanatomy in vertebrate and annelid. Schemes illustrate similarities and differences between vertebrate and annelid developing trunk nervous systems. Note that, because of different infolding strategies, the basal neuropil is outside of the tube in vertebrates, but inside the cord in annelids. Hatched gray, proliferative layer; Solid gray, neuropil. (A) Generalized development of the vertebrate neural tube. hb9 expression after Dichmann and Harland (46) and phox2 expression after Talikka et al. (47). White arrow in the Middle panel indicates invagination of the neural tube centered on the neural midline. Molecular anatomy of neural tube simplified after refs. and . (B) Generalized development of the annelid nerve cord. hb9 and phox2 expression after Denes et al. (9) and this study. White arrows in the Middle panel indicate the bilateral, lateral infolding of the DGM. Molecular neuroanatomy according to this study. DGM, dorsal ganglionic mass; dI, dorsal interneurons; KA, Kolmer-Agduhr; MN, motorneurons; sMN, somatic motorneurons; V, ventral interneurons; VGM, ventral ganglionic mass.
Fig. S1.
Fig. S1.
The VNC of Platynereis is mainly composed of postmitotic neurons at 6 dpf. (A and B) Panels show ventral and side projections of Platynereis VNC (dashed red box in B) at 6 dpf. (A) Cell age as determined by sequential 24-h pulses of EdU, from 2 to 6 dpf (red, EdU; blue, DAPI). (B) VNC location and RNA localization for postmitotic pan-neuronal markers (elav and synaptotagmin), and for glutamate decarboxylase (gad), used to measure PrImR and ProSPr resolution. The asterisk labels the cell used for the analysis of resolution (red, reflection microscopy; blue, DAPI). (C) Assessment of image registration of 144 hpf (equal to 6 dpf) Platynereis larvae for different imaging isotropic resolutions. gad RNA localization was used to identify a single cell in the second ganglia of the VNC (asterisk in B) in 20 animals. For every imaging resolution (x axis), the centroid of the gad cells was calculated. The dashed red horizontal line is the average diameter of a cell (calculated as the median of all of the cells segmented at 334 nm and assuming cells as spheres). The voxels per cell (vpc) are indicated on top, which show, for every imaging resolution, how many voxels (3D pixels) fit inside an average cell. (C′) The individual points represent all of the distances, in microns, between the centroids of the cells. Box plots and violin plots represent the distribution of these distances. (C′′) Distance between the gad cells centroids, and the center of mass of their spatial distribution, calculated as the median position of the 20 cells. (D) Variation of the position of the gad cells in the three dimensions and 3D representation of the location of the gad cells after the registration. They are represented as spheres with average cell diameter. In red, the centroid of the distribution. The standard size of Platynereis dumerilii larvae at 6 dpf is 280 μm in the anterio-posterior axis.
Fig. 2.
Fig. 2.
SPMs can be used to achieve single-cell resolution after image registration at 6 dpf. (A) Scheme representing the signal reconstruction process, generating SPMs. Individual animals are registered to the reference, the signal is binarized, and overlapped to generate a probability map of the spatial distribution, which is later thresholded. (B) Effect of threshold percentage and sample size on signal reconstruction, scored as the distance of the resulting 3D object center of mass to the centroid of the cell distribution (calculated by manual segmentation), and the volume of the 3D object. From the initial dataset of 20 manually segmented cells (see text and Fig. S1), random picks were made for every imaging resolution. Each point represents the distribution of centroid-center distance and volume (mean and error bars) of 1,000 random iterations. Horizontal dotted line represents the average cell radius and vertical dotted line represents the average cell volume (calculated for the population of manually segmented cells). Results for the 550 nm per pixel imaging resolution dataset in C. (C) Effect of the imaging resolution and the number of samples on the performance of the signal reconstruction process, measured as in B. (D) Plot showing, for 99 different SPMs, the decrease rate of the signal volume in relation to the threshold, and its low correlation with the sample size and the coverage of the signal, making the use of a general thresholding method based on these parameters not adequate. (E) Quantification of SPMs based on the agreement between the samples for different molecular markers.
Fig. 3.
Fig. 3.
Dissection of gene expression maps into MEDs. Schematic representation of the principle to threshold the SPMs (color-code indicates signal probability). Three-dimensional objects are automatically isolated and thresholded to approximate the amount of signal measured in the individual animals in that 3D space. As a consequence of the thresholding, new isolated 3D volumes can appear. This process is repeated for each isolated object until no further subdivision of the objects can be achieved, giving rise to MEDs.
Fig. S2.
Fig. S2.
Reference for Platynereis 6-dpf larvae. (A–D) Coronal sections from ventral to dorsal (anterior up). (A) At the level of the VNC neuropil. (B) Dorsal to the VNC, at the level of the beginning of the stomodeum. (C) At the midpoint of the stomodeum, gut, and brain neuropil. (D) At the level of the posterior part of the brain neuropil and end of the gut. (E–H) Transverse sections from anterior to posterior (ventral down). (E) At the level of the brain neuropil. (F) At the level of the stomodeum. (G) At the level of the second VNC ganglion. (H) At the level of the pygidium. (I–K) Three-dimensional views of the reference from the front, left side, and back, respectively. The standard size of Platynereis dumerilii larvae at 6 dpf is 280 μm in the anterio-posterior axis.
Fig. S3.
Fig. S3.
Automation of ProSPr method. (A) Illustration of the steps and outputs of the image analysis pipeline before registration. (Upper, Left) Bright-field panel of maximum projections of every individual in the microscopy file, indicating the ID for each individual (cropped). (Lower) Explanation of the transformations and analysis of the channels. The animal autofluorescence (enhanced for an easier appreciation) can be subtracted from the signal channel. (Upper, Right) Panel of maximum projections of the oriented enhanced signal for every individual with their respective IDs (cropped). (B) Postregistration process to binarize in situ signal. (Left) Illustration of the process of masking the samples. Registered individuals are normalized and averaged [PrImR method (26)]. This average is then thresholded (automatically or manually) to create a mask. The mask is applied to the individual samples, and for each sample, the signal is quantified inside and outside the mask for different threshold values. Images show snapshots of 3D representations for the marker tbh. (Right) Quantification of the signals and difference between them. For each threshold, the signal inside and outside the mask is measured, and the difference between these values is computed. The algorithm identifies the first maxima of the difference function to assign a threshold value to the sample. (C) Flowchart of the method ProSPr. In blue and red, the most important steps and results, respectively, of the process. The standard size of Platynereis dumerilii larvae at 6 dpf is 280 μm in the anterio-posterior axis.
Fig. S4.
Fig. S4.
Ventral and lateral projections of the expression of markers included in the atlas. (A) Transcription factors directing the mayor grouping of cells in the t-SNE (see Fig. S7). (B) Transcription factors expressed in the VNC. (C) Other transcription factors. (D) Differentiation markers. (E) Proliferation signal (EdU pulses). (F) Table showing mayor animal regions where the expression of different genes has been detected. The standard size of Platynereis dumerilii larvae at 6 dpf is 280 μm in the anterio-posterior axis.
Fig. S4.
Fig. S4.
Ventral and lateral projections of the expression of markers included in the atlas. (A) Transcription factors directing the mayor grouping of cells in the t-SNE (see Fig. S7). (B) Transcription factors expressed in the VNC. (C) Other transcription factors. (D) Differentiation markers. (E) Proliferation signal (EdU pulses). (F) Table showing mayor animal regions where the expression of different genes has been detected. The standard size of Platynereis dumerilii larvae at 6 dpf is 280 μm in the anterio-posterior axis.
Fig. 4.
Fig. 4.
Reconstruction of a cellular model from the 6 dpf Platynereis atlas. (A) Workflow of the recursive partition of hierarchical clustering to group SV into cells. (B) Manual segmentation of the reference to profile different tissues. (C) Illustration of the cellular grid to build SV (maximum projection of NBT/BCIP reflection signal in a single neuron). (D) Removal of SV with low correlation with their neighbors. (E) t-SNE of the 4,315 cells recovered by the algorithm in the segmented tissues, using all genes in the atlas. CS, cryptic segment; latEct, lateral ectoderm; Pyg, pygidium; VNC, ventral nerve cord.
Fig. 5.
Fig. 5.
Cell-type analysis on the 6 dpf Platynereis ventral nerve cord. (A) t-SNE of the VNC cells using transcription factor expression, showing cells color-coded according to how many transcription factors they show expression for. Groups of cells with high expression information have been manually selected for further analysis. (B) Hierarchical clustering and heatmap showing the genes expressed in cells in group I. Cell types have been manually defined based on the clustering and are highlighted in different colors. (C) Spatial location (frontal and lateral views of the VNC) of the cell types in group I. Transcription factors and neurotransmitters (italics) expressed in these cells are indicated in the figure. In white, genes common to the entire group; in color, those specific for the different cell types. (D) Frontal views of the VNC showing the location of the different cell types identified from the groups in A. Genes expressed in these cell types are indicated as in D.
Fig. S5.
Fig. S5.
Ventral and lateral 3D representations of the 605 VNC cells reconstructed from the atlas, and included in the analysis.
Fig. S5.
Fig. S5.
Ventral and lateral 3D representations of the 605 VNC cells reconstructed from the atlas, and included in the analysis.
Fig. S5.
Fig. S5.
Ventral and lateral 3D representations of the 605 VNC cells reconstructed from the atlas, and included in the analysis.
Fig. S5.
Fig. S5.
Ventral and lateral 3D representations of the 605 VNC cells reconstructed from the atlas, and included in the analysis.
Fig. S5.
Fig. S5.
Ventral and lateral 3D representations of the 605 VNC cells reconstructed from the atlas, and included in the analysis.
Fig. S6.
Fig. S6.
Transcription factor expression mapped on the t-SNE graph. (A) Transcription factors directing the mayor grouping of cells in the t-SNE. (B) Other transcription factors expressed in the ventral nerve cord.
Fig. S6.
Fig. S6.
Transcription factor expression mapped on the t-SNE graph. (A) Transcription factors directing the mayor grouping of cells in the t-SNE. (B) Other transcription factors expressed in the ventral nerve cord.
Fig. S6.
Fig. S6.
Transcription factor expression mapped on the t-SNE graph. (A) Transcription factors directing the mayor grouping of cells in the t-SNE. (B) Other transcription factors expressed in the ventral nerve cord.
Fig. S7.
Fig. S7.
Depiction of cell types within the VNC groups. Hierarchical clustering and heatmaps showing the genes expressed in cells in groups II to XIV (see Fig. 5). Cell types have been manually defined based on the clustering and are highlighted in different colors. Spatial locations (frontal and lateral views of the VNC) of the cell types within each group are shown.
Fig. S7.
Fig. S7.
Depiction of cell types within the VNC groups. Hierarchical clustering and heatmaps showing the genes expressed in cells in groups II to XIV (see Fig. 5). Cell types have been manually defined based on the clustering and are highlighted in different colors. Spatial locations (frontal and lateral views of the VNC) of the cell types within each group are shown.
Fig. 6.
Fig. 6.
Medio-lateral arrangement of VNC superclusters. (A) k-means clustering (seven clusters) on the VNC cells t-SNE. (B) Spatial location of the k-means superclusters found in A (ventral and lateral views of the VNC). (C, Upper) Illustration of the molecular structure of Platynereis VNC at 6 dpf mapped on the entire body plan (ventral and lateral views). (Lower, Left) Transversal section (see Top) of the reference at the level of the second VNC ganglia, indicating the ventral structures. (Lower, Right) Depiction of the major genetically defined territories in the VNC. (D) Cell expression of transcription factors Pax6, Nk6, Hb9, and Phox2 overlaid on the t-SNE graph. (E) Cell expression of transcription factors Gata1/2/3, Tal, Dbx1, Brn3, and Isl overlaid on the t-SNE graph. (F) Spatial location of four major groups of cell types compared with those in vertebrates in this study. Frontal views of the VNC showing the cells that coexpress the transcription factors indicated at the bottom.
Fig. S8.
Fig. S8.
Transition from medio-lateral to dorso-ventral arrangement in Platynereis VNC development. (A) Overlay of double whole-mount in situ hybridization showing a ventral view of the expression of hb9 and phox2 at 48 hpf. (B) Transversal section illustrating the expression of phox2 in the trunk neuroectoderm at 48 hpf. (C) Transversal section illustrating the lateral expression of phox2 in the dorsal ganglionic mass of the ventral nerve cord at 5 dpf. (Magnification: A, 250× relative to A4 printing; B and C, 370× relative to A4 printing.)

Similar articles

Cited by

References

    1. Arendt D. The evolution of cell types in animals: Emerging principles from molecular studies. Nat Rev Genet. 2008;9:868–882. - PubMed
    1. Arendt D, et al. The origin and evolution of cell types. Nat Rev Genet. 2016;17:744–757. - PubMed
    1. Tessmar-Raible K, et al. Conserved sensory-neurosecretory cell types in annelid and fish forebrain: insights into hypothalamus evolution. Cell. 2007;129:1389–1400. - PubMed
    1. Fritzsch B, Beisel KW, Pauley S, Soukup G. Molecular evolution of the vertebrate mechanosensory cell and ear. Int J Dev Biol. 2007;51:663–678. - PMC - PubMed
    1. Jacobs DK, et al. Evolution of sensory structures in basal metazoa. Integr Comp Biol. 2007;47:712–723. - PubMed

Publication types

LinkOut - more resources