. 2017 Jun 20;114(25):6456-6461.
doi: 10.1073/pnas.1704786114. Epub 2017 Jun 5.

Catalytic-site design for inverse heavy-enzyme isotope effects in human purine nucleoside phosphorylase

Affiliations

Catalytic-site design for inverse heavy-enzyme isotope effects in human purine nucleoside phosphorylase

Rajesh K Harijan et al. Proc Natl Acad Sci U S A. .

Abstract

Heavy-enzyme isotope effects (15N-, 13C-, and 2H-labeled protein) explore mass-dependent vibrational modes linked to catalysis. Transition path-sampling (TPS) calculations have predicted femtosecond dynamic coupling at the catalytic site of human purine nucleoside phosphorylase (PNP). Coupling is observed in heavy PNPs, where slowed barrier crossing caused a normal heavy-enzyme isotope effect (kchemlight/kchemheavy > 1.0). We used TPS to design mutant F159Y PNP, predicted to improve barrier crossing for heavy F159Y PNP, an attempt to generate a rare inverse heavy-enzyme isotope effect (kchemlight/kchemheavy < 1.0). Steady-state kinetic comparison of light and heavy native PNPs to light and heavy F159Y PNPs revealed similar kinetic properties. Pre-steady-state chemistry was slowed 32-fold in F159Y PNP. Pre-steady-state chemistry compared heavy and light native and F159Y PNPs and found a normal heavy-enzyme isotope effect of 1.31 for native PNP and an inverse effect of 0.75 for F159Y PNP. Increased isotopic mass in F159Y PNP causes more efficient transition state formation. Independent validation of the inverse isotope effect for heavy F159Y PNP came from commitment to catalysis experiments. Most heavy enzymes demonstrate normal heavy-enzyme isotope effects, and F159Y PNP is a rare example of an inverse effect. Crystal structures and TPS dynamics of native and F159Y PNPs explore the catalytic-site geometry associated with these catalytic changes. Experimental validation of TPS predictions for barrier crossing establishes the connection of rapid protein dynamics and vibrational coupling to enzymatic transition state passage.

Keywords: enzyme design; femtosecond dynamics; heavy enzyme; purine nucleoside phosphorylase; transition path sampling.


Conflict of interest statement

The authors declare no conflict of interest.

Figures

Fig. 1.
Fig. 1.
(A) Guanosine phosphorolysis and TS of the reaction catalyzed by human PNP. The reaction is catalyzed in an SN1-like mechanism via a ribocationic TS. α-d-Ribose 1-phosphate and guanine are the products. DADMe–ImmG is a TS analog with a picomolar dissociation constant for human PNP. (B) Stereoview of the catalytic site of PNP–DADMe–ImmG–PO4 crystal structure including residues Asn243, His257, and the position of Phe159, contributed from the neighboring monomer.
Fig. S1.
Fig. S1.
Steady-state kinetics curves for guanosine phosphorolysis catalyzed by light (blue) and heavy (red) PNPs. A shows enzyme kinetics curves for wild-type PNPs, and B shows for F159Y PNPs. All PNPs showed kinetic parameters within experimental error for the phosphorolysis of guanosine in Michaelis–Menten kinetics analysis.
Fig. S2.
Fig. S2.
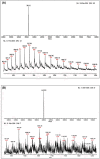
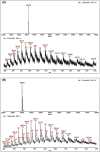
LC-ESI-MS analysis of light (A) and heavy (B) wild-type PNPs. The masses were 36,112 Da for native PNP and 40,028 Da for heavy PNP to give a 10.8% increase in mass for the labeled enzyme.
Fig. S3.
Fig. S3.
LC-ESI-MS analysis of light (A) and heavy (B) F159Y PNPs. The masses were 36,128 Da for light F159Y PNP and 40,025 Da for heavy F159Y PNP to give a 10.7% increase in mass for the labeled enzyme.
Fig. 2.
Fig. 2.
Projections of histogrammed densities of the structures along all reaction trajectories on the plane of the O5′–O4′ oxygen distance vs. bond-breaking (BB)–bond-forming (BF) distance, for native light PNP (A), native heavy PNP (B), light F159Y PNP (C), and heavy F159Y PNP (D). The “terrain” color map (green for “plains,” i.e., zero density, up to white for “mountains,” i.e., maximum density of structures) represents the allocation of a pair of the above distances among structures along the reaction path. Contour maps that join points with equal density have also been drawn.
Fig. S4.
Fig. S4.
Projections of histogrammed densities of the structures along all reaction trajectories on the plane of the OD1(Asn243)–N7(guanosine) distance vs. the difference of bond-breaking (BB)–bond-forming (BF) distances for heavy F159Y (A) and light F159Y (B). The “terrain” color map (green for “plains”, i.e., zero density, up to white for “mountains”, i.e., maximum density of structures) represents the allocation of a pair of the above distances among structures along the reaction path. Contour maps that join points with equal density have also been drawn.
Fig. 3.
Fig. 3.
Representative averaged stopped-flow traces for single-turnover experiments of wild-type (A) and F159Y PNP mutant (B) for guanosine phosphorolysis with 15 μM PNP catalytic-site concentration and 5 μM guanosine in 50 mM phosphate (Materials and Methods). Single turnovers were obtained. In A, the blue trace is light native PNP, and the red trace is heavy PNP. In B, the blue trace is light F159Y PNP, and the red trace is heavy F159Y PNP. The traces of A were fitted to a double-exponential fit, where the fast phase reports the catalytic-site chemistry rate (kchem) followed by a slower conformational change affecting guanine fluorescence (15). The traces of B were fitted to a single exponential corresponding to the rate of guanine formation. The curves are offset for clarity. The catalytic-site enzyme chemistry rates of light and heavy PNPs are summarized in Table 2.
Mechanism 1.
Mechanism 1.
Guanosine isotope partition experiment for F159Y PNP. [1'-14C]Guanosine (Guo*) bound to F159Y PNP partitions to product α-d-[1-14C] ribose 1-phosphate (R1P) by k5 or is released unchanged by steps k2 + k4 + k7 when mixed with excess unlabeled guanosine (Guo) and inorganic phosphate (Pi). The fraction of bound Guo* converted to product (Y) is given by the equation (25). The values for k5 are obtained independently from pre–steady-state kinetics (Fig. 3B). The value for Y is obtained from the isotope partition experiment.
Fig. S5.
Fig. S5.
Chemoenzymatic synthesis scheme of [1′-14C]guanosine synthesis. The starting material of the reaction was [1-14C]ribose. The radiolabeled carbon is highlighted with red color. The yield of the synthesized [1′-14C]guanosine was 92% from labeled ribose. The abbreviations of the enzymes use in the synthesis are as follows: AP, alkaline phosphatase; GK, guanylate kinase; HGPRT, hypoxanthine-guanine phophoribosyltransferase; MK, myokinase; NDK, nucleoside diphosphate kinase; PK, pyruvate kinase; PRPPS, phosphoribosyl-α-1-pyrophosphate synthetase; RK, ribokinase.
Fig. S6.
Fig. S6.
The PNP-guanosine dissociation constant (Kd) calculation curve for light F159Y PNP (A) and heavy F159Y PNP (B). The isotope-trapping method was used to calculate Kd for PNPs–guanosine complex.
Fig. 4.
Fig. 4.
Experimental data of [1′-14C]guanosine trapping in the Michaelis complex of PNPs. The ordinate shows the amount of bound reactant committed to product formation in the phosphorolysis of guanosine by PNPs. Equilibrated mixtures of 25 μM PNPs and 80 μM [1′-14C]guanosine (Fig. S5) were mixed with excess guanosine and phosphate at time = 0. The amount of [1′-14C]guanosine converted to [1-14C]α-d-ribose 1-phosphate was extrapolated to t = 0 and compared with the initial PNP-[1′-14C]guanosine concentration to calculate Y of Table 2. Guanosine commitment for light and heavy native PNP are shown in A and B, respectively. Guanosine commitment for light and heavy F159Y PNP are shown in C and D, respectively. The values of Y and Cf are summarized in Table 2.
Fig. 5.
Fig. 5.
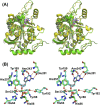
The crystal structure and subunit–subunit interaction of PNP in complex with DADMe–ImmG and inorganic phosphate. (A) The crystal structure of trimeric human PNP. (B) The omit (Fo − Fc) difference electron density map of the DADMe–ImmG structure at 3.0σ contour level. The (Fo − Fc) difference maps were calculated after 15 cycles of omit refinement by REFMAC5, leaving out the subunit B active-site DADMe–ImmG ligand. The DADMe–ImmG of subunit B (yellow color), bound at the active site, is also surrounded by subunit C (blue color). (C) Superposition of active site residues of wild type (cyan; PDB ID code 3PHB) and F159Y PNP (green; PDB ID code 5UGF) PNPs bound to the TS-analog DADMe–ImmG. New hydrogen bonds appearing as a consequence of the F159Y substitution are shown as dashed lines to Tyr159 and Tyr88. A stereoview version of C is shown in Fig. S7.
Fig. S7.
Fig. S7.
The crystal structure of F159Y PNP (single subunit) in complex with TS-analog DADMe–ImmG. (A) Stereoview of the superposition of the overall fold of F159Y PNP complex with DADMe–ImmG (green) with wild-type PNP complex with DADMe–ImmG (yellow) and unliganded wild-type PNP (gray). There are no significant structural difference observed between wild-type and F159Y PNP complex with DADMe–ImmG structure. (B) Stereoview of active-site residues of wild-type (cyan; PDB ID code 3PHB) and F159Y mutant (green; PDB ID code 5UGF) PNPs bound to the TS-analog DADMeImmG. The new hydrogen bond appearing after mutation of F159Y PNP is shown between Tyr159 and Tyr88.
Fig. S8.
Fig. S8.
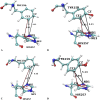
Representative TS structures of interacting residues in the active site of Light F159Y (A) and Heavy F159Y (B).
Fig. S9.
Fig. S9.
Geometrical properties comparison between residues F159/Y159 and H257 at the TS of representative trajectories of Native PNP (A)–Light F159Y (B), Native Heavy PNP (C)–Heavy F159Y (D).

Similar articles

Cited by

References

    1. Núñez S, Wing C, Antoniou D, Schramm VL, Schwartz SD. Insight into catalytically relevant correlated motions in human purine nucleoside phosphorylase. J Phys Chem A. 2006;110:463–472. - PubMed
    1. Silva RG, Murkin AS, Schramm VL. Femtosecond dynamics coupled to chemical barrier crossing in a Born-Oppenheimer enzyme. Proc Natl Acad Sci USA. 2011;108:18661–18665. - PMC - PubMed
    1. Suarez J, Schramm VL. Isotope-specific and amino acid-specific heavy atom substitutions alter barrier crossing in human purine nucleoside phosphorylase. Proc Natl Acad Sci USA. 2015;112:11247–11251. - PMC - PubMed
    1. Antoniou D, Ge X, Schramm VL, Schwartz SD. Mass modulation of protein dynamics associated with barrier crossing in purine nucleoside phosphorylase. J Phys Chem Lett. 2012;3:3538–3544. - PMC - PubMed
    1. Zoi I, et al. Modulating enzyme catalysis through mutations designed to alter rapid protein dynamics. J Am Chem Soc. 2016;138:3403–3409. - PMC - PubMed

Publication types

LinkOut - more resources