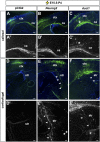
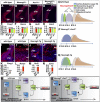
. 2017 Jun 20;114(25):E4934-E4943.
doi: 10.1073/pnas.1701495114. Epub 2017 Jun 5.

Neurog2 and Ascl1 together regulate a postmitotic derepression circuit to govern laminar fate specification in the murine neocortex

Affiliations

Neurog2 and Ascl1 together regulate a postmitotic derepression circuit to govern laminar fate specification in the murine neocortex

Daniel J Dennis et al. Proc Natl Acad Sci U S A. .

Abstract

A derepression mode of cell-fate specification involving the transcriptional repressors Tbr1, Fezf2, Satb2, and Ctip2 operates in neocortical projection neurons to specify six layer identities in sequence. Less well understood is how laminar fate transitions are regulated in cortical progenitors. The proneural genes Neurog2 and Ascl1 cooperate in progenitors to control the temporal switch from neurogenesis to gliogenesis. Here we asked whether these proneural genes also regulate laminar fate transitions. Several defects were observed in the derepression circuit in Neurog2-/-;Ascl1-/- mutants: an inability to repress expression of Tbr1 (a deep layer VI marker) during upper-layer neurogenesis, a loss of Fezf2+/Ctip2+ layer V neurons, and precocious differentiation of normally late-born, Satb2+ layer II-IV neurons. Conversely, in stable gain-of-function transgenics, Neurog2 promoted differentiative divisions and extended the period of Tbr1+/Ctip2+ deep-layer neurogenesis while reducing Satb2+ upper-layer neurogenesis. Similarly, acute misexpression of Neurog2 in early cortical progenitors promoted Tbr1 expression, whereas both Neurog2 and Ascl1 induced Ctip2. However, Neurog2 was unable to influence the derepression circuit when misexpressed in late cortical progenitors, and Ascl1 repressed only Satb2. Nevertheless, neurons derived from late misexpression of Neurog2 and, to a lesser extent, Ascl1, extended aberrant subcortical axon projections characteristic of early-born neurons. Finally, Neurog2 and Ascl1 altered the expression of Ikaros and Foxg1, known temporal regulators. Proneural genes thus act in a context-dependent fashion as early determinants, promoting deep-layer neurogenesis in early cortical progenitors via input into the derepression circuit while also influencing other temporal regulators.

Keywords: derepression circuit; laminar fate specification; neocortex; proneural genes; temporal identity.


Conflict of interest statement

The authors declare no conflict of interest.

Figures
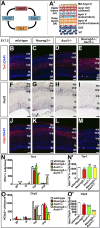
Fig. 1.
Fig. 1.
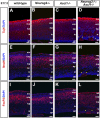
Expansion of layer VI and loss of layer V identities in Neurog2−/−;Ascl1−/− cortices. (A) Model of cross-repressive interactions among Tbr1, Fezf2, Satb2, and Ctip2. (A′) Model of the laminar organization of the neocortex, showing expression domains for Tbr1+ (orange, layer VI), Fezf2+/Ctip2+ (blue, layer V), and Satb2+ (red, layers II–IV). Red boxes mark upper and lower bins for quantitation. (BM) Expression of Tbr1 (BE), Fezf2 (FI), and Ctip2 (JM) in E17.5 wild-type, Neurog2−/−, Ascl1−/−, and Neurog2−/−;Ascl1−/− cortices. Blue is DAPI counterstain. Yellow arrowheads mark neuronal aggregates at the ventricular surface in E and M. (NO′) Quantitation of Tbr1+ (N and N′) and Ctip2+ (O and O′) neurons in each cortical zone and in total. *P < 0.05; **P < 0.01; ***P < 0.005; ns, not significant. gz, germinal zone; iz, intermediate zone; lcp, lower cortical plate; mz, marginal zone; ucp, upper cortical plate. (Scale bars: 50 μm.)
Fig. S1.
Fig. S1.
Neurog2 and Ascl1 are both expressed in a subset of cortical progenitors throughout the neurogenic period. (A) Schematic illustration of a coronal hemisection of an E12.5 mouse telencephalon, depicting the site of analysis. (BF′′) Coimmunolabeling of E10.5 (BB′′), E12.5 (CD′′), and E15.5 (EF′′) coronal sections with anti-Neurog2 (red) and anti-Ascl1 (green). Insets in BB′′ show 4× magnification views. DD′′ are 2× magnification images of C, and FF′′ are 4× magnification images of E. Arrowheads mark cells that coexpress Neurog2 and Ascl1. ctx, neocortex; lge, lateral ganglionic eminence; mge, medial ganglionic eminence. (Scale bars: 50 μm.)
Fig. S2.
Fig. S2.
Neurons aggregate at the ventricular surface, and an expansion of layer VI neuronal identities is seen in Neurog2−/−;Ascl1−/− cortices. (AL) Expression of Tuj1 (AD), NeuN (EH), and FoxP2 (IL) in E17.5 wild-type (A, E, and I), Neurog2−/− (B, F, and J), Ascl1−/− (C, G, and K), and Neurog2−/−;Ascl1−/− (D, H, and L) cortices. Yellow arrowheads in D, H, and L mark neurons that aggregate near the ventricular surface. Asterisks mark the missing subplate in Neurog2−/− (F) and Neurog2−/−;Ascl1−/− (H) cortices. gz, germinal zone; iz, intermediate zone; lcp, lower cortical plate; mz, marginal zone; sp, subplate; ucp, upper cortical plate. (Scale bars: 50 μm.)
Fig. 2.
Fig. 2.
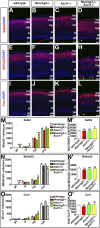
Upper-layer neurons expand into the lower CP in Neurog2−/−;Ascl1−/− cortices. (AL) Expression of Satb2 (AD), Bhlhe22 (EH), and Cux1 (IL) in E17.5 wild-type, Neurog2−/−, Ascl1−/−, and Neurog2−/−;Ascl1−/− cortices. Blue is DAPI counterstain. Yellow arrows mark neuronal aggregates at the ventricular surface in D, H, and L. (MO′) Quantitation of Satb2+ (M and M′), Bhlhe22+ (N and N′), and Cux1+ (O and O′) neurons in each cortical zone and in total. *P < 0.05; **P < 0.01; ***P < 0.005; ns, not significant. gz, germinal zone; iz, intermediate zone; lcp, lower cortical plate; mz, marginal zone; ucp, upper cortical plate. (Scale bars: 50 μm.)
Fig. 3.
Fig. 3.
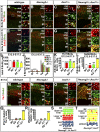
Altered timing of deep- and upper-layer neurogenesis in Neurog2−/−;Ascl1−/− cortices. (A–H) E12.5 to E17.5 BrdU birthdating showing colabeling with BrdU and Tbr1 (A–D) or Satb2 (E–H) in wild-type, Neurog2−/−, Ascl1−/−, and Neurog2−/−;Ascl1−/− cortices. Insets at the right are 4× magnified views of the regions depicted in white boxes. White arrows mark double-positive cells. Yellow arrowheads mark ectopic BrdU+ cells at the ventricular surface of Neurog2−/−;Ascl1−/− cortices in D and H. (I and J) Quantitation of the total number of BrdU+ cells (I) and the number of BrdU+ cells per cortical zone (J). (K and L) Quantitation of the percentage of BrdU+ cells labeled at E12.5 that coexpress Tbr1 (K) and Satb2 (L). (MP) Coexpression of Tbr1 and Satb2 in E17.5 wild-type, Neurog2−/−, Ascl1−/−, and Neurog2−/−;Ascl1−/− cortices. White arrows mark double-positive cells in the 4× magnification panels on the right. (Q and R) Quantitation of the number of Tbr1+ (Q) and Satb2+ (R) neurons as a ratio of total Tbr1+ and Satb2+ neurons, respectively. (S and T) Depiction of laminar distribution in wild-type, Neurog2−/−, and Ascl1−/− (S) and Neurog2−/−;Ascl1−/− (T) cortices. *P < 0.05; **P < 0.01; ***P < 0.005; ns, not significant. gz, germinal zone; iz, intermediate zone; lcp, lower cortical plate; mz, marginal zone; ucp, upper cortical plate. (Scale bars: 50 μm.)
Fig. S3.
Fig. S3.
Altered migration patterns of late-born neurons in Neurog2−/− and Neurog2−/−;Ascl1−/− cortices. (AH) E14.5 to E17.5 BrdU birthdating showing colabeling of BrdU with Satb2 (AD) and Tbr1 (EH) in wild-type (A and E), Neurog2−/− (B and F), Ascl1−/− (C and G), and Neurog2−/−;Ascl1−/− (D and H) cortices. Insets to the right show 4× magnified views of the regions in white boxes. White arrows mark double-positive cells. Yellow arrowheads mark ectopic BrdU+ cells at the ventricular surface of Neurog2−/−;Ascl1−/− (D) cortices. (I and J) Quantitation of the total number of BrdU+ cells (I) and BrdU+ cells per cortical zone (J). *P < 0.05; **P < 0.01; ***P < 0.005; ns, not significant. gz, germinal zone; iz, intermediate zone; lcp, lower cortical plate; mz, marginal zone; ucp, upper cortical plate. (Scale bars: 50 μm.)
Fig. S4.
Fig. S4.
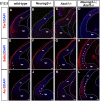
Upper-layer markers are precociously expressed in E12.5 Neurog2−/−;Ascl1−/− cortices. (AL) Expression of Tbr1 (AD), Satb2 (EH), and activated caspase 3 (Ac-3) (IL) in E12.5 wild-type (A, E, and I), Neurog2−/− (B, F, and J), Ascl1−/− (C, G, and K), and Neurog2−/−;Ascl1−/− (D, H, and L) cortices. Arrowheads in E, G, and H mark extent of Satb2 expression domain. Note that apparent red labeling outside the white outline of the cortex in EH is background pial staining. Arrowheads in J and L mark apoptotic cells. cx, neocortex; lge, lateral ganglionic eminence. (Scale bars: 100 μm.)
Fig. 4.
Fig. 4.
Influence of Neurog2 and Ascl1 on corticofugal and callosal projections. (AD) Expression of TAG1 in E17.5 wild-type (A), Neurog2−/− (B), Ascl1−/− (C), and Neurog2−/−;Ascl1−/− (D) cortices. Blue is DAPI counterstain. Arrows in AC mark corticofugal axons entering the ventral telencephalon. The asterisk in D marks premature truncation of corticofugal axons. (EH′) Anterograde labeling of corticofugal axons with DiI injection in the rostral cortex (E, F, G, and H) and traced into the ventrobasal nucleus (E′, F′, G′, and H′) in E17.5 wild-type (E and E′), Neurog2−/− (F and F′), Ascl1−/− (G and G′), and Neurog2−/−;Ascl1−/− (H and H′) cortices. Asterisks mark the absence of anterograde labeling of the thalamus in Neurog2−/− (F′) and Neurog2−/−;Ascl1−/− (H′) cortices. (IL) Expression of L1 in E17.5 wild-type (I), Neurog2−/− (J), Ascl1−/− (K), and Neurog2−/−;Ascl1−/− (L) cortices. Blue is DAPI counterstain. Asterisks in K mark Probst bundles. Arrowheads in J and L mark misguided, defasciculated axon tracts. (MP) Expression of GFAP in E17.5 wild-type (M), Neurog2−/− (N), Ascl1−/− (O), and Neurog2−/−;Ascl1−/− (P) cortices. Arrowheads in O and P mark the loss of midline glia. ca, callosal axons; ctx, neocortex; gw, glial wedge; ic, internal capsule; igg, indusium griseum glia; iz, intermediate zone; mzg, midline zipper glia; vb, ventrobasal complex. (Scale bars: 250 μm in AH and E′H′ and 100 μm in IP.)
Fig. S5.
Fig. S5.
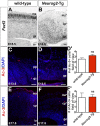
Generation of a conditional Neurog2 gain-of-function mouse line. (A) Strategy to generate Neurog2-Tg. (B and B′) Spatially restricted Foxg1-cre activity at E12.5, monitored with Rosa-GFP. (C) Amplification of Neurog2-Tg transcript. (D and D′) Neurog2 expression in E13.5 wild-type (D) and Neurog2-Tg (D′) cortices. (E and E′) Whole-mount views of E13.5 wild-type (E) and Neurog2-Tg (E′) heads (telencephalons are false-colored green). (F and F′) H&E staining of E13.5 wild-type (F) and Neurog2-Tg (F′) cortices. (Scale bars: 50 μm in D and D′; 250 μm in E and E′; 300 μm in B, B′, F, and F′.) dTEL, dorsal telencephalon; LGE, lateral ganglionic eminence; MGE, medial ganglionic eminence; PP, preplate; VZ, ventricular zone.
Fig. 5.
Fig. 5.
Increased early neurogenesis and decreased late neurogenesis in E17.5 Neurog2-Tg cortices. (AC) Early neurogenesis in Neurog2-Tgs. Expression of Tbr1 (A and A′) and Ctip2 (B and B′) at E13.5 and Satb2 (C and C′) at E15.5 in wild-type and Neurog2-Tg cortices. Quantitation of Tbr1+ (A′′ and A′′′), Ctip2+ (B′′ and B′′′), and Satb2+ (C′′ and C′′′) neurons in total and as the percent of marker+/DAPI+ cells. (DJ) Late neurogenesis in Neurog2-Tgs. (D and D′) Whole-mount views of E17.5 wild-type (D) and Neurog2-Tg (D′) brains (telencephalons false-colored green). (E and E′) H&E staining of E17.5 wild-type (E) and Neurog2-Tg (E′) telencephalons. (FJ′) Expression of Tbr1 (F and F′), Ctip2 (G and G′), Satb2 (H and H′), Cux1/2 (I and I′), and Brdu/Ctip2 (J and J′) in E17.5 cortices. (F′′I′′′) Quantitation of Tbr1+ (F′′ and F′′′), Ctip2+ (G′′ and G′′′), Satb2+ (H′′ and H′′′), and Cux1/2+ (I′′ and I′′′) cells in total and as the percent of marker+/DAPI+ cells. (J′′ and J′′′) Quantitation of BrdU+ (J′′) and BrdU+Ctip2+/BrdU+ (J′′′) cells. The asterisks in the images mark aberrant marginal zones and cortical plates. *P < 0.05; **P < 0.01; ***P < 0.005. CP, cortical plate; dTEL, dorsal telencephalon; GZ, germinal zone; lCP, lower cortical plate; IZ, intermediate zone; MZ, marginal zone; PP, preplate; SVZ, subventricular zone; uCP, upper cortical plate; vTEL, ventral telencephalon; VZ, ventricular zone. (Scale bars: 50 μm in A–C′ and FJ′, 250 μm in E and E′, and 400 μm in D and D′.)
Fig. S6.
Fig. S6.
Expression of Fezf2 and activated caspase 3 in Neurog2-Tgs. (A and B) Expression of Fezf2 in E15.5 wild-type (A) and Neurog2-Tg (B) cortices. (CF) Expression of activated caspase-3 (Ac-3) in E13.5 (C and D) and E17.5 (E and F) wild-type and Neurog2-Tg cortices. (D′ and F′) Quantification of Ac-3+ cells at E13.5 (D′) and E17.5 (F′). Asterisks denote aberrant marginal zone and CP in Neurog2-Tgs. cp, cortical plate; gz, germinal zone; iz, intermediate zone; mz, marginal zone; ns, not significant; pp, preplate. (Scale bars: 50 μm.)
Fig. 6.
Fig. 6.
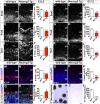
Altered progenitor cell dynamics in Neurog2-Tgs. (AL) Expression of Sox2 (AD), Pax6 (EH), and Tbr2 (IL) in E13.5 (A, B, E, F, I, and J) and E17.5 (C, D, G, H, K, and L) wild-type and Neurog2-Tg cortices. (B′, D′, F′, H′, J′, and L′) Quantitation of total number of Sox2+ (B′ and D′), Pax6+ (F′ and H′), and Tbr2+ (J′ and L′) cells at E13.5 and E17.5. (MP) Expression of BrdU (M and N) and pHH3 (O and P) in E13.5 wild-type and Neurog2-Tg cortices. (N′ and P′) Quantitation of total BrdU+ cells (N′) and the percent of pHH3+ cells in basal domains (P′). (Q and R) E13.5 wild-type and Neurog2-Tg cortices injected with BrdU at E12.5, and labeled with NeuN and BrdU. (R′) Quantitation of the percent of NeuN+BrdU+/BrdU+ cells. (ST) Primary neurospheres from E13.5 wild-type and Neurog2-Tg cortical progenitors. (T′) Quantitation of the percent of primary neurospheres from E13.5 wild-type and Neurog2-Tg cortical progenitors. *P < 0.05; **P < 0.01; ***P < 0.005; ns, not significant. CP, cortical plate; GZ, germinal zone; IZ, intermediate zone; PP, preplate; VZ, ventricular zone. (Scale bars: 50 μm.)
Fig. 7.
Fig. 7.
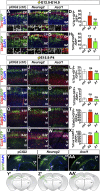
Neurog2 and Ascl1 promote corticofugal molecular identities in early but not in late cortical progenitors. (AH) Expression of Tbr1 (red, AC) and Ctip2 (red, EG) in cortices electroporated with pCIG2 (A and E), Neurog2 (B and F), and Ascl1 (C and G) at E12.5 and dissected at E14.5. (D and H) Quantitation of Tbr1 (D) and Ctip2 (H) expression in GFP+ electroporated cortical cells. (IZ and AA) E15.5 to P4 electroporations of pCIG2 (I, M, Q, U, and Y), Neurog2 (J, N, R, V, and Z), and Ascl1 (K, O, S, W, and AA) costained with GFP and Tbr1 (red, IK), Ctip2 (red, MO), Satb2 (red, QS), or Cux1 (red, UW) or showing GFP+ axonal tracts (green, Y, Z, and AA). (L, P, T, and X) Quantitation of Tbr1 (L), Ctip2 (P), Satb2 (T), and Cux1 (X) expression in GFP+ electroporated cortical cells. (Y′, Z′, and AA′) Schematic illustrations of axonal tracts in pCIG2 (Y′), Neurog2 (Z′), and Ascl1 (AA′) misexpressing neurons from E15.5 to P4 electroporations. Blue is DAPI counterstain in all panels. Y, Z, and AA show multiple merged images to cover the entire hemisphere. Arrowheads mark callosal and corticofugal projections. *P < 0.05; **P < 0.01; ns, not significant. ca, callosal axons; cf, corticofugal; CP, cortical plate; ctx, cortex; GZ, germinal zone; str, striatum. (Scale bars: 50 μm in AC and EG; 100 μm in IK, MO, QS, and UW; and 200 μm in Y, Z, and AA.)
Fig. S7.
Fig. S7.
Overexpression of proneural genes increases early-born neuronal fates. (AC) Expression of activated caspase-3 (Ac-3) in E12.5→E13.5 electroporations of cortices transfected with pCIG2 (A), Neurog2 (B), and Ascl1 (C). (D) Quantification of GFP+Ac-3+ cells. (EK) Expression of Tbr1 (red, EG) and Ctip2 (red, IK) in cortices electroporated with pCIG2 (E and I), Neurog2 (F and J), and Ascl1 (G and K) at E12.5 and dissected at E13.5. Lower panels are 1.5× magnification images of the boxed area in the larger panel. (H and L) Quantification of ectopic Tbr1 (H) and Ctip2 (L) expression in GFP+ electroporated cortical cells. *P < 0.05; **P < 0.01; ns, not significant. PP, preplate; VZ, ventricular zone. (Scale bars: 50 μm.)
Fig. S8.
Fig. S8.
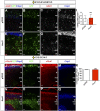
Overexpression of proneural genes does not alter neurotransmitter phenotypes. (AH) Expression of GAD1 (red) in E12.5 to E14.5/E15.5 cortical electroporations of pCIG2 (AD) and Ascl1 (EH). (I) Quantification of the number of GAD1+GFP+Ctip2+ cells. (JQ) Expression of vGlut1 in E12.5 to E14.5 cortical electroporations of pCIG2 (JM) and Ascl1 (N–Q). (R) Quantification of the number of vGlut1+GFP+Ctip2+ cells. cp, cortical plate; iz, intermediate zone; ns, not significant; svz, subventricular zone; vz, ventricular zone. (Scale bars: 50 μm.)
Fig. S9.
Fig. S9.
Neurog2 and Ascl1 overexpression in late cortical progenitors perturbs axonal trajectories. (AF). E15.5 to P4 in utero electroporation of pCIG2 (A, A′, D, and D′), Neurog2 (B, B′, E, and E′), and Ascl1 (C, C′, F, and F′). The asterisks in C and C′ mark defasciculated axons in the midline. Arrowheads in E, E′, F, and F′ mark aberrant corticofugal projections. (Scale bars: 200 μm in AC; 100 μm in A′C′; 150 μm in DF; and 75 μm in D′F′.)
Fig. 8.
Fig. 8.
Neurog2 and Ascl1 regulate the expression of temporal fate determinants. (AD) Foxg1 expression in E12.5 wild-type (A), Neurog2−/− (B), Ascl1−/− (C), and Neurog2−/−;Ascl1−/− (D) cortices. (EH) RT-qPCR analysis of Foxg1 (E), Ikzf4 (F), Rnf2 (G), and Ezh2 (H). (IJ′) Foxg1 expression in E12.5 wild-type (I and I′) and Neurog2-Tg (J and J′) cortices. I′ and J′ are 4× magnification images of I and J. (KN) RT-qPCR analysis of Foxg1 (K), Ikaros (L), Rnf2 (M), and Ezh2 (N). (OQ) Schematic of laminar fate transitions in wild-type (O), Neurog2−/−;Ascl1−/− (P), and Neurog2-Tg (Q) cortices. (R and S) Tbr1–Fezf2–Satb2–Ctip2 negative feedback loop in wild-type (R) and Neurog2−/−;Ascl1−/− (S) cortices. *P < 0.05; **P < 0.01; ***P < 0.005; ns, not significant. dTel, dorsal telencephalon; lge, lateral ganglionic eminence; pp, preplate; vTel, ventral telencephalon; vz, ventricular zone. (Scale bars: 100 μm in AD, I, and J; 50 μm in I′ and J′.)

Similar articles

Cited by

References

    1. Toma K, Hanashima C. Switching modes in corticogenesis: Mechanisms of neuronal subtype transitions and integration in the cerebral cortex. Front Neurosci. 2015;9:274. - PMC - PubMed
    1. Srinivasan K, et al. A network of genetic repression and derepression specifies projection fates in the developing neocortex. Proc Natl Acad Sci USA. 2012;109:19071–19078. - PMC - PubMed
    1. Hevner RF, et al. Tbr1 regulates differentiation of the preplate and layer 6. Neuron. 2001;29:353–366. - PubMed
    1. McKenna WL, et al. Tbr1 and Fezf2 regulate alternate corticofugal neuronal identities during neocortical development. J Neurosci. 2011;31:549–564. - PMC - PubMed
    1. Han W, et al. TBR1 directly represses Fezf2 to control the laminar origin and development of the corticospinal tract. Proc Natl Acad Sci USA. 2011;108:3041–3046. - PMC - PubMed

Publication types

Substances

Grants and funding