. 2017 Jun 20;114(25):E4996-E5005.
doi: 10.1073/pnas.1701201114. Epub 2017 Jun 5.

Dynamic changes in murine forebrain miR-211 expression associate with cholinergic imbalances and epileptiform activity

Affiliations

Dynamic changes in murine forebrain miR-211 expression associate with cholinergic imbalances and epileptiform activity

Uriya Bekenstein et al. Proc Natl Acad Sci U S A. .

Abstract

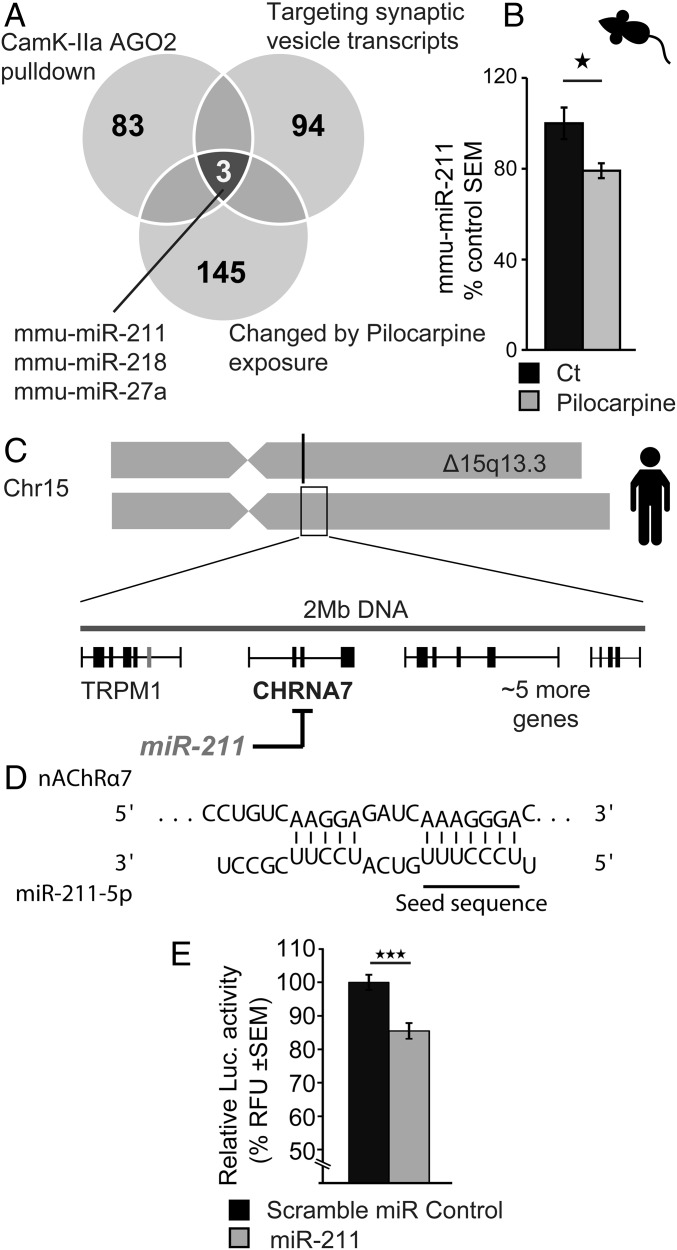
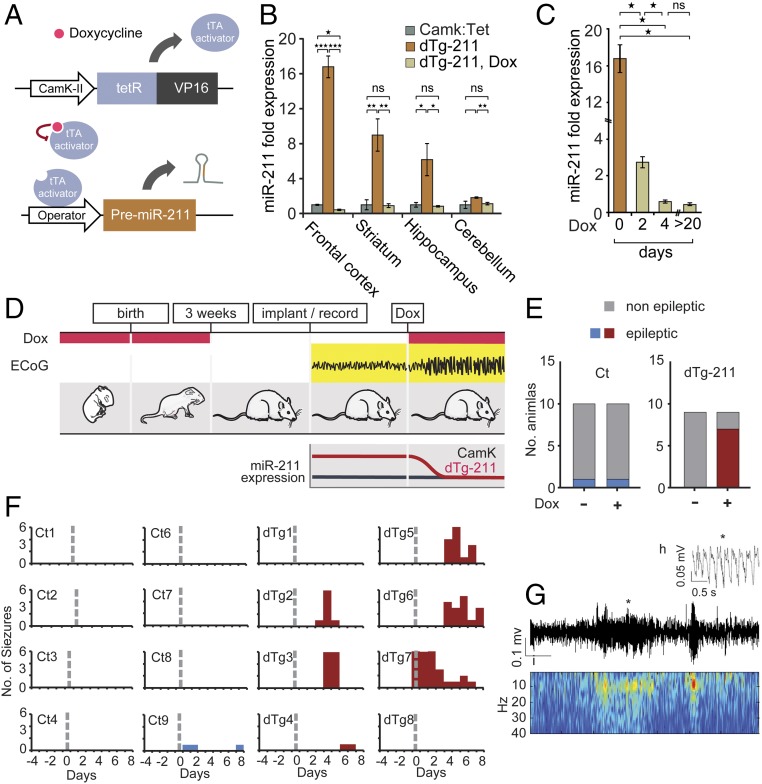
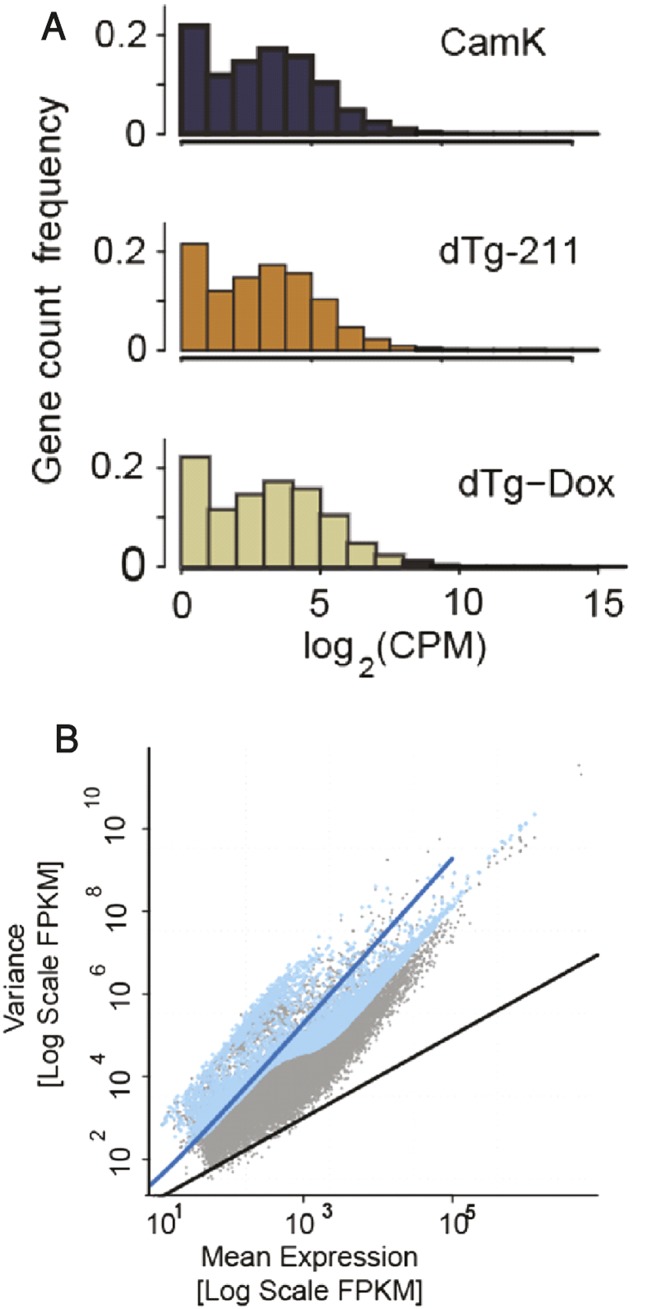
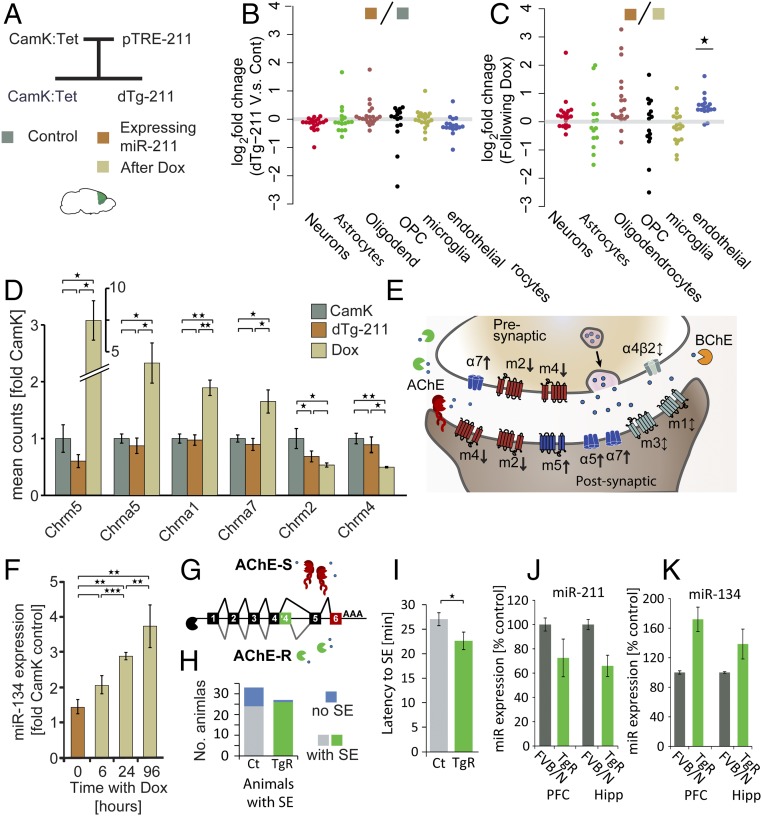
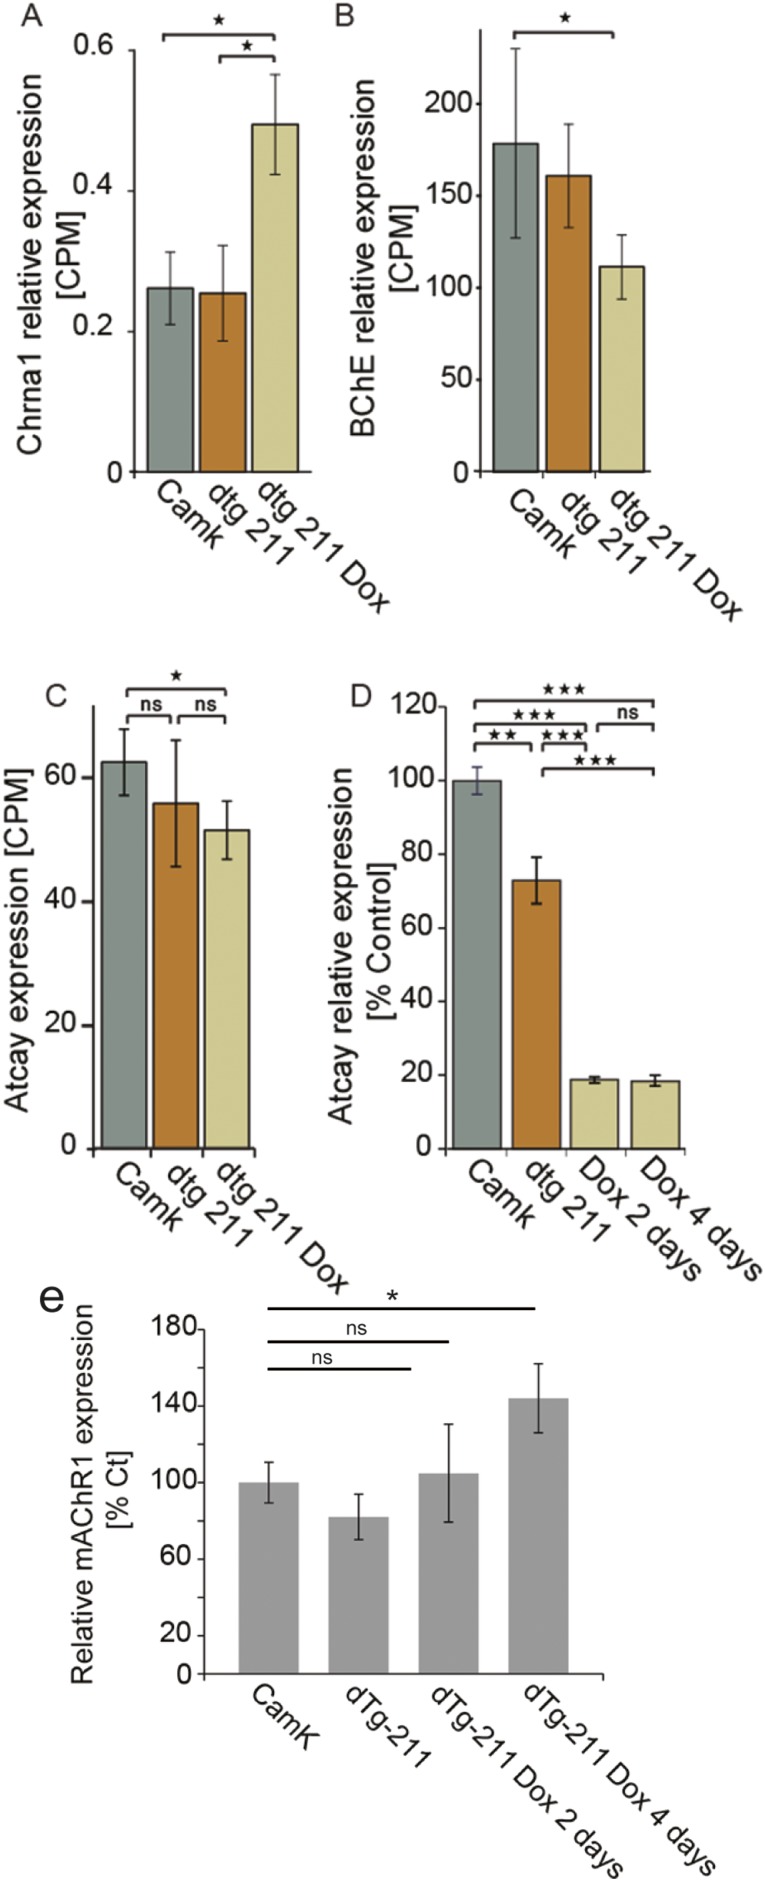
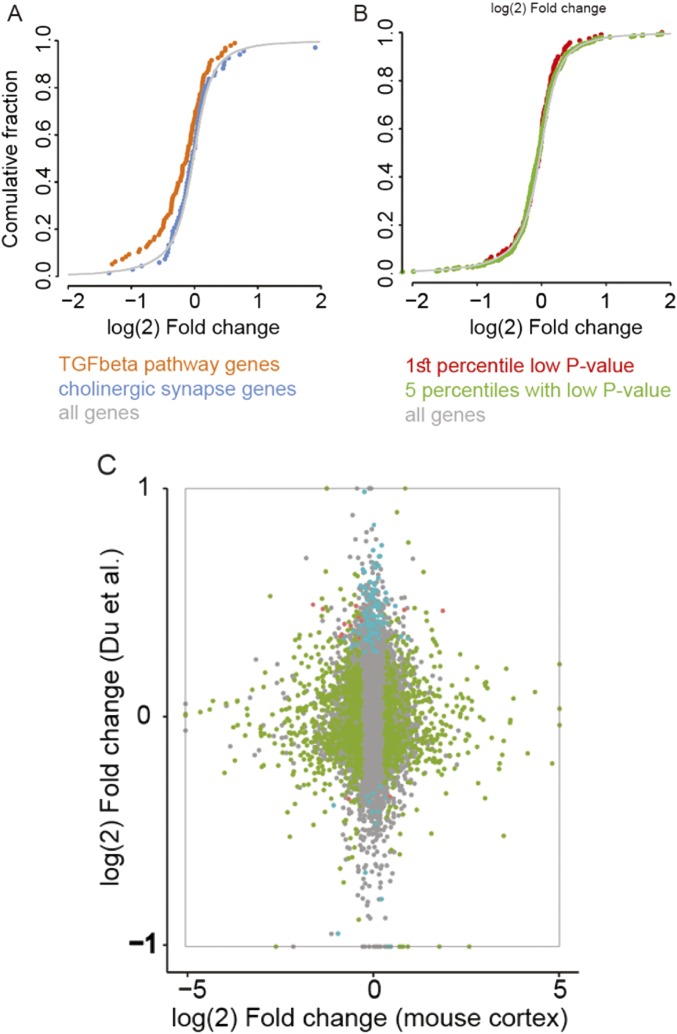
Epilepsy is a common neurological disease, manifested in unprovoked recurrent seizures. Epileptogenesis may develop due to genetic or pharmacological origins or following injury, but it remains unclear how the unaffected brain escapes this susceptibility to seizures. Here, we report that dynamic changes in forebrain microRNA (miR)-211 in the mouse brain shift the threshold for spontaneous and pharmacologically induced seizures alongside changes in the cholinergic pathway genes, implicating this miR in the avoidance of seizures. We identified miR-211 as a putative attenuator of cholinergic-mediated seizures by intersecting forebrain miR profiles that were Argonaute precipitated, synaptic vesicle target enriched, or differentially expressed under pilocarpine-induced seizures, and validated TGFBR2 and the nicotinic antiinflammatory acetylcholine receptor nAChRa7 as murine and human miR-211 targets, respectively. To explore the link between miR-211 and epilepsy, we engineered dTg-211 mice with doxycycline-suppressible forebrain overexpression of miR-211. These mice reacted to doxycycline exposure by spontaneous electrocorticography-documented nonconvulsive seizures, accompanied by forebrain accumulation of the convulsive seizures mediating miR-134. RNA sequencing demonstrated in doxycycline-treated dTg-211 cortices overrepresentation of synaptic activity, Ca2+ transmembrane transport, TGFBR2 signaling, and cholinergic synapse pathways. Additionally, a cholinergic dysregulated mouse model overexpressing a miR refractory acetylcholinesterase-R splice variant showed a parallel propensity for convulsions, miR-211 decreases, and miR-134 elevation. Our findings demonstrate that in mice, dynamic miR-211 decreases induce hypersynchronization and nonconvulsive and convulsive seizures, accompanied by expression changes in cholinergic and TGFBR2 pathways as well as in miR-134. Realizing the importance of miR-211 dynamics opens new venues for translational diagnosis of and interference with epilepsy.

Keywords: EEG; acetylcholinesterase; cholinergic; epilepsy; microRNA.


Conflict of interest statement

The authors declare no conflict of interest.

Figures

Fig. 1.
Fig. 1.
Identifying MiR-211 as a synaptic candidate associated with cholinergic signaling-induced seizures. (A) Three candidate miRs (miR-211, -218, and -27a) emerged by intersecting rodent miRs whose levels modify following exposure to the cholinergic facilitator pilocarpine (145 miRs) (6); interact with the RNA-induced silencing complex (RISC) protein Argonaute 2 (AGO2) in CamK2a-expressing cells (83 miRs) (25); and target synaptic vesicle transcripts (94 miRs) (75), predicting involvement in cholinergic-related epileptic seizures. (B) qRT-PCR measurements show mmu-miR-211 decline in hippocampal RNA 24 h following exposure to pilocarpine. (C) Human MiR-211, as well as its in silico target, nicotinic nAChRα7, and five other genes localize to a 15q13.3 chromosomal region where heterozygote deletions entail cognitive impairments with recurrent seizures. (D) The seed domain of hsa-miR-211-5p shows sequence complementarity with the inflammation-regulating nicotinic nAChRα7. (E) Luciferase assay validated direct targeting by miR-211 of nAChRα7 in human embryonic kidney cells. Results were considered significant at *P < 0.05, ***P < 0.001, after correction for multiple testing when applicable.
Fig. 2.
Fig. 2.
dTg-211 mice develop spontaneous nonconvulsive seizures following Dox-induced reduction of forebrain miR-211 excess. (A) DTg-211 mice carry the CamK2a promoter, followed by a tTA coding sequence and a pTRE-transgene inducing Dox-suppressible expression of mmu-miR-211 in forebrain neurons. (B) MiR-211 overexpression in the mouse forebrain but not cerebellum is Dox suppressible. Expression normalized to CamK controls. (C) Dox-suppressed miR-211 levels decline to basal levels within days. (D) DTg-211 mice were administered Dox before and after birth, preventing transgene overexpression during development. ECoG recordings in dTg-211, but not control, mice showed synchronous neuronal cortical activity after Dox treatment, parallel to declined miR-211 levels. (E) DTg-211 mice presented ECoG-recorded seizures exclusively after Dox administration. (F) ECoG plots showing number of seizures per day in single dTg-211 mice and controls (red, blue). Dashed gray line marks initiation of Dox administration. (G) Representative ECoG recording plot shows a seizure of a Dox-exposed dTg-211 mouse; corresponding heat map shows representative higher-power seizure of low-frequency oscillations (∼5 Hz) at the same time window. (H) Magnification of a single event (marked by asterisk in G), presenting an enlarged section of the seizure activity, with spike and wave form. Results were considered significant at *P < 0.05, **P < 0.01, ***P < 0.001, after correction for multiple testing when applicable. ns, not significant.
Fig. 3.
Fig. 3.
Dox-treated dTg-211 mice show sustained susceptibility to PTZ-induced convulsions alongside TGFBR-associated gene changes in RNA sequence. (A) Scheme of PTZ injection 4 d after 5-d Dox administration, aimed to examine long-term susceptibility to this convulsant. See Fig. S3 for increased manual convulsions index scores in dTg-211 mice. (B) ECoG recording shows larger spikes per minute counts, reflecting seizure susceptibility in PTZ-exposed dTg-211 mice compared with CamK controls. (C) Number of seizures. (D) Latency to first spike. (E) Number of seizure events by neuronal networks analysis. (F) Latency to first seizure. (G) DTg-211 mice regained miR-211 overexpression after Dox removal, at the time of PTZ test. (H) Luciferase validation tests of miR-211 targeting of the murine TGFBR2 3′-UTR but not a control sequence. (I) Reduced TGFBR2 protein concentration (twofold) in dTg-211 frontal cortex (ELISA, n = 7 + 7, P < 0.001). (J) Increased TGFBR2 mRNA levels following Dox administration. (K) Fold-change volcano plot differences for dTg-211 with/without Dox (Right) compared with dTg-211/CamK brains (Left). Dots represent genes, with positive or negative twofold change (orange), passing cutoff threshold for significance (red), both (green), or unmodified (black). (L) ECDF plots show differential expression (P values) following Dox of reduced (orange) but not elevated genes (green) in dTg-211 cortices or in all genes (gray). (M) Cortical genes up-regulated in dTg-211 are reduced (red) following Dox compared with (N) all genes. (O) Per-gene fold changes following Dox for TGF-β–signaling genes modified 12 h following status epilepticus (38). Results were considered significant at *P < 0.05, **P < 0.01, ***P < 0.001, after correction for multiple testing when applicable. ns, not significant.
Fig. S1.
Fig. S1.
dTg-211 mice with reduced forebrain miR-211 levels show higher susceptibility to PTZ-mediated seizures. (A) dTg-211 mice showed higher convulsive scores following PTZ injection, after a Dox administration paradigm. (B) Sequence complementarity of the murine TGFBR2 3′-UTR and the seed sequence of mmu-miR-211-5p, in a conserved 8-mer binding site (TargetScan, PCT = 0.46). (C) Frontal cortex samples of non–Dox-treated dTg-211 showed reduction of TGFBR2 transcript levels by RT-qPCR. ***P < 0.001.
Fig. S2.
Fig. S2.
RNA sequencing quality checks. (A) Illumina-compatible cDNA libraries show overall similar sequencing depth and distribution across expression level. (B) Tag-wise normalized variance predictably correlated to expression levels.
Fig. S3.
Fig. S3.
Forebrain miR-211 targets are preferentially modulated under miR-211 decline. Target transcripts of miR-211, as predicted in silico by the TargetScan algorithm (37) and grouped by MRE site type, showed mild albeit significant modification under miR-211 decline, with increased probability depending on site length following Dox administration; ECDF plot.
Fig. 4.
Fig. 4.
MiR suppression in dTg-211 mice alters cell type marker genes and cholinergic receptors, and a cholinergic mouse model shows concordant miR changes alongside increased seizure susceptibility. (A) Experimental setup: CamK:TtA mice bred with Tg-pTRE-211 mice generated dTg-211 mice and littermate CamK controls. Illumina-compatible libraries from frontal cortex RNA of mice before or under doxycycline (color-coded squares) were sequenced. (B) Sustained cell-type marker (39) in dTg brains. (C) Elevated endothelial marker genes following Dox. (D) Modified muscarinic and nicotinic cholinergic receptors in Dox-treated dTg-211 brains. (E) Scheme of cholinergic receptors and regulators (shown in D) in brain cholinergic synapses. Note Dox-induced down-regulation of cholinergic receptors suppressing synaptic transmission: CHRM2 and CHRM4 (m2 and m4); and up-regulation of facilitators CHRM5 (m5), CHRNA5, and CHRNA7 (α5 and α7). (F) MiR-134 up-regulation in dTg-211 mice following Dox administration parallels the time frame of seizure induction in this model. (G) Scheme of the synaptic and nonsynaptic AChE transcript variants and corresponding protein forms. (H) Mice overexpressing the nonsynaptic cholinergic enzyme AChE-R (TgR) (76) show higher propensity with (I) shorter latency for status epilepticus event following pilocarpine injection, alongside (J) miR-211 reduction and (K) miR-134 elevation in prefrontal cortex (PFC) and hippocampus (Hipp) of TgR mice. Results were considered significant at *P < 0.05, **P < 0.01, ***P < 0.001, after correction for multiple testing when applicable.
Fig. S4.
Fig. S4.
Bidirectional cholinergic gene changes under forebrain miR-211 decline. (A) Increased alpha-1 neuronal nicotinic receptor (Chrna1) and (B) BChE following Dox administration in the forebrain of dTg-211 mice. (C and D) Decrease of ATCAY/BNIP-H expression with Dox administration (RNA-seq and qRT-PCR, respectively). (E) Muscarinic acetylcholine receptor M1 (mAChR1) is elevated in dTg-211 mice 4 d following Dox administration. Results were considered significant at *P < 0.05, **P < 0.01, ***P < 0.001, after correction for multiple testing when applicable. ns, not significant.
Fig. 5.
Fig. 5.
Protein–protein interaction network of Dox-induced differentially expressed synaptic vesicle and cholinergic genes. (A) Protein–protein interaction-based interconnected network of stringently defined 134 differentially expressed node genes and overall 427 genes. (B) Fold changes ± SEM of the synaptic vesicle cycle pathway genes within the network. (C) Fold changes ± SEM of the cholinergic synapse genes within the network. (D and E) Enriched biological process GO terms for PPI networks for genes differentially expressed following Dox, either down or up. (Fold enrichment, asterisks denote significance P value based on permutation analysis. Results were considered significant at *P < 0.05, **P < 0.01, ***P < 0.001, after correction for multiple testing when applicable.)
Fig. S5.
Fig. S5.
MiR-211 decline exerts distinct RNA-seq changes from those of Dox administration. (A) In cultured cells (84) TGF-β pathway genes (red), but not cholinergic synapse genes (green), show down-regulation following Dox administration. (B) In the frontal cortex of dTg-211 mice following Dox administration, genes most differentially expressed in the Du et al. (84) dataset [first (red) and five upper (green) percentiles low P value in ref. 84] show similar distribution of up- and down-regulation as all genes. (C) Genes modified in cultured cells following Dox are unchanged in the forebrain of dTg-211 mice administered with Dox. Shown is a scatterplot of per-gene fold change following Dox in both experiments. Dots represent genes: gray, unmodified; green, modified in the mouse forebrain; blue, modified in cells; red, modified in both. Note very few genes along the diagonal, and few genes to be modified in both experiments.
Fig. 6.
Fig. 6.
Mmu-miR-211–expressing mice show reduced memory abilities in the Morris water maze, and hsa-miR-211 is overexpressed in Alzheimer’s disease patient brains. (A) PANTHER classification of GO shows Dox-induced enrichment of differentially expressed gene groups, mainly regulation (Reg.) of neuron-related pathways in the dTg-211 brain transcripts (Methods). (B) Time to reach platform in the Morris water maze shows reduced learning ability in the first and second training days for dTg-211 mice. (C) Search strategy scores divided by trials and days for individual dTg-211 and CamK mice. Fewer trials of dTg-211 mice in the last days showed focal or directed strategy. (D) Loss of preference of the platform quadrant, reflecting impaired reference memory for dTg-211 compared with CamK mice in probe trials. (E) Higher miR-211 levels (∼twofold) in postmortem Alzheimer’s entorhinal cortices (73) compared with nondemented controls, n = 7 each, P < 0.05, Student’s t test. Results were considered significant at *P < 0.05, **P < 0.01, ***P < 0.001, after correction for multiple testing when applicable. ns, not significant.
Fig. S6.
Fig. S6.
DTg-211 mice do not show elevated anxiety. (A) No difference in time spent in open and closed arms of the elevated plus maze for dTg-211 compared with controls. (B) No difference in the fraction of time spent moving. (C) In the open field test, dTg mice showed no difference in time spent in border of the maze or (D) overall distance moved. (E) Temporal lobe samples from Alzheimer’s disease (AD) patients show hsa-miR-211 levels comparable to those of individuals without AD symptoms (CNT) or nondemented individuals with increased postmortem-observed BRAAK indexes (PATH nonD).

References

    1. Moshé SL, Perucca E, Ryvlin P, Tomson T. Epilepsy: New advances. Lancet. 2015;385:884–898. - PubMed
    1. Obermeier B, Daneman R, Ransohoff RM. Development, maintenance and disruption of the blood-brain barrier. Nat Med. 2013;19:1584–1596. - PMC - PubMed
    1. Pitkänen A, et al. Advances in the development of biomarkers for epilepsy. Lancet Neurol. 2016;15:843–856. - PubMed
    1. Pitkänen A, Roivainen R, Lukasiuk K. 2015. Development of epilepsy after ischaemic stroke. Lancet Neurol, 10.1016/S1474-4422(15)00248-3.
    1. Levy C, et al. Intronic miR-211 assumes the tumor suppressive function of its host gene in melanoma. Mol Cell. 2010;40:841–849. - PMC - PubMed

Publication types