. 2017 Jun 6;114(23):5800-5807.
doi: 10.1073/pnas.1610617114.

Bcl11b and combinatorial resolution of cell fate in the T-cell gene regulatory network

Affiliations

Bcl11b and combinatorial resolution of cell fate in the T-cell gene regulatory network

William J R Longabaugh et al. Proc Natl Acad Sci U S A. .

Abstract

T-cell development from hematopoietic progenitors depends on multiple transcription factors, mobilized and modulated by intrathymic Notch signaling. Key aspects of T-cell specification network architecture have been illuminated through recent reports defining roles of transcription factors PU.1, GATA-3, and E2A, their interactions with Notch signaling, and roles of Runx1, TCF-1, and Hes1, providing bases for a comprehensively updated model of the T-cell specification gene regulatory network presented herein. However, the role of lineage commitment factor Bcl11b has been unclear. We use self-organizing maps on 63 RNA-seq datasets from normal and perturbed T-cell development to identify functional targets of Bcl11b during commitment and relate them to other regulomes. We show that both activation and repression target genes can be bound by Bcl11b in vivo, and that Bcl11b effects overlap with E2A-dependent effects. The newly clarified role of Bcl11b distinguishes discrete components of commitment, resolving how innate lymphoid, myeloid, and dendritic, and B-cell fate alternatives are excluded by different mechanisms.

Keywords: Bcl11b; E2A; Notch-delta signaling; PU.1; commitment.


Conflict of interest statement

The authors declare no conflict of interest.

Figures
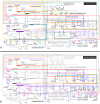
Fig. 1.
Fig. 1.
GRN model of the early T-cell specification network using BioTapestry format (62). (A) Relationships among genes active in phase 1 (ETP to DN2a stages). Active genes and connections are in color, inactive ones in gray. Both “AND” logic and “OR” logic relationships between inputs and target genes are included. Thick links: validated direct effects. Regular links: perturbation evidence, at least indirect. Dashed links: weaker or uncertain effects. Circles at intersections: path branch points. The off/on dichotomy in the display does not capture gradations in expression, and note that negative effects at many of the repressive nodes here represent “soft” damping repression rather than silencing (see numbered notes below). A reciprocal antagonism circuit between Notch and PU.1 that maintains T-cell differentiation in phase 1 is in the upper left quadrant. (B) Relationships among genes active in phase 2 (DN2b and later), after effects of Bcl11b are manifest and the phase 1 regulatory genes are silenced. Numbers indicate specific connection properties as follows. 1: Notch signals and PU.1 activity modulate each other. Notch signaling inhibits a gene-specific subset of PU.1 activities, here called “Notch-inhibited PU.1 activity”. 2: Repression by PU.1 is more severe if Notch signal is absent. 3, 5, 6, 8, and 9: Soft repression, i.e., indicated input limits the maximal activity of target gene but does not silence its expression. Also, 3: Inferred from response to forced PU.1 expression. 4: Complex conditional and soft repressions: see SI Appendix, Supplementary Text. 5: Delayed activation in high IL-7. 6: Soft repression by Tcf7 short isoforms. 7: Nfil3 can activate Id2 but is unlikely to explain the transient Id2 in some DN2b cells. 8: Soft repression of distal Runx3 promoter. 9: Soft repression by E proteins. See SI Appendix, Supplementary Text for details.
Fig. 2.
Fig. 2.
The T-cell developmental system and experimental design. (A) Stages in T-cell development and branch point affected by loss of Bcl11b. For definition of markers, see ref. . (B) Expression levels of important regulatory factors in early T cells, as measured by RNA-seq. (8). (C) Brief workflow of RNA-seq data processing and SOM analysis. (D) Comparison of two deletion protocols for Bcl11bf/f samples to test the impact of Bcl11b loss in early T development. (D1) In protocol I, Cre is introduced before T-cell development is started, by retroviral transduction in precursors that then develop as indicated on OP9-DLL1 stroma. (D2) In protocol II, Cre is activated in adult thymic DN3 cells after commitment, either by Lck-Cre activity in vivo or by tamoxifen induction of Cre-ERT2 in purified DN3 thymocytes in vitro, then culturing cells for 3–4 more days before analysis (SI Appendix, Supplementary Methods).
Fig. 3.
Fig. 3.
Bcl11b targets and SOM analysis of their organization in distinct regulomes. (A) ChIP-seq shows Bcl11b binding in DN3 cells to a repression target, Id2 (Upper), and a Bcl11b-dependent target, Dntt (Lower). Two independent samples each of Bcl11b ChIP and control (1% of input) are shown aligned to the mm9 mouse genome. Red arrows: primary transcription units of Id2 and Dntt, respectively. [Scale bars: 20 kb (Upper), 100 kb (Lower).] Vertical scales: 0.02–1.0 fpm. (B) Specific Bcl11b binding in vivo to target gene regulatory sites. ChIP for Bcl11b was analyzed by qPCR for enrichment of candidate regulatory sequences of Zbtb16, Tnni1, Dntt, and Cd3d. No binding was seen to Igk, Gapdh, and Il4 negative control sites. Averages from three independent experiments are shown (error bars: SD). (C) Fold-change SOM, color-coded to show normal gene-expression changes from the DN1 to DN2b stage. Red regions contain genes up-regulated in DN2b pro-T cells. Blue regions: genes down-regulated. For delimitation of SOM metaclusters, see SI Appendix, Fig. S9A. Four representative metaclusters—112, 168, 212, and 26 (SI Appendix, Fig. S10)—are labeled with arrows. The heatmap shows fold-change of average fragments per kilobase of transcript per million mapped reads (FPKM) within each unit, in logarithmic scale. (D) Fold-change SOM comparing Bcl11b KO DN2 and control DN2-3 pro-T cells. Red units are up-regulated after Bcl11b KO. (E) Fold-change SOM comparing PU.1 antagonist-expressing and control DN2 pro-T cells. Red units are up-regulated in PU.1 antagonist-expressing cells, blue units are repressed. (F) Genes up-regulated in E2A−/− DN2 pro-T cells from ref. , mapped onto the SOM metaclusters. Note high similarity with pattern of red (enriched) clusters in D. (G) Genes down-regulated in E2A−/− DN2 cells, mapped onto the SOM. Note overlap with certain cluster regions that are blue (depleted) in D. (H) Heatmap of hypothesis tests. The metaclusters with significant enrichment of the differentially expressed genes are displayed in red, and those that are significantly depleted are in blue. The color scale corresponds to the P value of the enrichment/depletion of differential genes in each metacluster. Dashed lines shown the location of the four representative metaclusters. An expanded version is in SI Appendix, Fig. S12A.
Fig. 4.
Fig. 4.
GRN model of roles of Bcl11b and E2A in the T-cell specification gene network. BioTapestry plots use conventions as in Fig. 1. Targets shown are from the gold-standard list and additional genes validated as shown in SI Appendix, Figs. S2, S3C, S4, and S11, and represent sets with shared and unshared responses to Bcl11b and E2A. They include genes with likely impact on the rest of the network that are concentrated in Bcl11b-repressed metaclusters in the SOM analysis. Additional genes with similar expression properties identified by SOM cluster membership are noted in the text.

References

    1. Kueh HY, et al. Asynchronous combinatorial action of four regulatory factors activates Bcl11b for T cell commitment. Nat Immunol. 2016;17(8):956–965. - PMC - PubMed
    1. Li P, et al. Reprogramming of T cells to natural killer-like cells upon Bcl11b deletion. Science. 2010;329(5987):85–89. - PMC - PubMed
    1. Li L, Leid M, Rothenberg EV. An early T cell lineage commitment checkpoint dependent on the transcription factor Bcl11b. Science. 2010;329(5987):89–93. - PMC - PubMed
    1. Ikawa T, et al. An essential developmental checkpoint for production of the T cell lineage. Science. 2010;329(5987):93–96. - PubMed
    1. Yui MA, Rothenberg EV. Developmental gene networks: A triathlon on the course to T cell identity. Nat Rev Immunol. 2014;14(8):529–545. - PMC - PubMed

Publication types