. 2017 Jun 20;114(25):6498-6503.
doi: 10.1073/pnas.1609996114. Epub 2017 Jun 5.

Future of fundamental discovery in US biomedical research

Affiliations

Future of fundamental discovery in US biomedical research

Michael Levitt et al. Proc Natl Acad Sci U S A. .

Abstract

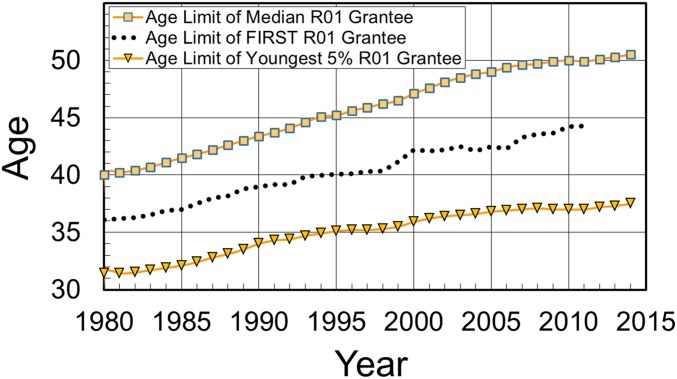
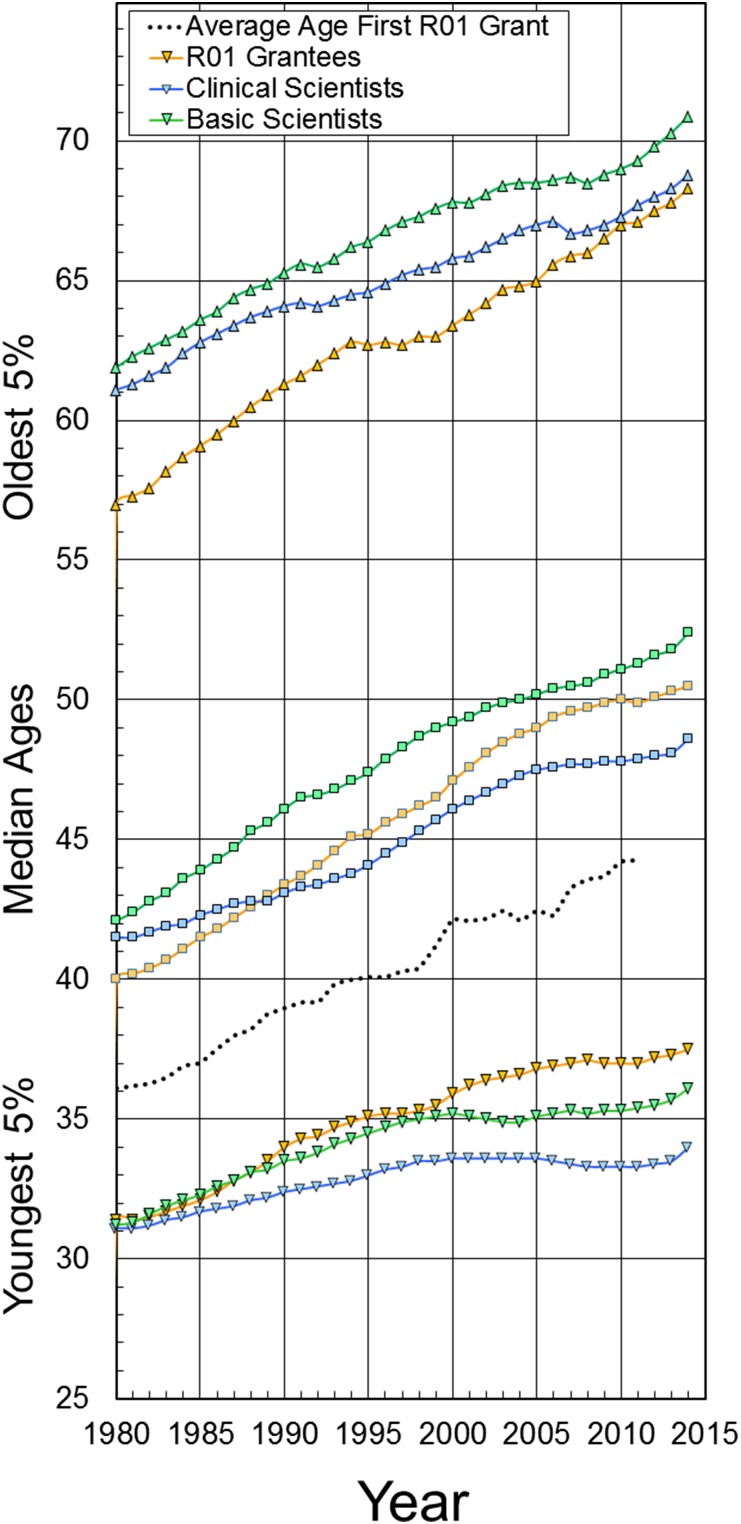
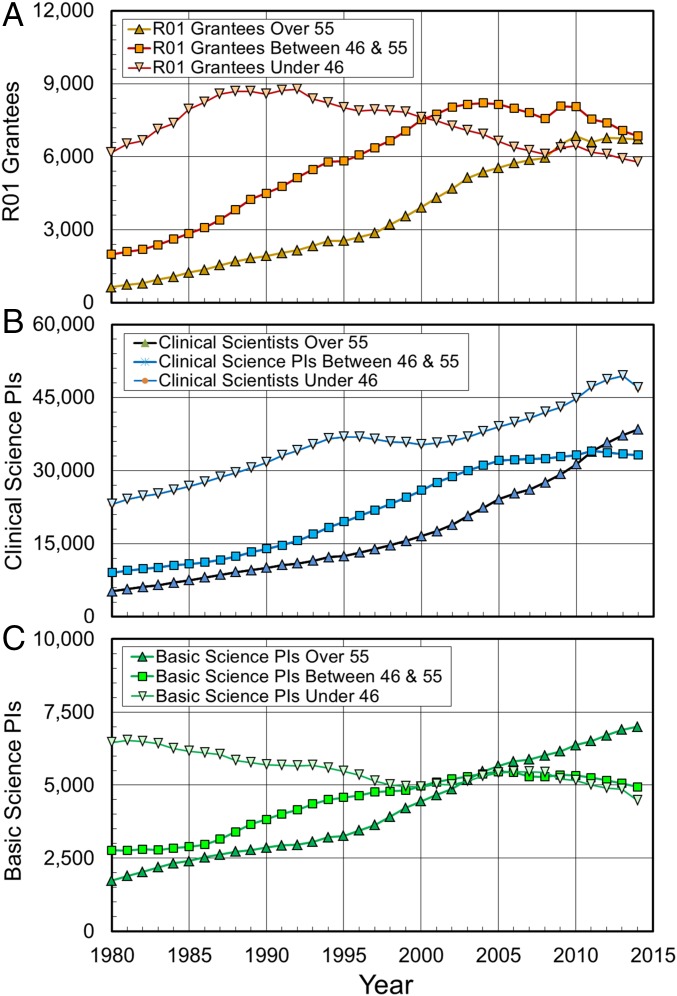
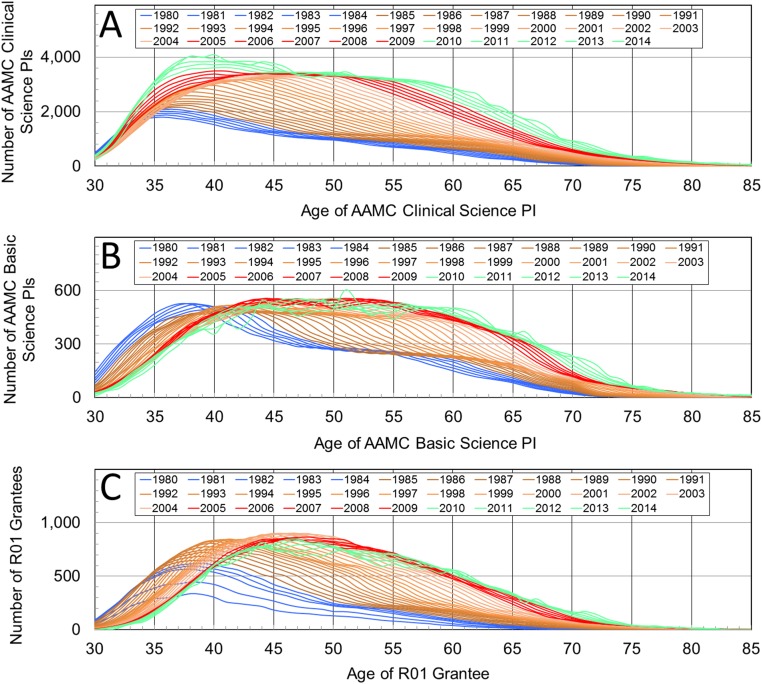
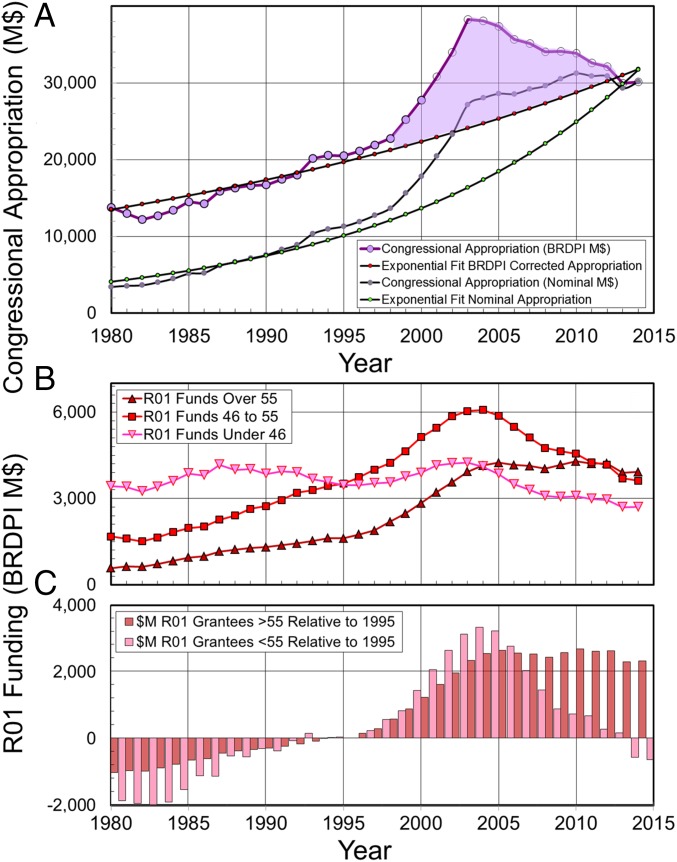
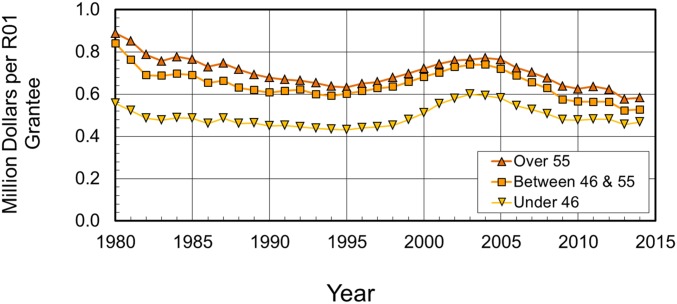
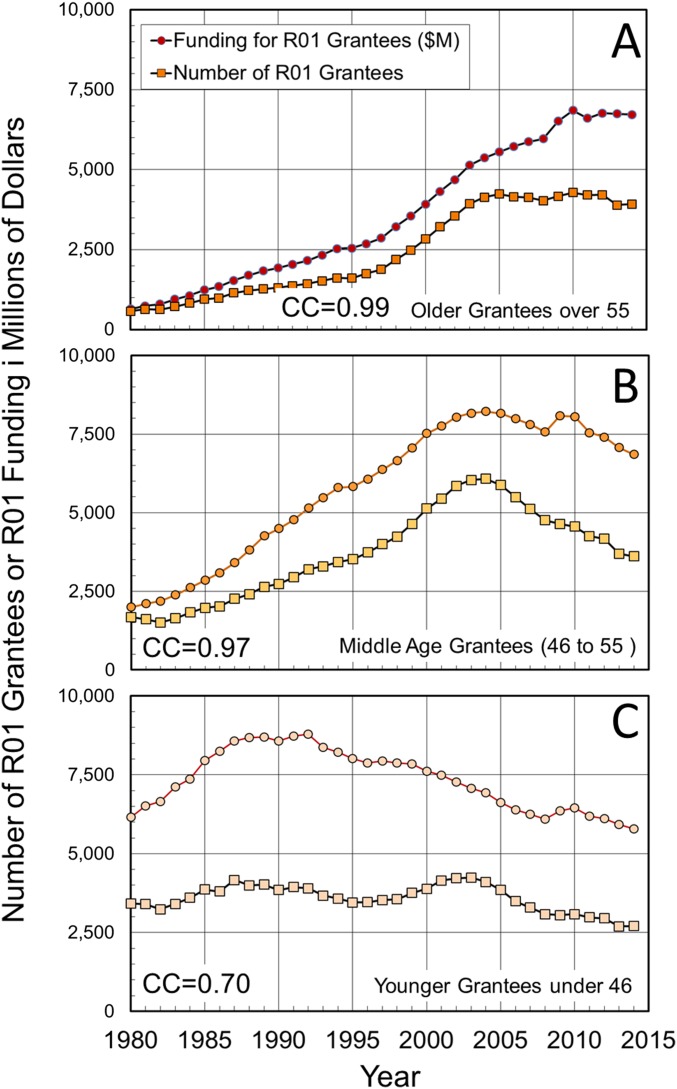
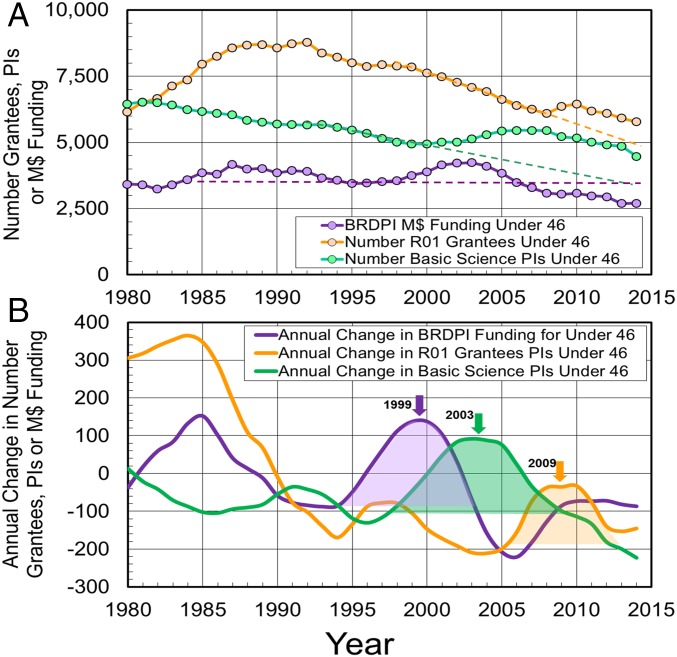
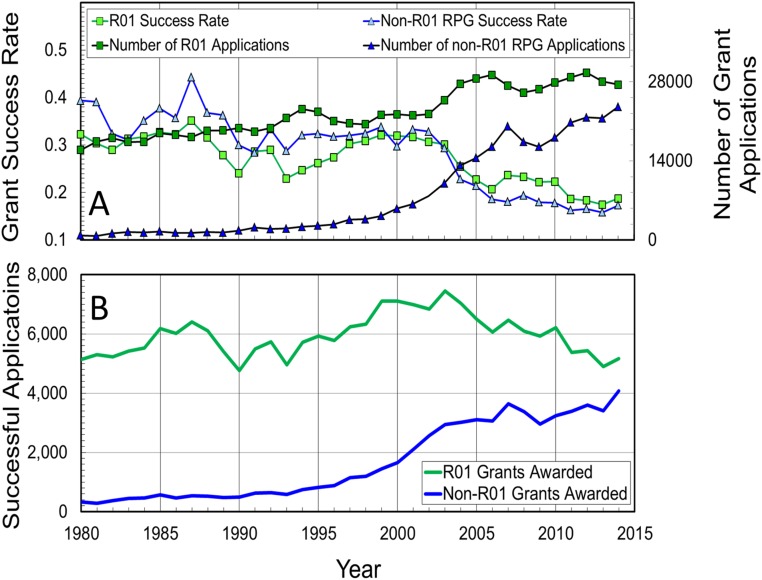
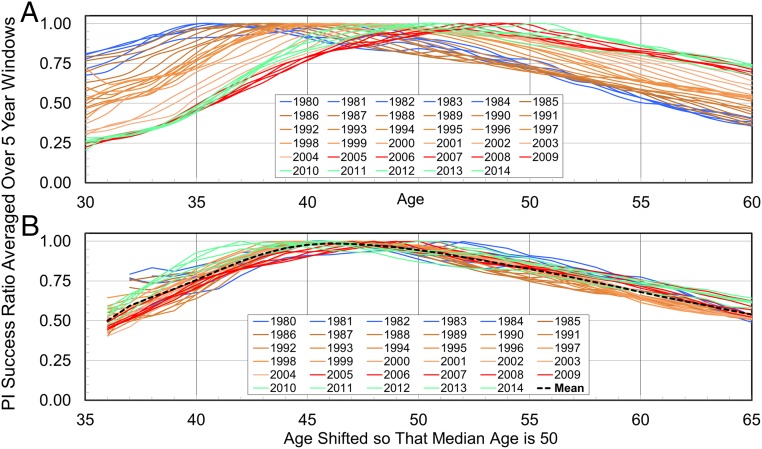
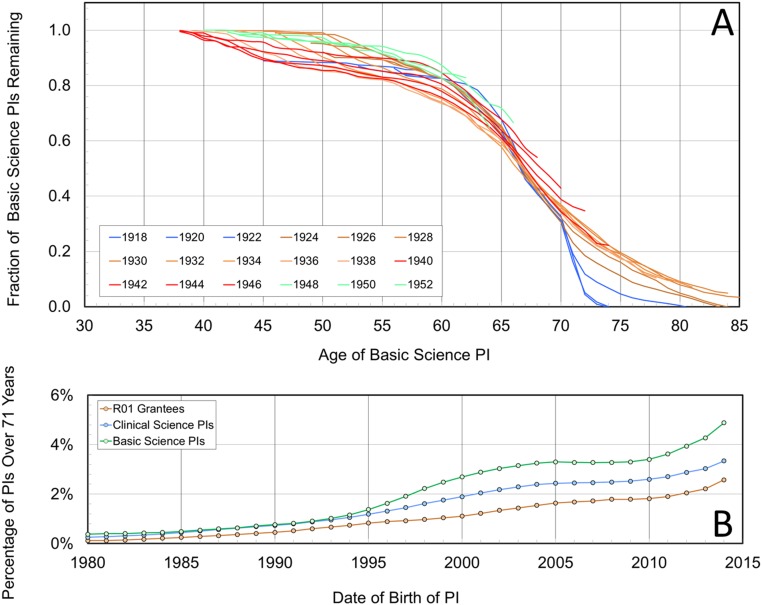
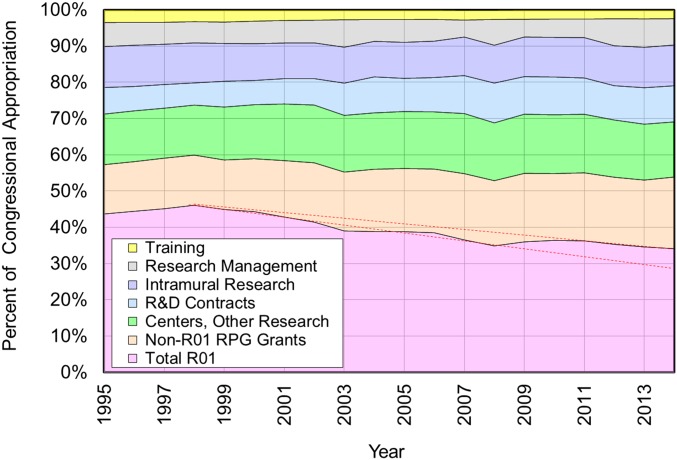
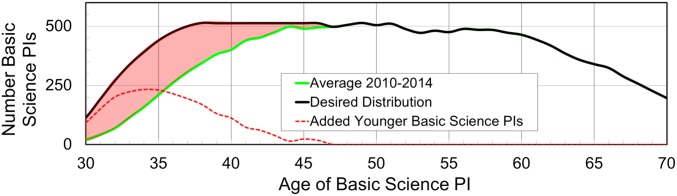
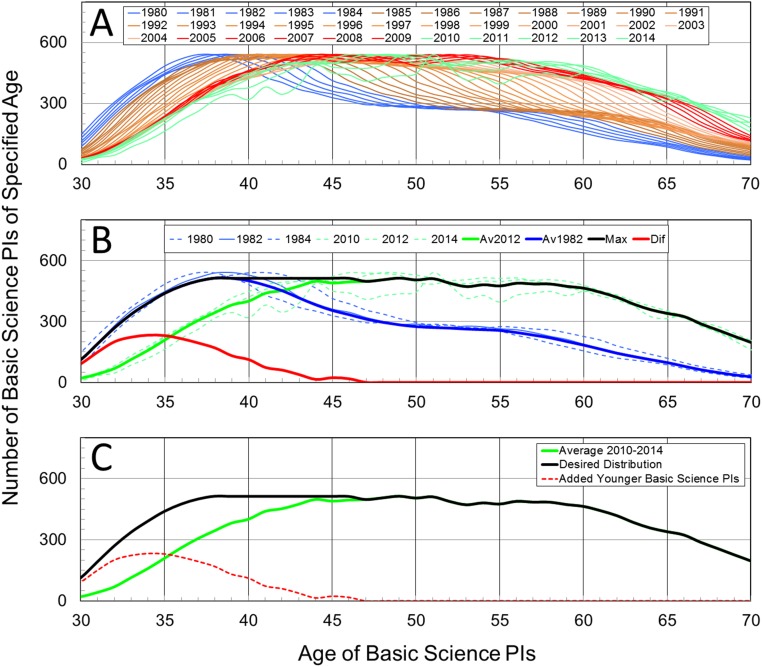
Young researchers are crucially important for basic science as they make unexpected, fundamental discoveries. Since 1982, we find a steady drop in the number of grant-eligible basic-science faculty [principal investigators (PIs)] younger than 46. This fall occurred over a 32-y period when inflation-corrected congressional funds for NIH almost tripled. During this time, the PI success ratio (fraction of basic-science PIs who are R01 grantees) dropped for younger PIs (below 46) and increased for older PIs (above 55). This age-related bias seems to have caused the steady drop in the number of young basic-science PIs and could reduce future US discoveries in fundamental biomedical science. The NIH recognized this bias in its 2008 early-stage investigator (ESI) policy to fund young PIs at higher rates. We show this policy is working and recommend that it be enhanced by using better data. Together with the National Institute of General Medical Sciences (NIGMS) Maximizing Investigators' Research Award (MIRA) program to reward senior PIs with research time in exchange for less funding, this may reverse a decades-long trend of more money going to older PIs. To prepare young scientists for increased demand, additional resources should be devoted to transitional postdoctoral fellowships already offered by NIH.

Keywords: age-related bias; early-stage investigators; independence; mentoring.


Conflict of interest statement

The authors declare no conflict of interest.

Figures

Fig. 1.
Fig. 1.
This figure shows age variation of R01 grantees. The median age grows from 40 to 50, whereas that of the 5% youngest grows from 32 to 37. The average age of first-(FIR) R01 grantees (ref. , black dotted line) is 6 y more than that of the 5% youngest, and halfway to the median age. Age changes for youngest, oldest, and median basic clinical-science PIs are shown in Fig. S1. Since 1980, US life expectancy has increased by 5 y (64).
Fig. S1.
Fig. S1.
This figure shows the age variation of R01 grantees, basic-science PIs, and clinical-science PIs. The average age of first-time (FIR) R01 grantees (15) is shown as a black dotted line. As discussed in Fig. 1, the FIR age is about 6 y older than the threshold age of the 5% youngest. We consider three threshold ages: the 5% oldest (the threshold age of the older 5%); the median age; and the 5% youngest (the threshold age of the younger 5%). In the 34 y from 1980 to 2014, the ages of the oldest 5% of R01 grantees, clinical-science PIs, and basic-science PIs showed changes of 11.3, 7.7, and 9.0 y, respectively. Corresponding changes for the median age are 10.5, 7.1, and 10.3 y, and for the ages of the youngest 5%, they are 6.1, 2.9, and 4.9 y. For the oldest 5% and the median age, basic scientists are always older than clinical scientists, who themselves are older than R01 grantees. For the youngest 5%, since 1989 R01 grantees have been older than either basic- or clinical-science PIs.
Fig. 2.
Fig. 2.
This figure shows numbers of R01 grantees, clinical-science PIs, and basic-science PIs. Our three age ranges are as follows: older (over 55, or >55), middle aged (46–55), and younger (under 46, or <46). A shows that the number of younger R01 grantees has dropped since 1990, the number of middle-aged R01 grantees has dropped from 2004, whereas the number of older R01 grantees grew until 2010 when it remained steady. B shows that numbers of clinical science (CS) PIs have increased, although the growth rate for those over 55 has been most rapid. C shows that basic science (BS) PIs behave more like R01 grantees. The number of younger BS PIs has fallen since 1981, the number of middle-aged BS PIs has fallen since 2005, whereas the number of older BS PIs grows rapidly.
Fig. S2.
Fig. S2.
This figure shows how the age distributions of (A) the number of AAMC clinical-science PIs, (B) the number of AAMC basic-science PIs, and (C) the number of NIH R01 grantees have changed for years of analysis between 1980 and 2014. The raw data are averaged over a running window 5 y wide. The blue lines are the 5 earliest years (1980–1984), whereas the green lines are the 5 most recent years (2010–2014). These are the raw data that are used for much of our analysis.
Fig. 3.
Fig. 3.
NIH congressional appropriation and R01 funding allocations. (A) The appropriation increased exponentially both in inflation-corrected (BRDPI) dollars and nominal dollars, with doubling in 28 and 12 y, respectively. From 2001 to 2012, the appropriation rises above this exponential growth before falling back for excess funding of 104,000 M$. (B) Funding for older R01 grantees increased steadily; for middle-aged grantees, it dropped after 2004; and for younger grantees, it has hardly changed. (C) Since 1995, funds for R01 grantees over 55 increased by 2,313 M$, whereas they decreased by 651 M$ for R01 grantees below 56.
Fig. S3.
Fig. S3.
This figure shows the variation with year of the annual funding per R01 grantees in each of the three age ranges. This funding in inflation-corrected (BRDPI) dollars has been surprisingly constant for each range at 0.49 ± 0.05, 0.65 ± 0.07, and 0.70 ± 0.07 M$ for under 46, between 46 and 55, and over 55, respectively, with a SD that is almost exactly 10% in each case. When the congressional appropriation doubled between 1999 and 2005, funds for each age range increased by 20%, 13%, and 10% for under 46, between 46 and 55, and over 55, respectively. Despite the greater allocation of funds to under 46, the decrease in their numbers continued unabatedly (Fig. 4).
Fig. S4.
Fig. S4.
This figure shows the relationship between the funds allocated to R01 grantees and the number of R01 grantees. These two datasets would be perfectly correlated if all grantees in a particular age group received the same allocation in BRDPI inflation-corrected dollars for each of the years from 1980 to 2014. The Inset correlation coefficient (CC) is that between R01 funding (squares) and number of R01 grantees (circles) in each of the three age ranges. Because grantees get grants that are close to 1 M$, the same x axis can be used for both numbers of R01 grantees and funding in million dollars. A shows the data of older grantees. B shows the data of middle-aged grantees. C shows the data of younger grantees.
Fig. 4.
Fig. 4.
Focus on younger grantees and basic-science PIs. (A) Funding from Congress for under 46 y olds (<46), the numbers of R01 grantees under 46 and the numbers of basic-science PIs under 46 between 1980 and 2014 (dashed lines emphasize trends). (B) Annual change of each of the quantities shown in A, smoothed over 5 y. There is a large jump in funding (purple-shaded peak centered at 1999). This lead to a jump of 1,063 in the number of new basic-science PIs (green-shaded peak centered at 2003). These new basic-science PIs applied for R01 grants, leading to a jump of 750 in the number of grantees (orange-shaded peak centered at 2009).
Fig. S5.
Fig. S5.
(A) Shown is the conventional NIH success rate for R01 and non-R01 RPG grants from 1980 to 2014. The number of applications for both types of grants is shown on the right-hand axis. (B) Shown is the number of grants awarded for both types of grants. For R01 awards, the 40% rise in number of applications between 1990 and 2014 did not lead to an increase in the number of successful applications, which was steady at 5,952 ± 697. For non-R01 RPG awards, number of successful applications did increase sharply from 645 in 1990 to 4,078 in 2014, a 530% increase. The values for R01 success rates are from https://www.report.nih.gov/success_rates/index.aspx. Data for RPG grants were kindly provided through a Freedom of Information Act request.
Fig. 5.
Fig. 5.
The PI success ratio. A shows that, since 1980, the PI success ratio, defined as the ratio of the number of R01 grantees to the number of basic-science PIs of the same age in the same 5-y range, has dropped for PIs younger than 40 and increased for PIs older than 50 (years are blue to green lines). Each curve is normalized to have a maximum value of 1.00. B shows these same curves shifted along the x axis so that the median age of a R01 grantee is 50 (average median age for 2008–2014) using median grantee ages from Fig. 1. Note how the green lines for years 2010–2014 have risen noticeably for PIs younger than 45, rising well above the mean level. This is likely due to boosting of early-stage investigators (ESIs) implemented by NIH after 2008 (27).
Fig. 6.
Fig. 6.
Number of Nobel Prizes (NPs) per decade since 1896. (A) US scientists in basic sciences (medical school departments or research institutes) won more Nobel Prizes in Medicine than other US scientists between 1986 and 2015. (B) In each of the three decades from 1986 to 2005, the United States won more science Nobel Prizes (Physics, Medicine, Chemistry) than the rest of the world. This domination ended in the most recent decade, 2006–2015.
Fig. S6.
Fig. S6.
This figure shows the influence of age on the fraction of number of PIs born in a given year remaining on at a particular age. To tabulate data by PI Birth_Year rather than by PI age and year of analysis, we used the simple transformation: Birth_Year=Year_of_AnalyseAge, with data smoothed by averaging over a 5-y window. Data are shown for basic-science PIs born between 1918 and 1952, a group of PIs who turned, or who will turn, 70 y of age between 1988 and 2022. A shows that there is a clear difference between the retirement of PIs at age 70 for PIs born before 1924 and for those born afterward. This is completely expected as compulsory retirement at 70 was discontinued in 1994 (65). Those PIs born in 1924 turn 70 in 1994. B shows that as a result of the change in retirement policy the percentage of basic-science PIs older than 71 is 4.9% in 2014 compared with an average percentage of just 0.6% for the years 1980–1993; pair is (4.9%,0.6%). The corresponding pairs of percentage values are (3.3%,0.6%) and (2.6%,0.3%) for clinical-science PIs and R01 grantees, respectively. The steep rise in the three curves for R01 grantees, clinical-science PIs, and basic-science PIs after 2010 suggests that this is caused by people younger than 71 in the pipeline. It leads us to believe that it would be relatively easy to predict demographic changes like these.
Fig. S7.
Fig. S7.
This figure shows how NIH budget line items expressed as a percentage of the total appropriation have changed between 1995 and 2014. Seven items are considered in the legend; they constitute the entire congressional appropriation, so their total is always 100%. The same data are used in Table S1. Here, we see that the percentage of the allocation for R01 grants dropped sharply from a high of 46% in 1998 to a low of 34% in 2014. This occurred as other non-R01 grant programs were ramped up to absorb the huge increase in congressional appropriation that occurred from 1999 to 2004. The red dashed lines show that, in 2008, the allocation percentage for R01 grants was increased as competition for dwindling R01 funds became intense. Had this not happened, the percentage allocation for R01 grants in 2014 would have been 5% lower at 29%.
Fig. 7.
Fig. 7.
Correcting the age distribution. Adding 2,255 more young basic-science PIs to obtain as many young PIs as there were in 1980 (Fig. S8).
Fig. S8.
Fig. S8.
The change of the age distribution of basic-science PIs with year of analysis (Fig. S2) is used to derive an age distribution that does not bias against younger PIs. A shows the age distribution of the number of basic-science PIs for years of analysis between 1980 and 2014 normalized to have the same maximum value in any year of 541 (this is the actual maximum value for the Ave2012 distribution and close to 533, the maximum value for the Ave1982 distribution; see below). B shows in blue the distributions for the 5 earliest years of analysis (1980, 1981, 1982, 1983, and 1984), and in green, the distributions for 5 most recent years of analysis (2010, 2011, 2012, 2013, and 2014), together with the average distribution for each of these 5-y periods: Ave1982 (blue) and Ave2012 (green). The maximum of the two average distributions is calculated after normalizing their maximum values to 514, which is the actual value for Ave2012 and 3.52% less than the actual value of 533 for Ave1982. Having the same maximum value produces the flat-topped combined distribution shown in black. The total number of basic-science PIs in the Ave2013 distribution is 16,068, the average of the number of basic-science PIs for the most recent 5 y. The total number of desired basic-science PIs in the combined distribution is higher at 18,323. This increase of 14.0% comprises 2,255 basic science, all of whom are younger than 45 (red). Because R01 grantees younger than 46 receive less money per year than older R01 grantees, these additional PIs could be funded by a 1,000 $M or 12% transfer of R01 funding from PIs above 46 y to PIs below the age of 46. C shows the key features on B and is shown in the main text as Fig. 7.

References

    1. Kaiser J. Biomedical research. The graying of NIH research. Science. 2008;322:848–849. - PubMed
    1. Alexander H, Liu CQ. The aging of full-time U.S. medical school faculty: 1967–2007. AAMC Analysis in Brief. 2009;9:1–12.
    1. Matthews KRW, Calhoun KM, Lo N, Ho V. The aging of biomedical research in the United States. PLoS One. 2011;6:e29738. - PMC - PubMed
    1. White JC, Rush M, Schaffer WT. Biomedical Research Workforce Working Group Report. National Institutes of Health; Bethesda, MD: June 14, 2009.
    1. Arbesman S, Wray K. Demographics and the fate of the young scientist. Soc Stud Sci. 2013;43:282–286.

LinkOut - more resources