. 2017 Jun;29(6):1388-1405.
doi: 10.1105/tpc.17.00108. Epub 2017 Jun 5.

SH3 Domain-Containing Protein 2 Plays a Crucial Role at the Step of Membrane Tubulation during Cell Plate Formation

Affiliations

SH3 Domain-Containing Protein 2 Plays a Crucial Role at the Step of Membrane Tubulation during Cell Plate Formation

Gyeongik Ahn et al. Plant Cell. 2017 Jun.

Abstract

During cytokinesis in plants, trans-Golgi network-derived vesicles accumulate at the center of dividing cells and undergo various structural changes to give rise to the planar cell plate. However, how this conversion occurs at the molecular level remains elusive. In this study, we report that SH3 Domain-Containing Protein 2 (SH3P2) in Arabidopsis thaliana plays a crucial role in converting vesicles to the planar cell plate. SH3P2 RNAi plants showed cytokinesis-defective phenotypes and produced aggregations of vesicles at the leading edge of the cell plate. SH3P2 localized to the leading edge of the cell plate, particularly the constricted or curved regions of the cell plate. The BAR domain of SH3P2 induced tubulation of vesicles. SH3P2 formed a complex with dynamin-related protein 1A (DRP1A) and affected DRP1A accumulation to the cell plate. Based on these results, we propose that SH3P2 functions together with DRP1A to convert the fused vesicles to tubular structures during cytokinesis.


Figures

Figure 1.
Figure 1.
SH3P2 RNAi Plants Display a Defect in Cell Plate Formation. (A) to (E) Phenotypes of SH3P2 RNAi plants. Plants were grown on 0.5× MS plates with or without DEX (10 μM) for 5 d. Overall growth pattern (A), abnormally divided root cells (B), and cell wall stubs (C). Bar = 20 μm. (D) Cell plate formation was monitored in root cells at the fixed focal plane at the indicated time points in the presence and absence of 10 μM DEX. Bar = 5 μm. (E) A 3D image of the cell plate. Serial sections of images of the cell plate indicated by the white dotted line in (D) were used to construct a 3D image. (B) to (E) Magenta fluorescent signals were generated by FM4-64 staining.
Figure 2.
Figure 2.
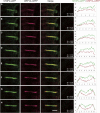
SH3P2 Localizes to the Plasma Membrane, Endosomes, and Cell Plate in the Growing Region of Roots. (A) and (B) Localization of SH3P2-YFP expressed under the control of the native promoter was examined in whole root tissues (A) or single cells (B). Bar = 20 μm. (C) Localization of SH3P2-GFP to the cell plate. The localization of SH3P2-GFP expressed under the control of the CaMV 35S promoter together with FM4-64 was monitored at the indicated time points during cell plate formation. Arrows indicate the leading edges of the growing cell plate. In graphs, the y axis shows the fluorescence intensity of SH3P2-sGFP (Green) and FM4-64 (Magenta) at the cell plate and the x axis is distance (μm). Bar = 5 μm. (D) A 3D image reconstructed using serial sections at the 25 min time point shown in (C). The reconstruction only includes part but not the whole cell plate. Bar = 5 μm.
Figure 3.
Figure 3.
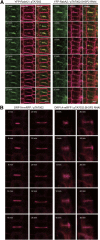
SH3P2 Colocalizes with DRP1A at the Leading Edges of the Cell Plate. The localization of SH3P2-sGFP expressed under the control of the CaMV 35S promoter was compared with that of DRP1A-mRFP at the cell plate during cytokinesis. Serial optical Z-section images were obtained at 1-μm intervals from a dividing cell in root tissues of transgenic plants expressing both SH3P2-sGFP and DRP1A-mRFP. The extent of colocalization between green and magenta fluorescent signals was analyzed by ImageJ to obtain Pearson-Spearman correlation coefficients for localization. The resulting scatterplots are shown with rp and rs values. The level of colocalization ranges from +1 for perfect colocalization to –1 for negative correlation. In graphs, the y axis shows the fluorescent intensity of SH3P2-sGFP (green) and DRP1A-mRFP (magenta) at the cell plate and the x axis is distance (μm). Bar = 5 μm.
Figure 4.
Figure 4.
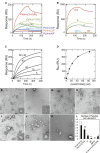
The SH3P2 BAR Domain Binds to PtdInsPs and Induces Tubulation of Liposomes. (A) to (D) The PtdInsPs binding specificity of the SH3P2 BAR domain. (A) His:SH3P2-BAR (100 nM) purified from E. coli extracts was used to determine PtdInsP selectivity by kinetic SPR analysis. The control and active surfaces of the L1 sensor chip were coated with POPC and POPC/POPS/PtdInsPs (77:20:3) vesicles, respectively. PtdInsPs include PtdIns(3,4,5)P3, PtdIns(4,5)P2, PtdIns(3,5)P2, PtdIns(3,4)P2, PtdIns(5)P, PtdIns(4)P, and PtdIns(3)P. (B) Kinetic SPR sensorgrams of binding of wild-type SH3P2 BAR domain and mutants to POPC/POPS/PtdIns(3,4,5)P3 (77:20:3) vesicles. One-site mutants (B and D) showed ∼40% of the response of wild-type protein, whereas the two-site (AB) and four-site (ABCD) mutants had negligible lipid binding. (C) Equilibrium SPR sensorgrams for binding of SH3P2-BAR wild type to POPC/POPS/PtdIns(3,4,5)P3 (77:20:3) vesicles. The concentration was varied from 0 to 80 nM and a near-equilibrium R value (Req) for each concentration was determined. (D) Determination of Kd by nonlinear least-squares analysis of Req versus (SH3P2-BAR) using the equation Req = Rmax/(1 + Kd/P0). The curve fitting yielded Kd = 29 ± 2 nM and Rmax = 512 ± 19, and the theoretical curve was constructed using these parameters. All SPR measurements were performed in 20 mM Tris-HCl, pH 7.4, containing 160 mM KCl. (E) to (K) Electron microscopy analysis of liposome tubulation by the N-terminal BAR domain and respective mutations of SH3P2. TEM of negative-stained liposomes after incubation for 20 min with 2 μM N-terminal SH3P2 protein and its mutants/ Liposomes alone [PC:PE:PI(3,4,5)P3, 77:20:3] (E) or together with N-terminal SH3P2 (F), B mutant (G), D mutant (H), AB mutant (I), or ABCD mutant (J). N-terminal SH3P2 with PI(4,5)P2 liposomes [PC:PE:PI(4,5)P2] (K). (L) Quantification of tubules formed by the N-terminal domain of SH3P2 and each N-terminal domain mutant. At least three TEM images from each grid were used for quantification of formed tubules. NS, not significant; *P value < 0.03 and **P value < 0.013. A Student’s t test was performed to determine the P value for each mutation with respect to wild-type N-terminal SH3P2. Bars = 0.5 μm in (E) to (H), 1 μm in (I) and (J), and 0.2 μm in (K). Error bars indicate the se of the mean.
Figure 5.
Figure 5.
SH3P2 Localizes to the Constricted or Curved Regions of Membranes at the Growing Region of the Cell Plate. (A) and (B) Electron micrographs of Col-0 root meristem cell sections labeled with the anti-SH3P2 antibody. Immunogold particles (arrowheads) are preferentially associated with the growing region of the cell plate (GCP) rather than the maturing region (MCP). (C) and (D) A slice image from an electron tomogram showing an expanding cell plate and 3D model of the cell plate (gold), multivesicular body (MVB), and microtubule (MT) based on the tomogram. The tomogram consists of two consecutive sections (100 nm) labeled with the anti-SH3P2 antibody. Immunogold particles (red spheres) are associated with the narrow tubules (NT) of the cell plate. Arrow indicates the direction of the growing cell plate. Additional slice images are shown in Supplemental Figure 8. (E) and (E’) Top-down views of the cell plate model in (D) after rotating 90°. The cell plate membrane is rendered translucent to reveal immunogold particles in (E’). Reconstructed volumes from the two sections (section 1 and section 2) are marked in (E’). Bars = 0.5 μm.
Figure 6.
Figure 6.
SH3P2 Forms a Complex with DRP1A at the Cell Plate in Dividing Cells. (A) Interaction of SH3P1 and SH3P2 with DRP1A. Protein extracts (Input) from 5-d-old seedlings of the indicated transgenic plants were immunoprecipitated (IP) with an anti-GFP antibody. The immunoprecipitates were analyzed by immunoblotting using anti-DRP1A and anti-GFP antibodies. (B) Interaction of SH3P2 with DRP1A at the cell plate. Root tissues of 5-d-old seedlings of transgenic plants expressing the indicated constructs were examined under a confocal laser scanning microscope. SH3P2 and DRP1A were fused with the N- and C-terminal halves of VENUS (NV and CV), respectively, and vice versa. Bars = 20 μm.
Figure 7.
Figure 7.
Cell Plate-Targeted DRP1A Accumulates around, but Is Not Targeted to, the Leading Edges of the Cell Plate in SH3P2 RNAi Plants. (A) and (B) Targeting of YFP-RabA2 and DRP1A-mRFP to the cell plate. The indicated transgenic plants were grown on 0.5× MS plates vertically in the presence of DEX (10 μM) for 5 d. The targeting of YFP-RabA2 (A) and DRP1-mRFP (B) was examined at the indicated time points under a confocal laser scanning microscope. Magenta fluorescent signals in (A) were generated by FM4-64 staining. Bar = 5 μm. (B) The zero time point image of DRP1A-mRFP/pTA7002:SH3P2 RNAi plants was collected at the scan format of 512 × 512, whereas the other images (4–36 min) were collected at the scan format of 1024 × 1024. The image at the zero time point was enlarged to a similar size as images at other time points and then processed post-collection. Serial optical Z-section images of DRP1A-mRFP/pTA7002:SH3P2 RNAi plants upon DEX treatment (4 min) are displayed in Supplemental Figure 7A.
Figure 8.
Figure 8.
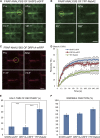
The Rate of Cell Plate Targeting of SH3P2 Is Similar to That of DRP1A, but Not to That of RabA2. (A) to (C) FRAP analysis of SH3P2, DRP1A, and RabA2 targeting to the cell plate. SH3P2 was expressed under the control of the CaMV 35S promoter. The leading edge of the cell plate indicated by the yellow dotted circle was photobleached with a high-intensity 488-nm laser. Images were obtained before and after photobleaching at a time interval of 1 s. Images show prephotobleaching (upper left), after photobleaching (upper right), half-time recovery (lower left), and saturation (lower right). Bars = 5 μm. (D) Quantitative analysis of FRAP recovery of (A) to (C). Error bars indicate the sd (n = 20). (E) and (F) Comparison of immobile fractions (E) and half-time recovery (F) from measurements in (D). Asterisks indicate a significant difference from the corresponding control experiment by the Student’s t test (***P < 0.001). Error bars represent the sd (n = 20).
Figure 9.
Figure 9.
Schematic Model of the Proposed Role of SH3P2 and DRP1A in Cell Plate Formation during Cytokinesis in Arabidopsis. RabA2/A3-positive vesicles derived from the TGN accumulate and fuse to each other via KNOLLE-containing complexes at the center of the dividing cell. SH3P2 contributes to the tubulation of the fused vesicular compartment to produce the hourglass-shaped intermediate. This hourglass-shaped intermediate is further constricted by DRP1A-containing complexes to form the dumbbell-shaped membrane compartment, which is the building block of the TVN. SH3P2 may also play a role in a later step during maturation of the cell plate.

References

    1. Abramoff M.D., Magelhaes P.J., Ram S.J. (2004). Image processing with ImageJ. Biophotonics International 11: 36–42.
    1. Aoyama T., Chua N.H. (1997). A glucocorticoid-mediated transcriptional induction system in transgenic plants. Plant J. 11: 605–612. - PubMed
    1. Backues S.K., Bednarek S.Y. (2010). Arabidopsis dynamin-related protein 1A polymers bind, but do not tubulate, liposomes. Biochem. Biophys. Res. Commun. 393: 734–739. - PMC - PubMed
    1. Bolte S., Talbot C., Boutte Y., Catrice O., Read N.D., Satiat-Jeunemaitre B. (2004). FM-dyes as experimental probes for dissecting vesicle trafficking in living plant cells. J. Microsc. 214: 159–173. - PubMed
    1. Chow C.M., Neto H., Foucart C., Moore I. (2008). Rab-A2 and Rab-A3 GTPases define a trans-golgi endosomal membrane domain in Arabidopsis that contributes substantially to the cell plate. Plant Cell 20: 101–123. - PMC - PubMed

MeSH terms